DID A CAPITAL DEEPENING PARADOX AND SWITCHING POINTS
OCCUR IN INDONESIA?
Ardyanto Fitrady
Faculty of Economics and Business, Universitas Gadjah Mada, Indonesia (arfie.fitrady@ugm.ac.id)
ABSTRACT
This paper discusses the empirical results of wage-profit rate schedules between 2000 and 2008 in Indonesia using input-output analysis. Using a mathematical approach, this paper has four main conclusions. First, there is a decrease in both wage share and profit margin in Indonesia. The decrease may be caused by the increase in relative prices of other inputs such as raw materials that generate inefficiency. Second, there is no proof of reverse capital deepening during the observed period and there is an indication that the capital was getting cheaper relative to other inputs during the period. Third, the capital-labor ratio tends to increase over time. Fourth, there is no proof of switching point and reswitching in technology during the period. However, this paper only provides us with an empirical result during the observed period. It is always possible to have a switching point or reswitching in the economy over a longer period.
Keywords: wage-profit rate schedules, reverse capital deepening, switching point, reswitching.
INTRODUCTION
As a developing country, Indonesia has been expected to experience a rapid technological shift in the last three decades. Theoretically, this technological shift may also change the share of output between capitalists and workers. To examine the existence of technology change, this paper attempts to investigate the shape and the shift of the wage-profit rate relationship in Indonesia by utilizing mathematical models, especially an output model. The input-output data used in this paper is the Input-Output Table of 66 sectors in Indonesia for the years between 2000 and 2008.1 Some researchers have used this approach to investigate the existence of switching points and to prove the existence of reswitching and the capital deepening paradox in capital theory (see Han & Schefold (2005), da Silva (1987), Soklis (2010)). The paradox can be defined as a property whereby it may be efficient to have a lower (higher) rate of interest and a lower (higher) capital per worker. This property
1 The latest input-output table of Indonesia is for year 2010 (published in 2015) and has a different industrial classification from the classifications in Input-Output Tables 2000 and 2008.
is inconsistent with the neoclassical belief that production techniques that are more capital deepening will be optimal as the rate of interest is lowered. It means that a technical choice cannot be considered as a monotonic function of the rate of interest, and consequently this questions the policy implications of the neoclassical view on this matter (Scazzieri, 2008). The main motivation of this research is to investigate the existence of switching point and reswitching in Indonesia in 2000-2008 periods. Further, this research can contribute to the debate about the capital paradox in capital theory by providing some empirical results. By utilizing Indonesia’s input-output data, this research will enrich the discourse regarding capital paradox, especially for the case of developing countries.
It is also expected that the wage share in Indonesia fell in the last ten years, since, to some extent, the economy become more capitalized. Industrialization has been growing rapidly in Indonesia since it recovered from the 1997-1999 economic crisis. Although the economic growth has been fairly high in the last decade (around 5 percent), unemployment and poverty are still problems in Indonesia. In 2016, the poverty rate was about 10.86 percent and—with almost 120 million people in the labor force—, the unemployment rate is 5.61 percent (BPS-Statistics Indonesia, 2017). It is also interesting to investigate what happens to the profit margin and capital-labor ratio. The shift of actual wage share-profit rate will answer this question.
The structure of this paper is as follows. In section 2, we will discuss the underpinning theoretical framework, mostly based on the basic theory in Foley and Michl (1999). In section 3, we will discuss the data we use, and in section 4, we will discuss the empirical procedure and results. Lastly, in section 5 we will discuss the conclusions and provide some concluding remarks.
THEORETICAL FRAMEWORKS
In capitalist economies, we can segregate the value of output (X) into two parts which is called income identity: (1) net profit (T) which goes to capitalists and (2) wage (W) which goes to workers, where net profit is gross profit or cash flow (Z) minus depreciation (D) (Foley & Michl, 1999). Denoting Y as net output, therefore we have:
≡ + = + � + � or = − � (1)
In this economy we will also observe a tradeoff between wages and profit, given a certain production level. The relationship of those two, which is measured in value per worker, is called the wage-profit rate schedule.
Since this paper will analyze the wage-profit rate schedule at two points in time, 2000 and 2008, the procedure will construct two curves that will enable us to observe the shapes of the curves and the existence of a switching point between two technologies and the possibility of
reswitching.2 Reswitching is defined as a state in which a technique or technology is cost-minimizing at two disconnected ranges of the rate of profit (Kurz & Salvadori, 1995).
Furthermore, in a neoclassical economy, we should have a downward sloping demand function. Yet, when there is reswitching, that law will be violated. The decrease in the rate of interest should lead to a more capital-intensive technique. But it is not the case here. If reswitching exists, the interpretation of rate of interest as “price of capital” does not hold in a neoclassical economy since it does not follow the law of demand. The same sense can be used for reverse capital deepening. We have this situation when a lower capital-labor ratio is associated with a lower rate of profit or when the relationship between the value of capital-labor ratio and the rate of profit is increasing. This reverse capital deepening also implies that the demand curve for capital is not always downward sloping.
In a nutshell, there are two issues that come into sight in neoclassical capital theory when more than one sector of production is considered. First, capital is not homogeneous. Two or more sectors of production will very likely have different capital for their production (even one sector of production could use more than one capital). The heterogeneous capital goods cannot be measured and aggregated into one identical physical unit as we have in neoclassical capital theory. Second, as consequences of the first, the prices of capitals are not the same and do not move identically in terms of their directions and values. Thus, it is unrealistic to say that there is only one price for capital. In brief, if types of capital in more than one sector of production are not identical, then we cannot have one aggregate production function that applies to the entire economy as usually assumed in a neoclassical economy. In other words, neoclassical economics describes an economy as one big industrial unit rather than
as a set of many production activities. Thus, the problem may arise when we consider two or more sectors of production in neoclassical economy.
Figure 1. Rate of Profit vs. Wage: Reswitching Technique
Source: Kurz and Salvadori, 1995
Other issues that are problematic for the neo-classical theory of distribution are reswitching and reverse capital deepening. Reswitching is defined as a state in which a technique is cost- minimizing at two disconnected ranges of the rate of profit and not so in between these ranges (Kurz and Salvadori, 1995). Figure 1 describes when there is reswitching of a technique.
Wage-profit relations are downward sloping but can have any shape. Let the curvy thick line be Technique1 and the thick straight line be Technique2. We have three states here: (1) when the wage is higher than wA and rate of profit lower than rA, Technique1 will be chosen over Technique2; (2) when wB<wage<wA and rA<rate of profit<rB, Technique2 will be chosen over Technique1; (3) when the wage is lower than wB and rate of profit is higher than rB, Technique1 will be chosen again. Here the problem arises for neoclassical theory of distribution. When the wage decreases, it implies that the price of capital increases. Hence, the reswitching contradicts the assumption that the proportion of inputs (capital per labor, K/L) will decrease when prices of capital increase, and vice versa. If reswitching exists, the corresponding demand for capital would look like Figure 2 (Samuelson (1966) in Cohen & Harcourt (2003)).
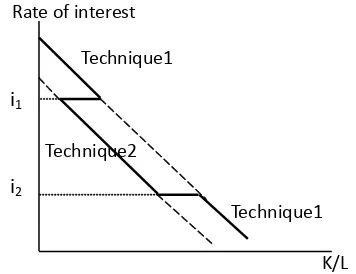
Figure 2. Rate of Interest vs. Capital-Labor ratio: Reswitching technique
Source: Cohen and Harcourt, 2003
In a neoclassical economy, we should have a downward sloping demand function. Yet, when there is reswitching, that law will be violated. A decrease in the rate of interest should lead to a more capital-intensive technique like Tech-nique1. But it is not the case here. When the rate of interest is between i1 and i2, the demand of capital will be zero for Technique1. We can see that the meaning of rate of interest as price of capital does not hold in neoclassical economy in this case since it does not follow the law of demand. It also applies to reverse capital deepening: a lower capital-labor ratio (K/L) is associated with a lower rate of profit. When we have equilibrium, where the value of capital is corresponding to full employment, the level of labor is plotted against the rate of profit, and the equilibrium is unstable. A deviation of rate of profit from equilibrium will lead to the absurd conclusion that one of the two income categories, wages and profit, will disappear. It shows us the failure of demand and supply in neoclassical theory of normal distribution, prices and quantities. This reverse capital deepening also implies that the demand curve for capital is not always downward sloping.
To say that the critique to capital theory is irrelevant from a practical standpoint, because hardly even occurs in applications, is not a strong objection. It may happen in the real world, so such a theory should state this in its assumptions or the theory should be modified if possible. Even neoclassical economist like Samuelson (1962) admitted that in more than
rA rB wB
wA Wage
B A
Rate of profit
K/L
i2
i1
Rate of interest
Technique1
Technique2
one-commodity model, reswitching and reverse capital deepening may happen, and his three parables are not valid anymore at that situation.
DATA
This paper utilizes two main sources of data:
(1) Input-Output Tables. The table contains a comprehensive inter-industry relationship of 66 economic sectors in Indonesia. For the purpose of this research, this paper uses two Input-Output Tables of Indonesia, for 2000 and 2008, which were published by BPS-Statistics Indonesia. The tables are in current producer’s prices in the sense of basic prices.
(2) The Labor Survey Reports (Sakernas). This is a special survey to collect data on labor. This paper uses Sakernas to obtain number of people working in each sector. The were was also published by BPS-Statistics Indonesia.
All data, except for the number of labor, are presented in Indonesian currency (Rupiah).3 However, it will not affect the analysis since the final result will be expressed in ratios.
EMPIRICAL PROCEDURE AND
RESULTS4
To generate wage-profit relationships, first we need to calculate the maximum profit margin to find the intersection of the curve and the axis. Adopting Pasinetti (1977), da Silva (1987) and Kurz & Salvadori (1995), we have the relation between production prices, coefficient of technology, labor, profit margin, and wage rate as follows:
� = + � [�� + �] (2)
Where:
� is a row vector of production prices (1x66)
3 USD 1 is equal to approximately IDR13,250 (Bank
Indonesia, 2017).
4 This paper replicates the procedure in da Silva
(1987) to obtain wage-profit rate schedules for the case of Indonesia and follows the procedure in Miller and Blair (2009) for Input-Output analysis.
� is a matrix of coefficient technology or input coefficient matrix (66x66)
� is a row vector of direct labor input to produce one unit of output (66x1)
� is a uniform profit margin
is a uniform wage rate per worker
The input-output tables provide us with most of those variables, particularly �. In this research, data on number of labor to produce � should be retrieved from another source of data. For the rest, � and , they are calculated from the actual input-output tables by taking the average for the 66 sectors.
Solving for �we then obtain:
� = + � + �[� − � + � �]−� (3)
� is identity matrix 66 x 66. If R denotes the maximum profit margin5, we can calculate R by setting w=0 in Equation 2 and obtain6:
� = + � �� or
�[� − + � �] = (4)
From Equation 4, we can find the maximum eigenvalue, λ, of technology matrix, A, where
det[� − ��] = . (5)
Equation 5 is the determinant of Equation 4 that is needed to gain a positive solution for the maximum profit margin where � = / + � . Following da Silva (1987), it is assumed that � is less than unity so we can calculate � = /� −
. By utilizing numerical method7 it is found that � and � 8 are 0.3332 and 0.4742, respectively. Using the formula we can then obtain the maximum profit margin in year 2000 (R2000) is [(1/0.3332)-1]≈2.00=200% and the profit margin in year 2008 (R2008) is [(1/0.4742)-1] ≈ 1.11=111%.
5 From this point forward, this paper follow the notation in Kurz and Salvadori (1995) that is different from the notation in Foley and Michl in Equation 1.
6 For a different purpose, by setting r=0, we can obtain labor values by calculating p/w
This paper uses wage share as the proxy for relative wages.8 da Silva (1987) argues in his paper that, according to Marx (1969), relative wage will show the position of the classes in society rather than absolute wage. Following Dumenil (1983) and da Silva (1987), we can treat the value of net output per total employment (y) as the numeraire of the production price system. In this case, we have py=1. Mathematically, we have:
� = /� (6)
and = � − � (7)
Where:
� is a column vector of net output per total employment (nx1)
is a column vector of net output (nx1)
N is number of total workers in the economy
X is a column vector of total output per sector (nx1)
By manipulating Equation 3 and solve for w we have:
=
+ �[ + �]−1(8)
Now, first we need to calculate the matrix of the coefficient of technology, A,from the input-output tables. By definition we obtain elements of A by dividing every element in the intermediate input matrix with the corresponding total input (total column in an input-output table) or mathematically:
= (9)
Where:
is an element of A in row ith and column jth, namely coefficient of technology;
� is an element of matrix of intermediate input (processing sectors) in row ith and column jth; and
is total output in column jth.
Then we can calculate Equation 8 which shows the relationship between w and r. By simulating
8 The wage share-profit frontier was also discussed in Michl (1988).
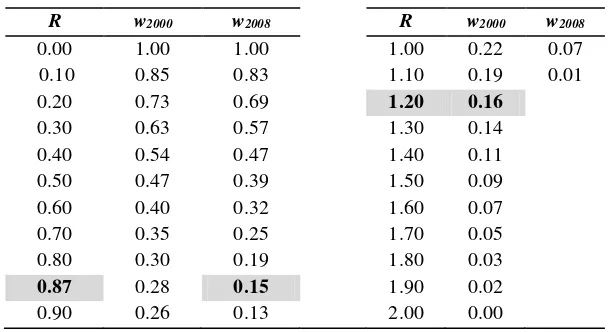
r in range ≤ � ≤ � both for the years 2000 and 2008, this research obtains the results in Table 1.
The shaded values show us the actual points of the economy in 2000 and 2008. This point is found by calculating the average wage share of all sectors in the economy, where wage share of sector j is the element of wage/salary in sector j divided by total output j or = .
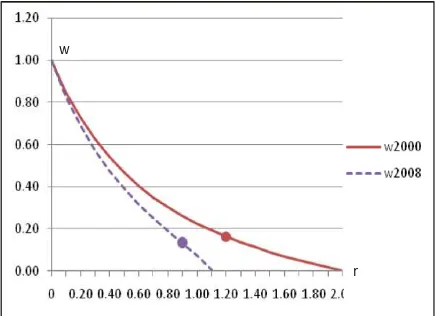
The results show us that in 2000 the actual wage share is 16% and the actual profit margin is 120%. On the other hand, in 2008 the actual wage share is 15% and the actual profit margin is 87%. As we can see, both wage share and profit margin decrease during the period 2000 to 2008. The shape of the wage-profit curve is shown in Figure 3.
Figure 3. Wage-Profit Schedule in Indonesia 2000 and 2008
Source: author’s calculation
As we observed from Table 1 and Figure 3, we can point out that wage-profit (w-r) curves are both convex to the origin and there is no switching point in this result since the w-r curve rotates clockwise around its w-axis. The case of Brazil observed by da Silva (1987) also provides a similar result where the w-r curve shifted to the left from 1970 to 1975. We can conclude that as r moves to a higher level, w will see a larger decline in 2008 than in 2000. We can also observe that in absolute terms, the decrease of actual profit rate is larger than the decrease of wage share between 2000 and 2008.
Table 1. Wage Share-Profit Margin Schedule
R w2000 w2008 R w2000 w2008
0.00 1.00 1.00 1.00 0.22 0.07
0.10 0.85 0.83 1.10 0.19 0.01
0.20 0.73 0.69 1.20 0.16
0.30 0.63 0.57 1.30 0.14
0.40 0.54 0.47 1.40 0.11
0.50 0.47 0.39 1.50 0.09
0.60 0.40 0.32 1.60 0.07
0.70 0.35 0.25 1.70 0.05
0.80 0.30 0.19 1.80 0.03
0.87 0.28 0.15 1.90 0.02
0.90 0.26 0.13 2.00 0.00
Source: author’s calculation
CONCLUSIONS AND SOME CONCLUDING REMARKS
From the previous results, we can summarize and conclude about wage-profit schedule in Indonesia in the 2000-2008 period. First, there was a decline for both wage share and profit margin from 2000 to 2008. The decline may have been caused by the increase in relative prices of other inputs such as raw materials that generate inefficiency. This assumption is reasonable since Indonesia was experiencing relatively high inflation—around 9.5 percent on average— during that period.9 Moreover, we can also observe the decline from the clockwise rotation of the w-r curve around its vertical axis.
Second, there is no proof of reverse capital deepening during that period. The fall of the maximum profit margin in Indonesia between 2000 and 2008 indicates the decline of the output-capital ratio that is also a sign of capital deepening (See Michl, 1988). It also provides an indication that the capital was getting cheaper relative to other inputs during the period.
Third, since the capital-labor ratio (k) is shown by the negative trend of the slope, Figure 1 exhibits that the capital-labor ratio is higher in 2008 than in 2000. Related to the second conclusion, since a higher capital-labor ratio is associated with a lower rate of profit, again,
9 The highest year-to-year inflation rate was in 2005 that reached 17.11% during that period; and year-to-year inflation rate in 2008 was 11.06%.
there is no proof of reverse capital deepening (see Section 2). Consequently, the demand for capital is sloping downward following neoclassical economic theory.
Lastly, there was no switching point and reswitching in technology during the period. It means there was no capital reversing, so this supports neoclassical views on capital theory. This provides us with an empirical result during the period. It is possible that there exists a switching point or reswitching in the economy over a longer period.
REFERENCES
Bank Indonesia, 2017. Available at: http://www.bi.go.id/id/moneter/informasi-kurs/transaksi-bi/default.aspx, accessed on April 13,2017
BPS-Statistics Indonesia, 2107. Available at: https://www.bps.go.id/linkTabelStatis/view/ id/981, accessed on January 2, 2017
Cohen, A. J., & Harcourt, G. C., 2003. "Retrospectives: whatever happened to the
Cambridge capital theory
controversies?". The Journal of Economic Perspectives, 17 (1), 199-214.
da Silva, E. A., 1987. "Wage-Profit Trade-Offs in Brazil: An Input/Output Analysis, 1970-1975". Science & Society (Guilford Press), 51 (3), 347-354.
Dumenil, G., 1983. "Beyond the Transformation Riddle: A Labor Theory of Value". Science & Society (Guilford Press), 47 (4), 427-450. Foley, D. K., and A. Marquetti, 1997 "Economic
Growth from a Classical Perspective" Edited by J. Teixeira, Money, Growth, Distribution and Structural Change: Contemporaneous Analysis. Brasilia: University of Brasilia Press.
Foley, D. K., and T. R. Michl, 1999. Growth and Distribution. Cambridge, Massachusetts: Harvard University Press.
Han, Z., and B. Schefold, 2006. "An Empirical Investigation of Paradoxes (Reswitching and Reverse Capital Deepening) in Capital Theory". Cambridge Journal of Economics, 30 (5), 737-765.
Kurz, H. D., and N. Salvadori, 1995. Theory of Production: A Long Period Analysis. New York: Cambridge University Press.
Michl, T. R., 1988. "Why Is The Rate of Profit Still Falling?" Summer Research Workshop. The Jerome Levy Economics Insititute.
Miller, R. E., and P. D. Blair, 2009. Input-Output Analysis: Foundations and Extensions. 2nd ed. New York: Cambridge University Press.
Pasinetti, L.,1977. Lectures on the Theory of Production. New York: Columbia University Press.
Samuelson, P. A., 1962. "Parable and realism in capital theory: the surrogate production function". The Review of Economic Studies, 29(3), 193-206.
Scazzieri, R., "Reverse capital deepening." The New Palgrave Dictionary of Economics. Second Edition. Eds. Steven N. Durlauf and Lawrence E. Blume. Palgrave Macmillan, 2008. The New Palgrave Dictionary of Economics Online. Palgrave Macmillan. 08 November 2016
Soklis, G., 2011. "Shape of Wage-Profit Curves in Joint Production Systems: Evidence from the Supply and Use Tables of the Finnish Economy". Metroeconomica (Blackwell Publisihing Pte Ltd), 1-13.
Notice: The Journal of Indonesian Economy and Business and its Board of Editors are not responsible