AUTOMATIC EXTRACTION OF ROAD MARKINGS FROM MOBILE LASER
SCANNING DATA
Hao Ma a,b, Zhihui Pei c, Zhanying Wei a,b,* , Ruofei Zhong a a
Beijing Advanced Innovation Center for Imaging Technology, Capital Normal University, Beijing 100048, PR China b
Chinese Academy of Surveying and Mapping, Beijing 100830, PR China c
Beijing Eastdawn Information Technology Co. Ltd., Beijing 100190, PR China ([email protected]; [email protected]; [email protected]; [email protected]) KEY WORDS: MLS data, Extraction, Road Markings, Intensity, Region Growing, Template Matching
ABSTRACT:
Road markings as critical feature in high-defination maps, which are Advanced Driver Assistance System (ADAS) and self-driving technology required, have important functions in providing guidance and information to moving cars. Mobile laser scanning (MLS) system is an effective way to obtain the 3D information of the road surface, including road markings, at highway speeds and at less than traditional survey costs. This paper presents a novel method to automatically extract road markings from MLS point clouds. Ground points are first filtered from raw input point clouds using neighborhood elevation consistency method. The basic assumption of the method is that the road surface is smooth. Points with small elevation-difference between neighborhood are considered to be ground points. Then ground points are partitioned into a set of profiles according to trajectory data. The intensity histogram of points in each profile is generated to find intensity jumps in certain threshold which inversely to laser distance. The separated points are used as seed points to region grow based on intensity so as to obtain road mark of integrity. We use the point cloud template-matching method to refine the road marking candidates via removing the noise clusters with low correlation coefficient. During experiment with a MLS point set of about 2 kilometres in a city center, our method provides a promising solution to the road markings extraction from MLS data.
1. INTRODUCTION
The Advanced Driver Assistance System (ADAS) and self-driving technology are hot spots of current social development. 10 million self-driving cars will be on the road by 2020 in an in-depth report from BI Intelligence (2016). The high-defination (HD) map is indispensable not only to allow a car to locate itself on the traffic lane but also enable a vehicle to take corresponding actions correctly (Guizzo, 2011). Road markings in three dimension (3D) are the important part of HD map,
which are crucial in providing guidance and information to drivers and pedestrians.
Traditional methods have developed to extract road markings from digital images and videos based on image recognition technology (Ding et al., 2014; WANG et al., 2014). However, These methods are greatly influenced by the environment, such as viewpoints, illumination conditions, occlusions, which is challenging to effectively recognize and extract different types of road markings from images and videos.
With the rapid development of laser scanners and inertial navigation system, Mobile laser scanning (MLS) system is widely used in capturing spatial data of real-world. It is an effective and efficient method for acquiring highly accurate, precise, and dense geo-referencing 3D topographic data (Puente et al., 2013). The reflection intensity is an important information of the laser points, and the road markings’ intensity has a great contrast with surrounding road surface. This feature is used to extract road markings in many papers. Some researchers used the laser points intensity of road surface to generate geo-referenced feature image (Guan et al., 2014; Yang et al., 2012; Kumar et al., 2014; Hervieu et al., 2015). Segmentation step is then performed in the image space by chaining a set of thresholding and morphological filters. This
method may lose some accuracy when converting point clouds to image. Vosselman (2009) and Yu et al. (2014) used the segmentation method by directly clustering the laser points into individual markings. This segmentation is distance-dependent and multi-thresholding based on laser points intensity.
The objective of this paper is to design an algorithm to automatically extract road markings from MLS laser point clouds, and evaluate extracting results. Section 2 describes the SSW MLS system, data acquired from it and study areas. Section 3 presents our method to extract road markings. The conducted test results are described and analyzed in Section 4. Conclusions and future work are presented in Section 5.
2. STUDY AREA AND DATA
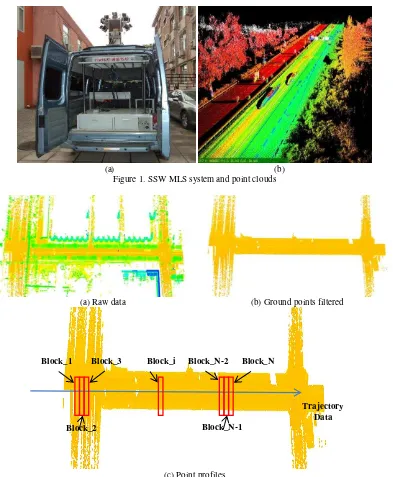
Data is collected by SSW MLS system, shown in Figure 1(a), which is integrated with a RTW laser scanner with laser pulse repetition rates (PRR) up to 550 kHz and 200 scan lines per second, an inertial navigation system, a wheel-mounted Distance Measurement Indictor (DMI), and four high-resolution cameras. The laser scanner is 360 degree field of view and the angle between scanning plane and road surface is 45 degree. Figure 1(b) shows the 3D point clouds collected using this system, these points are rendered with intensity value.
The test area is located in Shenzhen, one of the first-tier cities in China, 2 km long urban expressway. The data is collected at a vehicle speed of 55 Km/h. At the ground surface just below the scanning center, the distance between points in same scan line is 6mm, and distance between scan lines is 7.5cm. The distributing range of laser points intensity is from 8000 to 10000.
(a) (b) Figure 1. SSW MLS system and point clouds
(a) Raw data (b) Ground points filtered
(c) Point profiles
Figure 3. Extracting results of ground points based on 8-neighbor elevation filtering
3. PROPOSED METHODOLOGY
3.1 Ground points filtered
●
●
●
●
●
●
●
●
●
Figure 2. 8-neighbor filter
In order to extract road marking point clouds, we firstly filter ground points from raw laser points data. Compared with other objects, the elevation of ground points has no big difference within a local range. In order to eliminate the influence of topography, we define a vehicle frame which is the right-handed coordinate system with its origin at laser scanner’s center, the x-axis is towards the right of the vehicle, the y-x-axis is towards the front of the vehicle, and z-axis is towards the top of the vehicle.
We filter ground points based on the vehicle frame coordinate z. The points with z less than zg are firstly grouped into point set P. Then each point of P performs the same processing: (1)Current point with its neighborhoods in the same scan line and adjacent scan lines form a 3×3 point array, as shown in Fig.2; (2)We
calculate this point array’s ∑Z
1 0 8 0
|
| ... |
|
8
Z
Z
Z
Z
Z
(1)
Where z0is current point’s vehicle frame coordinate z, z1~z8 is
its neighborhood points’ vehicle frame coordinate z; (3) The points with ∑Z less than threshold Zsum are marked, as ground point candidates.
All marked points through above processing form point set R, most of which are ground points, as shown in Fig.3(b). In order to further refine ground points, we search the neighborhood points around each point in P with a certain radius. The minimum z value zmin of these neighborhood points and the z value z0 of center point must satisfy the criteria that z0 - zmin > zs , Block_1
Block_2
Block_3 Block_i Block_N-2 Block_N
Block_N-1
Trajectory Data
8000 9000 10000 i
Ax
Ax
Intensity
Intensity
(a) Ground points colored by intensity values (b) Intensity distribution Figure 4. Intensity information of ground points
where zs is a threshold usually set to 5cm. Otherwise, the center point not satisfied this criteria is discarded as non-ground point and will be deleted from R.
3.2 Road markings extraction
The intensity value of laser point is the most important feature to extract road markings from ground points. Each laser point corresponds to an intensity value, and laser points on different objects have different intensity values. The laser intensity value depends on a variety of factors, such as the object's material, color, the distance from the object to the scanner, the angle of incidence, etc.
Because the road markings on ground are painted with reflective material, the intensity values of these laser points are apparently higher than nearby pavement, as shown in Fig.4(a). We use the vehicle precise trajectory results to section ground points into a set of blocks Block_i(i=1,2,…N) at an interval(Wp), as shown in Fig.3(c). The intensity distribution statistics of profiles are presented at Fig.4(b), in which x-axis is vehicle frame coordinate x and y-axis is laser point intensity value. As shown in this figure, the intensity value at location of road markings obviously presents a convex point, while non-road marking places are almost flat. By calculating the intensity difference between the current point and its left and right points, the current point is considered as the seed point of road markings if its intensity difference exceeds an optimal threshold. This threshold IT is not a fixed value, but inversely proportional to the distance r from laser point to the laser scanner.
The points on road markings especially arrow markings are not totally detected after threshold filtering of intensity jumps. The detected points are used as seeds to region grow in the next step. Region growing is still based on laser point intensity values, the points with intensity values close to the seed points are raised. Figure 5 shows the process of straight arrow marking’s region growing. There are two parameters for region growing: Distance threshold for reigion growing Dg, Intensity threshold Ig. Meanwhile, region growing is also a procedure of points segmentation, where many point clusters are generated. One point cluster corresponds to an arrow marking, or a lane marking, or noise points. Template match method is used to remove noise clusters in next step.
Figure 5. Region growing process
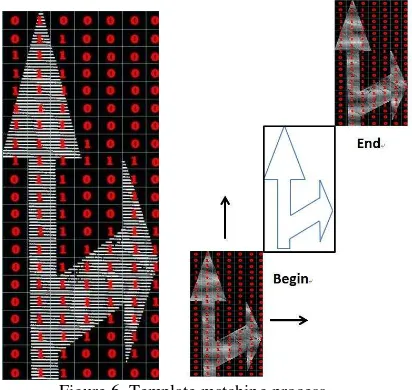
Template matching method uses morphological principles to extract and locate road markings. Each type and size of road
marking is made into a template and all templates form a template library. Road marking template actually is a binary image, the size of which is the outer rectangle in the direction of vehicle trajectory. The pixel size is related to the distance between laser points, generally set to 1.5-2 times of this distance. Figure 6 shows the template of straight and right arrow marking, in which the pixel size is 10cm and the pixel value is 1 if there is at least one laser point in the pixel and it is 0 if no point in it.
Figure 6. Template matching process
Before matching the templates to point clusters, each point cluster must be rotated to the direction of trajectory to ensure that the template and the point cluster are in the same local coordinate system. The first step of matching procedure is establishing the binary image of point cluster, same to template binary image. The pixel size of these two binary image is the same. Then the template image is moved pixel by pixel to match point cluster image, the correlation coefficient CT is calculated at any moving position by the following Eqs.(2).
CT = NF / NB (2) Where NF is the total pixel number of target point cluster, NB is the number of pixels that the corresponding pixel values in two images are the same. When the CT value is larger, it means that the target point cluster’s type and size is closer to current template.
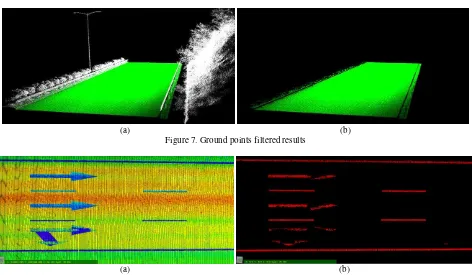
(a) (b) Figure 7. Ground points filtered results
(a) (b) Figure 8. Results after points profile filtering
For current point cluster and current template, we record the maximum of CT at all movement location of template and relative position between template and point cluster. If there are N templates, then each point cluster has N correlation coefficients Ci(i=1~N). We choose the maximum of these N values as the final correlation coefficient of current point cluster Cj(j=1~M,M is the number of all point clusters). Here we set a threshold Cp, the point cluster will be regarded as the marking type same to the template if its Cj exceeds Cp, otherwise it is noise points.
It needs to make note that this template matching method is not necessary to classify lane markings because the width of lane markings is usually small and fixed, 0.1-0.2m. We classify the point clusters with width less than 0.2m and length between 5m and 7m after region growing as broken laneline markings, while the width less than 0.3m and length greater than 7m as solid edgeline markings.
3.3 Road markings vectorization
For the various types of arrow road markings, the vectorization method is placing the external contour vector of corresponding template to the location of maximum Ci. As the width of lane markings is fixed, we calculate the centerlines as their vectors.
4. RESULTS
To assess the performance of our road marking extraction method, we selected a 2km long urban expressway to test. There are 7 major types of road markings on the ground surface of this test data: broken laneline markings, solid edgeline markings, straight arrow, straight and right arrow, straight and left arrow, right arrow, left arrow.
4.1 Ground points filtered
Since the road in the test area is basically flat, there is no slope in the direction perpendicular to the road, we set zg as -2.7m
that is only laser points less than 30cm higher than ground surface are filtered because the zg value of ground just below the laser scanner is -3.0m. The parameters of Zsum and zs are related to point density, the higher of point density, the smaller of the two values. By experimentation we found that when Zsum = 0.03 and zs = 0.01 the ground points are extracted most and non-ground points least. Figure 7 shows the performance of non-ground points filtered.
4.2 Road marking extraction
4.2.1 Filtering by profiles
We set the parameters of point cloud profiles as follows: Wp = 0.5m, Dp = 0.3m, IT is dynamic parameter which is 300 at the ground just below the laser scanner on the basis of intensity distribution statistics. The value of IT at other places in the direction perpendicular to the road is
ITi = 300 / ( Li / L0 ) (3) where Li is the distance between any ground laser point and laser scanner, L0 is the distance from laser scanner to the ground. Figure 8 shows the extract result after point profile filtering, in which laser points on lane markings are almost complete and the arrow markings are severely missed and needs further processing.
4.2.2 Region growing
The parameter Dg for growing distance is related to points interval, we set Dg as 18cm that is 2.5 times of points interval in the trajectory direction. This ensures that each road marking can grow into a full point cluster and minimize noise points. Similar to IT, the parameter Ig is inversely proportional
to
laser distance. We compared the performance of Ig = IT/5, IT/4, IT/3, IT/2, shown in Figure 9. When Ig = IT/5 and Ig = IT/4, the road markings are incomplete and there are too much noise points when Ig = IT/2. It is the best performance when Ig = IT/3. The International Archives of the Photogrammetry, Remote Sensing and Spatial Information Sciences, Volume XLII-2/W7, 2017(a)Ig= IT/5 (b)Ig= IT/4
(c)Ig= IT/3 (d) Ig= IT/2 Figure 9. Region growing performance with different parameters
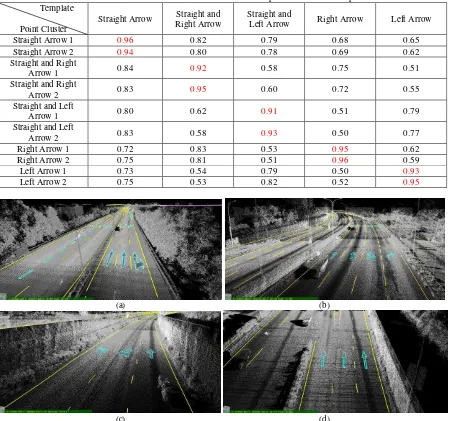
Table 1. Statistics of correlation coefficients between point clusters and templates Template
Point Cluster
Straight Arrow Straight and Right Arrow
Straight and
Left Arrow Right Arrow Left Arrow
Straight Arrow 1 0.96 0.82 0.79 0.68 0.65
Straight Arrow 2 0.94 0.80 0.78 0.69 0.62
Straight and Right
Arrow 1 0.84 0.92 0.58 0.75 0.51
Straight and Right
Arrow 2 0.83 0.95 0.60 0.72 0.55
Straight and Left
Arrow 1 0.80 0.62 0.91 0.51 0.79
Straight and Left
Arrow 2 0.83 0.58 0.93 0.50 0.77
Right Arrow 1 0.72 0.83 0.53 0.95 0.62
Right Arrow 2 0.75 0.81 0.51 0.96 0.59
Left Arrow 1 0.73 0.54 0.79 0.50 0.93
Left Arrow 2 0.75 0.53 0.82 0.52 0.95
(a) (b)
(c) (d)
Figure 10. Final vectorization results of road markings
4.2.3 Template matching
After region growing based on intensity values, although point clusters of road markings are mostly complete, there are also
some noise clusters. In order to remove these noise clusters and meanwhile calculate each marking cluster’s type, template
matching method is used, the correlation coefficients between point clusters and templates are listed in Tab.1.
As seen from statistics in Tab.1, if we set the correlation coefficient threshold Cp = 0.9, all the point clusters are classified correctly, which proves that our template matching method is feasible.
4.3 Vectorization of road markings
For further application, the 3D vectors of road markings are generated after classification of each point cluster. The vectorization results of test data are shown in Figure 10.
4.4 Results assessment
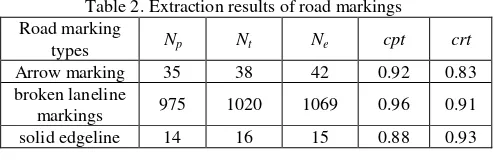
We processed the test data of 80 million laser points on a laptop with an Intel Core i7-4720HQ 2.6GHz processor, with 16GB markings by the proposed algorithm, Nt is the ground-truth road marking numbers collected by the manual interpretation method, and Ne represents the whole number of road markings extracted by the proposed algorithm. Table 2 lists the extraction results of road markings.
Table 2. Extraction results of road markings Road marking road markings from MLS point clouds. It makes full use of the features of MLS point clouds that high precision, high density and rich intensity information. This method firstly filtered ground points from raw data using 8-neighbor elevation filter. Trajectory data are used to partition ground points into a set of profiles and intensity jumps are detected. Road markings are
finally extracted via region growing and template matching methods. Based on the results of test data, the developed workflow is capable of rapid extraction and classification of the road markings from the MLS point clouds.
For certain types of road marking, such as hatch markings, word markings and stop lines, our method is not effective and needs to be improved to extract all types of road markings in the future.
REFERENCES
Ding, D., Yoo, J., Jung, J., Soon, K., 2014. A Road Marking Extraction Method Using GPGPU. Advanced Science and Technology Letters Vol.50 (CST 2014), pp.46-54.
Wang, J., Wang, R., Hui, F., Zhao, X., Du, F., 2014. Road marking segmentation method for research based on splitting and merging algorithm. Application Research of Computers, 2014(31), 3880-3884.
Guan, H., Jonathan, L., Yu, Y., 2014. Using mobile laser scanning data for automated extraction of road markings. ISPRS Journal of Photogrammetry and Remote Sensing 87 (2014) 93– 107.
Yang, B., Fang, L., Li, Q., Li, J., 2012. Automated extraction of road markings from mobile lidar point clouds. Photogrammetric Engineering & Remote Sensing 78(4), 331–338.
Kumar, P., McElhinney, C. P., Lewis, P. and McCarthy, T., 2014. Automated road markings extraction from mobile laser scanning data. International Journal of Applied Earth Observation and Geoinformation 32(0), pp. 125 – 137.
Yu, Y., Li, J., Guan, H., Jia, F. and Wang, C., 2014. Learning hierarchical features for automated extraction of road markings from 3-D mobile lidar point clouds. IEEE Journal of Selected Topics in Applied Earth Observations and Remote Sensing, 8(2), pp.709-726.
Guizzo, E., 2011. How Google’s self-driving car works. http:// spectrum.ieee.org/automaton/robotics/artificial-intelligence/ how-google-self-driving-car-works/
BI Intelligence, 2016. 10 million self-driving cars will be on the road by 2020. http://www.businessinsider.com/report-10-million-self-driving-cars-will-be-on-the-road-by-2020-2015-5-6 Hervieu, A., Soheilian, B. and Bredif, M., 2015. Road marking extraction using a model and data-driven rj-mcmc. In: ISPRS Annals of Photogrammetry, Remote Sensing and the Spatial Information Sciences, Vol. 1, pp. 47–54.
Vosselman, G., 2009. Advanced point cloud processing, In:
Photogrammetric Week’09, Stuttgart, Germany, pp.137-146. The International Archives of the Photogrammetry, Remote Sensing and Spatial Information Sciences, Volume XLII-2/W7, 2017