EFFECTS OF THE RAINSTORM ON URBAN ROAD TRAFFIC SPEED
——
A CASE
STUDY OF SHENZHEN, CHINA
Qiuping Li a,b, Xiaoyu Haoa, Wenchen Wanga, Anjing Wua, Zhongqin Xiea
School of Geography Science and Planning, Sun Yat-sen University, Guangzhou 510275, China - (liqp3@mail.sysu.edu.cn) b Center of Integrated Geographic Information Analysis, Sun Yat-sen University, Guangzhou 510275
Commission WG IV/4, WG III/8 and WG V/4
KEY WORDS: Urban Traffic Speed; Rainstorm; Taxi-enabled GPS Tracking Data; Traffic Speed Variation Rates; Spatial Variance
ABSTRACT:
The adverse weather may significantly impact urban traffic speed and travel time. Understanding the influence of the rainstorm to urban traffic speed is of great importance for traffic management under stormy weather. This study aims to investigate the impact of rainfall intensity on traffic speed in the Shenzhen (China) during the period 1 July 2015 – 31 August 2016. The analysis was carried out for five 1-h periods on weekdays during the morning periods (6:00 AM – 11:00 AM). Taxi-enabled GPS tracking data obtained from Shenzhen city are used in the analysis. There are several findings in this study. Firstly, nearly half of the roads are significantly affected by the rainstorm. Secondly, the proportion of positive correlated roads is about 35%, but there still are some roads with uncorrelated traffic speed variation rates (SVR) and rainfall intensities. Thirdly, the impact of the rainstorm on traffic speed is not homogeneous but with obvious spatial difference. This research provides useful information that can be used in traffic management on a city-wide scale under stormy weather.
1. INTRODUCTION
Weather conditions especially the rainstorm may significantly impact traffic speed and travel time, resulting in deterioration of roadway network performance. Uncovering the relationship between the rainfall intensity and the variation of road traffic speed is of interest in transportation studies. Understanding the influence of the rainfall on transportation performance has the potential to provide guidance for transportation management and urban planning.
The existing studies concerning the influence of weather on transport have mainly focused on the impacts of weather conditions on uncongested expressways (Smith et al., 2004; Okamoto and Furuy, 2004; Daniel et al., 2004; Byunet al., 2010; Zhang et al., 2013). For instance, Okamoto and Furuy (2004) established speed-flow-density relationships on highways under rainy conditions and analysed the impacts of rainfall on highway capacity. Byunet al. (2010) made statistical regression analysis with traffic data of six highways of New Jersey in America and built the traffic models for highways in rainy days. However, urban roads have different characteristics from that of expressways. First, they are usually shorter in length than rural roads. Second, they have complex network structure. Third, they carry more interrupted traffic due to intersections and pedestrian crossings. These characteristics make it difficult to apply the findings of study on expressways to that of the urban roads.
There is also some recent literature on the impacts of weather conditions on urban traffic performance (Kamgaand Yazici, 2014; Lam et al., 2013; Tsapakis et al., 2013; Andersen and Torp, 2016). For example, Tsapakis et al. (2013) investigated the impact of different intensities of rain on macroscopic travel times in the Greater London area (UK) and found that the ranges of the total travel time increase due to light, moderate and heavy rain are:0.1–2.1%, 1.5–3.8%, and 4.0–6.0% respectively. Andersen and Torp (2016) used large-scale GPS data to analyse the correlation between travel time and the weather classes, and they found that snow can increase the
travel time up to 27% and strong headwind can increase the travel time with up to 19% (compared to dry calm weather). A common finding on a global scale of these work is that rainfall or other adverse weather has negative effects on urban traffic efficiency. However, the spatial difference of the impact of the rainstorm on traffic speed has not been well investigated.
Another drawback of the previous literature is that the lack of weather and traffic data of high spatial granularity. Some older studies were highly based on manual traffic counts and weather data that were obtained from a limited number of weather stations. Therefore, studies on the weather effects on urban traffic speed in a city-wide area are still rare. The quantification of weather effects on urban traffic speed with a high spatial granularity in a city-wide area is faced with many challenges because of abovementioned reasons.
In this study, we selected 9 weekdays with stormy weather from the period 1 July 2015 – 31 August 2016, to analyse the impacts of the rainstorm on urban traffic speed. Firstly, the significance test is implemented to verify the variations of traffic speed in stormy days are not stochastic. Then, the correlation of the rainfall intensities and SVR of individual road is analysed to explore the relationship of these two variables. Finally, the spatial difference of the rainstorm on traffic speed is studied and four types of roads are identified, namely speed rise greatly, speed rise slightly, speed decline slightly, and speed decline greatly.
The rest of this paper is organized as follows. The next section describes the study area and data source. The methods on significance test and correlation analysis are presented in Section 3. Section 4 analyses the results. The final section provides concluding remarks and future research directions.
2. STUDY AREA AND DATA SOURCE
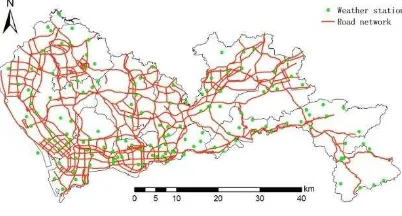
data used in this study includes meteorological data from weather stations, road network data, and urban traffic data. The meteorological data is hourly rainfall data of 148 weather stations in Shenzhen from 1 July 2015 to 31 August 2016. The spatial distribution of weather stations is shown in Figure 1. The road network data has a total of 423 road links, including expressways, major roads and secondary roads and so on. The urban traffic data is the location data of taxis equipped with GPS receivers in Shenzhen, including license plate numbers, GPS time, latitude, longitude, speed, and directions. The GPS-enabled taxi tracking data covers the same period with that of the meteorological data.
Figure 1. Spatial distribution of weather station and road network in Shenzhen
According to the grades of rainfall of China Meteorological Administration, nine weekdays (July 21, July 24, September 21 in 2015, January 28, January 29, April 13, May 10, May 21, June 6 in 2016) were categorized as stormy days. The GPS-enabled taxi tracking data as well as the rainfall monitoring data of these days were taken as the data of this research. The analysis of this paper was carried out for five 1-h periods on nine stormy days during the morning periods (6:00 AM – 11:00 AM). For each weather station, the corresponding Thiessen polygon was used to denote its affected area. If a road is within a Thiessen polygon, the rainfall intensity of this road can be assigned by its corresponding Thiessen polygon.
The taxi GPS data was connected to the roads by map matching (Zeng, et al.,2011), and the road average speed was estimated weather was used as the basic condition of the urban road speed. In order to measure the difference between the rainstorm and clear weather, the SVR of road i is calculated as follows:
�=���−�� stormy weather, significance test using t statistic was applied in this study.
When the mean of SVR is 0, it is considered that the rainstorm will not cause the significant change of road speed. Assuming X~N (μ, σ), the hypothesis to be verified is H0: μ=0 , H1: μ≠0. The average SVR is written as X̅ and the variance of X is
denoted by SD2. Then the t-test statistic is defined ast= X̅ √SXn . Under the significance level α, the reject region is |t| tα|n −
|. If |t| falls into the reject region, the null hypothesis H0 will be accepted, which implies that the rainstorm will not cause significant change in speed. Otherwise, it is considered that the stormy weather will result in the significant road speed change.
3.2 Correlation analysis
The correlation between different data is usually measured by the Pearson’s correlation coefficient and the Spearman’s correlation coefficient. The Pearson correlation is used to measure the linear correlation between two variables that obey the binary normal distribution; the Spearman correlation is a nonparametric measure of rank correlation, and this method can access the monotonic (nonlinear) relationship between two variables. In this study, Pearson’s and Spearman’s correlation coefficients are calculated to analyse whether there is a linear correlation or a rank correlation between urban road SVR and rainfall intensity.
Dataset Y contains the rainfall intensity for each roadway of the stormy days, �= �� i = , … n , �� is defined as the precipitation data of each road in stormy weather. The formula for the Pearson's correlation coefficient is:
ρ = ∑� �− ̅ �− ̅
Significance test was conducted on all roads in nine stormy days. The average of |t| and the proportion of significant roads in all roads for each day were calculated to evaluate the effects of rainstorms on traffic speed in the entire road network. Under the significance level α=0.1, |t|≥1.48 means that the SVR of roads changes significantly in the stormy weather. As shown in Table 1, in each stormy day, at least 35% urban roads are significantly affected by the rainstorm.
Date
2016/5/10 2.39 53.2% 2.32 53.2%
2016/5/21 2.03 45.4% 1.87 44.7%
2016/6/6 2.29 52.2% 2.19 50.6%
Significance level α=0.1,tα|n-1|= 1.48
Table 1. Results of T test for urban roads in Shenzhen city
In order to identify the frequency of an individual road significantly affected by the rainstorm in nine stormy days, we calculated the proportion of the roads which are significantly affected by the rainstorm for 9 days, more than 8 days, more than 7 days, and more than 6 days (Table 2). It can be found in Table 2 that there are 3.78% roads effected significantly in one direction and 5.44% roads in the other direction in all nine stormy days. Moreover, 29.31% roads in one direction and 27.66% roads in the other direction are affected significantly in over six stormy days.
Significance levelα=0.1,tα|n-1|=1.48
Table 2. Statistics for the urban road significantly effected
To find out whether effects of rainstorms are different in two directions, the proportion of significantly affected roads and the proportion of significantly affected roads in one direction were calculated respectively for each day (Table3). The results show that more than 53.9% roads are affected significantly and more than 31.21% roads are only affected significantly in one direction in each stormy day. It also can be found that in all the significantly affected roads, approximately half of them are only significantly affected in one direction. This indicates that the effects of rainstorm are related to the traffic directions for some roads.
Table 3. Statistic of affected roads
4.2 Correlation analysis
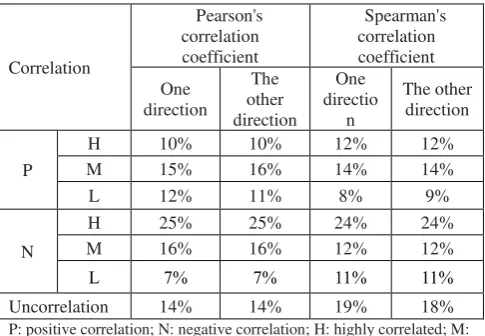
Correlation coefficients of all roads in nine stormy days were calculated to estimate the correlation of rainfall intensity and
SVR in Shenzhen city. The absolute value of the correlation coefficient which falls in the range of 0.6 to 1 represents that the two variables are highly correlated; the absolute value between 0.4 and 0.6 is moderately correlated; the absolute value range from 0.2 to 0.4 is low correlation, and the absolute value less than 0.2 means that the two variables are uncorrelated. Correlation analysis results are listed in Table 4.
Correlation
P: positive correlation; N: negative correlation; H: highly correlated; M: moderately correlated; L: lowly correlated.
Table 4. Correlation analysis results
In general, the results of the Pearson’s correlation and the Spearman’s correlation are similar, and it is clearly shown that the influence of the rainstorm on SVR varies in roads. As shown in Table 4, nearly half of the roads in the study area are negatively correlated in terms of the relationship between SVR and rainfall intensities. This means that the rainstorm generally has a negative impact on urban road speed. Around one quarter of roads show a highly negative correlation between traffic speed and rainfall intensity. The proportions of highly negative Pearson’s correlation coefficients and Spearman’s correlation coefficients are at 25% and 24% respectively. There are also some roads with uncorrelated SVR and rainfall intensities. It is worth noted that the proportion of positively correlated roads is about 35%, which implies that not all the roads go through the deterioration of roadway network performance, and some roads even perform better than clear weather. Another finding is that there is no obvious difference between the correlation coefficients of two traffic directions.
4.3 Spatial difference
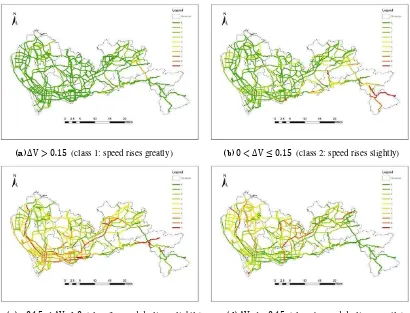
stormy days in this study, road i might belong to different classes in different days. For example, it can be class 3 in some days and be class 4 in other days. Therefore, the number of days that a road belongs to one of four classes was counted. The distributions of the roads in each class are shown in Figure 2 and Figure 3. Figure 2 shows the result of roads in one direction while Figure 3 presents that of roads in the other direction.
As shown in Figure 2 and Figure 3, the number of roads in class 3 and 4 is more than that of class 1 and 2, and this indicates that
the road speed of Shenzhen city goes through a downward trend during the rainfall period. However, the spatial distribution is imbalanced. The roads in the central and the west area are mainly with decreased speed, while the speed of the roads in southeast area rises slightly. This is an interesting finding that the influence of rainstorms on roads is somewhat relative to spatial locations of roads. Form the comparison of Figure 2 and Figure 3, we also can find that the impacts of the rainstorm on road SVR varies in two directions for some roads.
(a)∆V > . 5 (class 1: speed rises greatly) (b) < ∆V . 5 (class 2: speed rises slightly)
(c)− . 5 < ∆V (class 3: speed declines slightly) (d)∆V < − . 5 (class 4: speed declines greatly) Figure 2. Road speed variation classification (one direction)
(c)− . 5 < ∆V (class 3: speed declines slightly) (d)∆V < − . 5 (class 4: speed declines greatly) Figure 3. Road speed variation classification ( the other direction)
5. CONCLUSIONS
Given the lack of detailed guidance on the quantification of speed variation due to the rainstorm, the results of this study may be used to better understand how the rainstorm affects traffic speed in the transport network of Shenzhen. There are several findings in this research. Firstly, nearly half of the roads are significantly affected by the rainstorm. Secondly, the proportion of positive correlated roads is about 35%, but there still are some roads with uncorrelated traffic speed variation and rainfall intensity. Thirdly, the impact of the rainstorm on traffic speed is not homogeneous but with obvious spatial difference. From the findings above, we can infer that the rainfall intensity is not the only reason that results in the variations of urban road traffic speed. To implement more comprehensive analyses to explore other influencing factors is our future work.
ACKNOWLEDGEMENTS
The authors of the paper would like to thank Shenzhen Transportation Operation Command Center for providing the data used in the study. This work was funded by the National Natural Science Foundation of China, (No. 41501424), the Natural Science Foundation of Guangdong Province (2016A030310168), and Open Research Fund Program of Shenzhen Key Laboratory of Spatial Smart Sensing and Services (Shenzhen University).
REFERENCES
Agarwal M., Maze T., Souleyrette R, 2005. Impacts of weather on urban freeway traffic flow characteristics and facility capacity. Mid-Continent. Transportation Research Symposium, 20(5), pp. 1121-1134.
Andersen O., Torp K, 2016. A Data Model for Determining Weather’s Impact on Travel Time. International Conference on Database and Expert Systems Applications. Springer International Publishing, pp. 437-444.
Byun J, Daniel J, Chien S., 2010. Speed-flow Relationships Under Adverse Weather Conditions. Proceedings of the Annual Meeting of the Transportation Research Board. Washington, D C.
Daniel E, 2004. The mixed effects of precipitation on traffic crashes. Accident Analysis and Prevention, 36(4), pp. 637-647.
Kamga C, YazıcıMA, 2014. Temporal and weather related variation patterns of urban travel time: Considerations and caveats for value of travel time, value of variability, and mode choice studies. Transportation Research Part C: Emerging Technologies, 45, pp. 4-16.
Okamoto I, Furuy F, 2004. Including Weather Condition Factors in the Analysis on the Highway Capacity. Proceedings of the Annual Meeting of the Transportation Research Board. Washington, DC.
Smith, Brian L, Kristi B, Rachel C, Susan H, Noah G, 2004. An Investigation into the Impact of Rainfall on Freeway Traffic Flow. Proceedings of the Annual Meeting of the Transportation Research Board, Washington, D.C.
Tam M L, Lam W, Chen B Y, et al, 2008. Using Automatic Vehicle Identification Data for Investigation of Rain Effects on Vehicular Travel Speeds and Travel Choice Behaviour. Traffic and Transportation Studies, pp. 944-955.
Tsapakis I., Cheng T., Bolbol, A, 2013. Impact of weather conditions on macroscopic urban travel times. Journal of Transport Geography, 28(2), pp. 204–211.
Zeng W L, Gong J, He Z, et al, 2011. Analysis of Rainfall Impact on Urban Road Traffic Speed. Environmental Science and Technology, 34(12):, pp. 201- 205.
Zhang C B, Wang P, Mei Z H, et al, 2013. Traffic Flow Characteristics and Models of Freeway under Rain Weather.


