IMPACT OF SPATIAL FILTER ON LAND-USE CHANGES MODELLING USING
URBAN CELLULAR AUTOMATA
M. Omidipoor a, N. N. Samani b *
a PhD Student University of Tehran Dept. of Remote Sensing and GIS Tehran, Iran
b Assistant Professor, University of Tehran Dept. of Remote Sensing and GIS Tehran, Iran
KEY WORDS: Urban Cellular Automata (UCA), Ahvaz, Land-use Change, Spatial Filter
ABSTRACT:
Urban cellular automata is used vastly in simulating of urban evolutions and dynamics. Finding an appropriate neighbourhood size in urban cellular automata modelling is important because the outputs are strongly influenced by input parameters. This paper investigates the impact of spatial filters on behaviour and outcome of urban cellular automata models. In this study different spatial filters in various sizes including 3*3, 5*5, 7*7, 9*9, 11*11, 13*13, 15*15 and 17*17 cells are used in a scenario of land-use changes. The proposed method is examined changes in size and shape of spatial filter whereas the resolution was kept fixed. The implementation results in Ahvaz city demonstrated that KAPPA index is changed in different shapes and types at the time when different spatial filters are used. However, circular shape with size of 5*5 offers better accuracy.
* Corresponding author
1. INTRODUCTION
Most aspects of global environmental changes are directly linked to land-use and land-cover (LULC) changes. thus issues related to LULC have currently attracted interests of different researchers (Stellmes et al. 2013). Urban Cellular automata (UCA) models are among the most popular ways in simulating urban systems, especially for LULC and sprawl (Chen et al. 2013).
Most of the UCA models utilizes from satellite-derived data for prediction of LULC. Cellular Automata (CA) is a kind of discrete grid dynamic model- whose time, space and state are all discrete- spatial interaction and causality on time are completely specified in terms of local relations (Batty 2007).
For simulation of urban evolutions and dynamics by UCA, various tools, methods and scales are applied in different studies. The most employed methods include: fractal modelling (Batty 2007), Markov-cellular automata (Jokar Arsanjani et al. 2013), logistic regression (Jokar Arsanjani et al. 2013), fuzzy cellular automata (Al-Ahmadi et al. 2009) and artificial neural networks (Qiang & Lam 2015). However, land changes involve complex processes that are shaped by dynamic, non-linear human-nature interactions, which can be difficult for available variables and algorithms to capture. Choice of the model is a subject of debate that concerning with the validation of models.
Some researches attempt to test whether one model is more accurate than another model. However, a single model can create various outcomes depending on how the user chooses the model's parameters. If choice of the parameters within a single model produces greater variation in accuracy than the choices among alternative models, then it makes little sense to report that one model is more accurate than another model (Barreira González et al. 2015). Model comparison can be challenging,
because each model offers a variety of choices at each stage in a modelling process.
This paper investigates the impact of spatial filters on the behaviour and outcomes of urban cellular automata models. The concentration of this study is Cellular Automata Markov (CA_MARKOV). We focused on the parameters of the model including filters of the source data. The purpose of this research is examining the effect of spatial filters options on simulated outputs which are described the changes. In this way different spatial filters in various size including 3*3, 5*5, 7*7, 9*9, 11*11, 13*13, 15*15 and 17*17 cells are used. The proposed method examined changes in size and shape of spatial filter when the resolution was kept fixed. The study area is Ahvaz city, Iran. The results of the implementation show that KAPPA index changes for different shapes and types when different spatial filters are used. However, circular shape with size of 5*5 offers better accuracy.
2. URBAN CELLULAR AUTOMATA (UCA) MODELLING
Urban growth is dynamic and complex spatial process that has strict environmental and social impacts (Batty 2007). UCA is an effective model for predicting and modelling quantity of land use changes in urban area. The rapid growth in remote sensing technologies and Geographic information systems (GIS), advances in computer science and its application in the urban planning have led to developing spatial modelling methods such
as CA algorithm. This method was developed by “Ulam” and “Von Neumann” in 1940 (Batty 2007). CA-based model has the ability to represent non-linear, spatial and stochastic processes (Al-Ahmadi et al. 2009). For more than a decade, research focuses have been on models using cellular automata (CA) theory as the approach which is capable to address the spatial complexity of the urbanchanges process (Feng et al. 2016).
In a cellular space we can simulate urban system for future by using information of current situation, neighbourhoods and transition rules. We can use probabilities transition concept to predict LULC in the future. Prediction of the future LULC can be modelled by using the following equations (Eq.s 1-3) (Han et al. 2015): process based on produced transition matrices. The spatial changes are controlled by transition potential maps, configuration of neighborhoods and local transition rule during CA model process. Neighborhood and transition rule can be modelled by spatial filters; therefore, we need to evaluate effect of these options in process of UCA modelling.
Finding the influence domain on state of the cell is important for realistically modeling the urban land-use changes. For this reason we use spatial filters. Specification of the finest spatial filter is a very important challenge in UCA model; therefore we try to study effect of this parameter in the output.
3. SPATIAL FILTER ISSUE IN LAND-USE MODELLING
In UCA model, the transformation of each cell was determined by neighbourhood interactions, based on the transition rules described above. Many LULC problems cannot be modelling at one single scale (Batty 2007). In a UCA, scale is defined by three components: spatial extent, cell size and neighbourhood configuration (Jokar Arsanjani et al. 2013). Neighbourhood configuration determines the distribution and number of neighbours that will have an impact on evolution of each cell. Neighbourhood configuration in a UCA is generally characterized by neighbourhood shape, size and/or distance (radius). Uncertainties in the input data will influence the precision of the model output. To reduce uncertainties, defining optimal spatial filter is necessary; Even though, applying optimal shapes also increases the computational demands.
In recent study various neighbourhood sizes used for LULC modelling, However, no particular validation about what is an appropriate neighbourhood size are specified (Dahal & Chow 2015). This research tries to analyse the model responses and
behaviours with respect to the changes of neighbourhood sizes and types.
The most famous neighbourhoods used in UCA models are Von Neumann (Basse et al. 2014), rectangular – Moore, and circular neighbourhoods. In this study the rectangular and circular neighbourhood types (Figure1) were chosen in order to evaluate the effects of neighbourhood's type on simulation results.
Figure 1. Examples of different neighbourhoods: a) rectangular and b) circular
4. MATERIAL AND METHODS 4.1 Study area
Ahvaz city, capital of Khuzestan province, was selected as the study area. Ahvaz is located in the southwest of Iran. It is one of the fourth largest city of Iran after Tehran, Mashhad and Tabriz (Rahnama et al. 2015). Ahvaz has the world's worst air pollution according to a survey by the World Health Organization (WHO) in 2011 (Goudarzi et al. 2014). Karun river passes through the center of the city and this city has an average elevation of 20 meters above sea level.
In conjunction with sprawl and land-use change in Ahvaz, attention to two points can be useful due to the development of the city, (1) Settlement patterns in the city tends to villa or single-storey dwellings and (2) there is no natural limit to the development of the city. Ahvaz is developed around the Karun River and is situated in the middle of Khuzestan province, of which it is the capital and most populous city. Figure 2 illustrates location of the study area.
Figure 2. Study area location
4.2 Data and Methods
The transition rules in this study, only generated as the spatial
filter. So the ‘specified distance’ is characterized by the
definition of a filter shape and filter size. The spatial filter shapes used in this study are rectangular and circular shapes (Figure 1). Size of a spatial filter is equal to the number of cells of one side row/column. In this study spatial filters including 3*3, 5*5, 7*7, 9*9, 11*11, 13*13, 15*15 and 17*17 are used. Our scenario evaluated the effect of spatial filter changes (size and shape) whereas the resolution was kept fixed.
In this study, multi-annual socio-economic data, multi-temporal city maps, and three scenes of satellite multi-spectral image are collected for evaluating the temporal and spatial characteristics of LUCC from 1986 to 2015. The Landsat images used in this study were acquired from www.usgs.gov. The dataset were on 11st of June 1986, 12th of June 2000, 23th of June with nearly zero percent cloud cover over the region. We tried to select all images in a month for decreasing the effect of seasonal on land use change results. The received Landsat images were already geo-referenced (with 0.005 RMS pixels) at the Universal Transverse Mercator (UTM) projection system (zone: 39N, datum: WGS-84) with 30 m spatial resolution. And atmospheric corrections and geometric corrections were applied on them.
Summary statistics, Markov probabilities and cellular automata simulation were done with TerrSet Software. Research steps include: (1) classification of Landsat data; (2) creation of land-use transition probability matrix; (3) generation of various spatial filters; (4) evaluation and validation of the results. The evaluation of the spatial filter impacts on UCA model are being done based on several methods. In this study we used KAPPA index.
4.3 RESULTS
Maximum likelihood classification was applied for the image classification. Based on field survey of study area, Images were classified by selecting accurate polygons as training areas. Land use classes were classified into 5 categories including Vegetation, River, Barren, Built-up and Salt marsh. Figure 3 depicts result of the classifications.
4
00.51 2 3 4 Kilometers
02.755.5 11 16.5 22 Kilometers
µ
Legend
Vegetation River Barren Built up Salty background
1986 2000 2015
Figure 3. Classification result
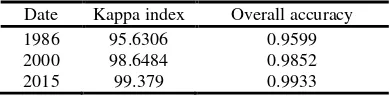
Accuracy assessment results of the classifications are described in Table1.
Table 1. Classifications Accuracy assessment results
Date Kappa index Overall accuracy
1986 95.6306 0.9599
2000 98.6484 0.9852
2015 99.379 0.9933
Classified maps (1986-2000 and 2000-2015) have been used for the calculation of transition probability matrix. Transition probability matrixes is illustrated in tables 2 and 3.
Table 2. Ahvaz transition probability matrix 1986 - 2000
Agriculture River Barren Built-up Salt marsh Agriculture 0.2395 0.0096 0.6780 0.0725 0.0003 River 0.2272 0.3694 0.3927 0.0082 0.0024 Barren 0.0537 0.0025 0.7646 0.1724 0.0073 Built-up 0.0000 0.0000 0.1513 0.8389 0.0001 Salt marsh 0.0674 0.0003 0.7974 0.0660 0.0688
Table 3. Ahvaz transition probability matrix 2000 - 2015
Agriculture River Barren Built-up Salt marsh Agriculture 0.1461 0.0101 0.7592 0.0807 0.0039
River 0.2316 0.2661 0.5002 0.0000 0.0021
Barren 0.0605 0.0026 0.7368 0.1929 0.0072 Built-up 0.0102 0.0006 0.1692 0.8198 0.0002 Salt marsh 0.0722 0.0013 0.8242 0.0843 0.0180
In the next step, potential developmentmap was prepared. Used factors are including Built areas, rivers privacy, and proximity to the roads and availability to the downtown and other legal restrictions.
Figure 4. land-use simulation result of 2015 using rectangular spatial filter: (a) 3*3, (b) 5*5, (c) 7*7, (d) 9*9, (e) 11*11, (f)
13*13. (g) 15*15, and (h) 17*17.
7 different spatial filters were chosen in order to simulate the feature land-use map. The actual map in 1998 and transition probability matrix along with potential development map were used to simulate 2000, then actual map in 2000 were used in order to simulate 2015. Figure 4 illustrates spatial simulation results for rectangular spatial filters with different sizes. For both rectangular and circular shapes simulation are done, then kappa coefficient is calculated in order to measure the accuracy of simulation results.
Figure 5 is presented the rate of kappa coefficient changes in different spatial filters. With increasing in the dimension of spatial filters, there is decrease in kappa index. However the difference between the rectangular and circular shape is meaningful. For circular shaped filter, when the neighbourhood size is 5*5 cells, the precision increases to a maximum, then a decreasing trend is observed. Precision of circular shape in any size is higher than the rectangular shape. An exception is seen with the filter size of 3*3, where the shapes of the rectangular are higher than circular (Figure 5).
Figure 5. Change in kappa index response for two different type and spatial filter size
5. CONCLUSION
In this study, impacts of spatial filter variations on accuracy of the UCA models were studied. Results of this research indicate that there are the meaningful impacts of changing spatial filters especially in size and shape on UCA simulation. Finding an appropriate neighbourhood size in UCA modelling is important because outputs are strongly influenced. It was found that
different spatial filter. However, circular shape with 5*5 cell size offers better accuracy. It should be noted that different results may be obtained in different study areas. Regarding to the variation of spatial filters, it is crucial to understand disadvantages and constraints of the UCA model results. Based on the results of this study it is recommended that in UCA than farther area. Also, it can be stated that this dependency will increase the uncertainty of the model outcomes. As a further consideration we intend to examine different spatial filters in some similar origins and then finding an appropriate standard for selecting the spatial filters at the same areas.
REFERENCES
Barreira González, P., Aguilera-Benavente, F. & Gómez-Delgado, M., 2015. Partial validation of cellular automata based model simulations of urban growth: An approach to assessing factor influence using spatial methods. Environmental Modelling & Software, 69,
pp.77–89. Available at:
http://www.sciencedirect.com/science/article/pii/S13648 15215000882 [Accessed May 27, 2017].
Basse, R.M. et al., 2014. Land use changes modelling using advanced methods: cellular automata and artificial neural networks. The spatial and explicit representation of land cover dynamics at the cross-border region scale. Applied Geography, 53, pp.160–171.
Batty, M., 2007. Cities and Complexity: Understanding Cities with Cellular Automata, Agent-Based Models, and Fractals, The MIT Press.
Chen, Y. et al., 2013. Simulating Urban Form and Energy Consumption in the Pearl River Delta Under Different Development Strategies. Annals of the Association of
American Geographers, 103(6), pp.1567–1585.
Available at:
http://www.tandfonline.com/doi/abs/10.1080/00045608. 2012.740360 [Accessed May 27, 2017].
Dahal, K.R. & Chow, T.E., 2015. Characterization of neighborhood sensitivity of an irregular cellular automata model of urban growth. International Journal of Geographical Information Science, 29(3), pp.475–497.
Feng, Y., Liu, Y. & Batty, M., 2016. Modeling urban growth with GIS based cellular automata and least squares SVM rules: a case study in Qingpu--Songjiang area of Shanghai, China. Stochastic Environmental Research and Risk Assessment, 30(5), pp.1387–1400.
Goudarzi, G. et al., 2014. Cardiovascular deaths related to Carbon monoxide Exposure in Ahvaz, Iran. Iranian Journal of health, Safety and environment, 1(3), pp.126– 131.
Han, H., Yang, C. & Song, J., 2015. Scenario simulation and the prediction of land use and land cover change in Beijing, China. Sustainability, 7(4), pp.4260–4279.
Jokar Arsanjani, J. et al., 2013. Integration of logistic regression, Markov chain and cellular automata models to simulate urban expansion. International Journal of Applied Earth Observation and Geoinformation, 21,
pp.265–275. Available at:
http://www.sciencedirect.com/science/article/pii/S03032 43411002091 [Accessed May 27, 2017].
Qiang, Y. & Lam, N.S.N., 2015. Modeling land use and land cover changes in a vulnerable coastal region using artificial neural networks and cellular automata. Environmental Monitoring and Assessment, 187(3), p.57.
Available at:
http://www.ncbi.nlm.nih.gov/pubmed/25647797 [Accessed May 27, 2017].
Rahnama, M.R., Alizadeh, H. & Naghibi Rokni, S.N., 2015. Spatial analysis of urban land use access to urban green spaces Case Study: Zone 6 of Ahvaz City, Iran. The International Archives of the Photogrammetry, Remote Sensing and Spatial Information Sciences, 4(2), pp.42– 49.
Stellmes, M. et al., 2013. Mapping syndromes of land change in Spain with remote sensing time series, demographic and climatic data. Land Use Policy, 30(1), pp.685–702.
Available at:
http://www.sciencedirect.com/science/article/pii/S02648 37712000920 [Accessed May 27, 2017].