E C O S Y S T E M E C O L O G Y
The effects of tree rhizodeposition on soil exoenzyme activity,
dissolved organic carbon, and nutrient availability in a subalpine
forest ecosystem
Michael N. WeintraubÆLaura E. Scott-DentonÆ
Steven K. SchmidtÆRussell K. Monson
Received: 20 June 2006 / Accepted: 23 June 2007 / Published online: 27 July 2007 ÓSpringer-Verlag 2007
Abstract Previous studies have found that root carbon inputs to the soil can stimulate the mineralization of existing soil carbon (C) pools. It is still uncertain, however, whether this ‘‘primed’’ C is derived from elevated rates of soil organic matter (SOM) decomposition, greater C release from microbial pools, or both. The goal of this research was to determine how the activities of the microbial exoenzymes that control SOM decomposition are affected by root C inputs. This was done by manipu-lating rhizodeposition with tree girdling in a coniferous subalpine forest in the Rocky Mountains of Colorado, USA, and following changes in the activities of nine exo-enzymes involved in decomposition, as well as soil dis-solved organic C, disdis-solved organic and inorganic nitrogen (N), and microbial biomass C and N. We found that rhi-zodeposition is high in the spring, when the soils are still snow-covered, and that there are large ephemeral popula-tions of microorganisms dependent upon this C. Microbial N acquisition from peptide degradation increased with increases in microbial biomass when rhizodeposition was highest. However, our data indicate that the breakdown of
cellulose, lignin, chitin, and organic phosphorus are not affected by springtime increases in soil microbial biomass associated with increases in rhizodeposition. We conclude that the priming of soil C mineralization by rhizodeposition is due to growth of the microbial biomass and an increase in the breakdown of N-rich proteins, but not due to increases in the degradation of plant litter constituents such as cellulose and lignin.
Keywords DecompositionPinus contorta Soil carbon cycling Soil nitrogen cycling EcosystemCarbohydrates SugarsExudation
Introduction
Under natural conditions, the largest source of labile car-bon (C) inputs to the soil is root exudates (Bertin et al. 2003; Hutsch et al.2002; Kuzyakov2002). Roots exude a variety of low-molecular weight organic compounds, including sugars, amino acids, organic acids, and phenolics (Bertin et al.2003). These compounds are rapidly metab-olized; for example, Hutsch et al. (2002) found that 64– 86% of maize root exudates were respired by soil microorganisms.
Previous studies have demonstrated that labile carbon (C) inputs to the soil, such as root exudates, can stimulate the mineralization of existing C pools (Dalenberg and Jager1989; Ho¨gberg and Ekblad 1996; Mary et al.1993; Subke et al. 2004), resulting in a ‘‘priming’’ effect. In a review of the mechanisms of priming, Kuzyakov et al. (2000) defines rhizosphere priming as a short-term change in the intensity of soil organic matter (SOM) decomposi-tion. These authors use a broad definition of soil organic matter (SOM) that includes microbial biomass, plant and
Communicated by Zoe Cardon.
M. N. Weintraub (&)
Department of Environmental Sciences, University of Toledo, 2801 W. Bancroft Street, Mail Stop 604, Toledo, OH 43606, USA e-mail: [email protected]
L. E. Scott-DentonS. K. SchmidtR. K. Monson Department of Ecology and Evolutionary Biology, University of Colorado, Boulder, CO 80309, USA
R. K. Monson
Cooperative Institute for Research in Environmental Sciences, University of Colorado, Boulder, CO 80309, USA
animal derived organic compounds, and freshly deposited litter (Kuzyakov et al. 2000; Fontaine et al. 2004). An example of soil priming comes from Subke et al. (2004), who combined 13C-labeled litter addition and girdling of Norway spruce trees, and found that the difference in CO2
efflux between their litter-addition and litter-removal plots could not be accounted for entirely by root respiration, and suggested that rhizodeposition had a priming effect, increasing the decomposition component of soil respira-tion. This positive priming effect was responsible for 15– 20% of the total soil CO2 flux in June and July (Subke
et al.2004). In another girdling study in a lodgepole pine forest in the Front Range of the Rocky Mountains in Colorado, USA, Scott-Denton et al. (2006) found that tree roots prime the soil with sugar-rich exudates beneath the spring snowpack. Unlike plant litter, which is largely comprised of polymers too large for microbial uptake, much of the C in exudates can be taken up without extracellular enzymatic decomposition.
While rhizodeposition has been found to stimulate additional decomposition of existing soil C pools, it is still unclear which pools and processes are affected. Kuzyakov (2002) hypothesized that elevated rates of decomposition are the ultimate cause of priming. According to this hypothesis, priming involves an enhancement of microbial C status and demand for other nutrients, which in turn stimulates decomposition. In support of this hypothesis, Subke et al. (2004) concluded that girdling slowed litter decomposition, indicating that rhizodeposition enhanced litter breakdown. Multiple studies, however, have con-cluded that primed C is derived from microbial C pools, not SOM breakdown, suggesting higher rates of microbial turnover and release of endocellular constituents as the principal sources (Dalenberg and Jager 1981, 1989; De Nobili et al.2001). Thus, it is uncertain whether primed C is derived from enhanced decomposition, greater C release from microbial pools, or both.
Tree girdling has been shown to be an effective method of isolating the effects of rhizodeposition on soil processes without disturbing the soil environment (Bhupinderpal-Singh et al.2003; Ho¨gberg et al.2001; Scott-Denton et al. 2006; Subke et al. 2004). Girdling offers two significant advantages to soil trenching, the alternative and more commonly used method of inhibiting rhizodeposition. First, girdling does not result in the instantaneous death of roots, which causes a large root litter input to the soil; and sec-ond, girdling allows roots to maintain their ability to transport water, so that soil moisture is less affected by girdling than trenching (Subke et al.2004). While girdling will ultimately result in root and tree death, roots can remain alive with virtually no growth for a considerable period of time (Subke et al. 2004). Based on our own observations in the subalpine forest ecosystem, it may take
as long as 2–3 years for trees to die following girdling (Scott-Denton et al. 2006).
Our goal was to determine the extent to which microbial exoenzymes associated with SOM breakdown are affected by rhizodeposition. We tested the hypothesis that enzyme activities will be reduced by girdling because the priming effect of rhizodeposition is channeled through the pro-duction of exoenzymes that depolymerize SOM substrates. To manipulate root C exudation, we girdled lodgepole pine trees in the Front Range of the Rocky Mountains, CO, USA, in the same forest as Scott-Denton et al. (2006). In order to determine the extent to which girdling affected soil C availability and microbial biomass, we measured soil dissolved organic C (DOC) and microbial biomass in both girdled and control plots. In order to determine the effect of rhizodeposition on soil nitrogen (N) status, we measured dissolved organic and inorganic N (DON and DIN). Finally, to determine the effects of rhizodeposition on SOM depolymerization, we measured the activities of nine different exoenzymes in the girdled and control plots, focusing on those involved in lignin and cellulose break-down, and in the acquisition of N and P.
Materials and methods
Study site
The research was conducted at the Niwot Ridge AmeriFlux site, in the Front Range of the Rocky Mountains. The study site is approximately 25 km west of Boulder, Colorado (40°10
58@N; 105°320
47@W), at 3,050 m above sea level. The surrounding coniferous forest is dominated by Abies
lasiocarpa (subalpine fir),Picea engelmannii(Engelmann
spruce), andPinus contorta(lodgepole pine). The forest is currently aggrading, having been logged*102 years ago. We conducted our experiment in a relatively pure stand of
P. contorta to eliminate differential species effects. With
an average gap fraction of 17%, the forest canopy (average height = 11.4 m) is relatively open (Monson et al. 2002). The site has little ground cover (<25%), mostly consisting of a low-growing shrub,Vacciniumsp. The soils are sandy inceptisols derived from granitic moraine with a thin organic horizon ranging from *2 to 6 cm. Past descrip-tions of the site can be found in Monson et al. (2006,2002) and Scott-Denton et al. (2006,2003).
Environmental measurements
Colorado Mountain Research Station. The meteorological data presented here are daily means from a Campbell Instruments CR23X data logger recording at 5 s intervals (Campbell Scientific, Logan, UT, USA). The soil temper-ature data was collected at a depth of 5 cm. Soil moisture was determined gravimetrically after collecting 5 g of wet soil from the upper 5 cm and drying for a minimum of 48 h at 60°C before reweighing the sample; it is calculated as (g wet–g dry)/g dry. Additional details of soil temperature and meteorological measurements can be found at: http://culter.colorado.edu/exec/.extracttoolA?c-1cr23x.ml.
Tree girdling
Our plots were set up in the manner of those in the girdling study conducted by Scott-Denton et al. (2006), and the girdling in July 2004 was timed to allow for the attenuation of transient treatment effects by the spring of 2005; our focal point was the springtime period of rhizodeposition. Plots were chosen in stands that contained 2–3 trees at least 10–15 cm in diameter at breast height, and in spots where the ground cover was sparse, so that the soil was dominated by root systems of the selected trees. The experimental plots were roughly circular in shape, being approximately 5–7 m in diameter, and were all within 200 m of each other on a shallow (5–6°) east-facing slope. Control plots were set up within 10 m of each of the girdled plots, and were similar in all other regards to the girdled plots. Over multiple days in the last week of July 2004, the trees were girdled using a saw to make two parallel incisions approximately 15 cm apart around the circumference of the tree at breast height, and the sharp edge of a hatchet to scrape away the bark and cambial layers between the incisions; there was no apparent regrowth of cambial tis-sue. We also trenched around the perimeter of the girdled plots to a depth of 15–20 cm to eliminate the intrusion of roots from trees surrounding the plots. There was no trenching around the control plots. In all, six girdled and six control plots were established.
Soil sampling
Samples from the organic horizon were collected from random locations within the plots using a 6-cm soil corer. When the organic horizon at the randomly selected location was 5 cm, then one 5 cm core was collected; if it was <5 cm, then two cores were collected to the bottom of the organic horizon (the organic horizon separates easily from the mineral soil) and composited. When the organic hori-zon was <2 cm, a different location was chosen. The entire depth of the organic horizon was kept from each core, and
care was taken to avoid mineral soil. We focused on the organic layer because most fine roots are found within the upper 10–15 cm at this site (unpublished observations), thus we would expect rhizodeposition to be greatest in the surface soils (Scott-Denton et al. 2006). Within 24 h of collection the soils were homogenized by hand; we removed coarse plant litter and other debris, as well as larger (>1 mm) roots, but we were not able to remove all of the fine roots in the samples with relatively high root density (all samples had at least some roots in them). The soils were then immediately extracted for nutrients, fumi-gated for microbial biomass analysis, and frozen (for not longer than six months) for later enzyme analysis. Begin-ning with the week of girdling, we sampled every third month. During the spring, when rhizodeposition has been observed to occur at high rates (Scott-Denton et al.2006), we increased our sampling to once every 1–3 weeks.
Nutrients and microbial biomass
In order to extract the soils for DOC, DON, and DIN, 25 ml of 0.5 M potassium sulfate (K2SO4) was added to 5 g of
each homogenized sample and agitated on an orbital shaker table at 120 rpm for 1 h. The samples were then vacuum-filtered through Pall A/E glass fiber filters and frozen until analysis. At the same time, samples were fumigated with chloroform to measure soil microbial biomass using the method described by Scott-Denton et al. (2006). Briefly, 2 ml of ethanol free chloroform was added directly to 5 g of each sample in a 250-ml Erlenmeyer flask, which was then stoppered and incubated for 24 h, unstoppered and vented for 30 min, and then extracted in 0.5 M K2SO4as described
above. Concentrations of DOC and DON in these fumigated samples were used to quantify soil microbial biomass C and N (MB-C and MB-N) by subtracting the concentrations of DOC and DON in the unfumigated samples, and in soil-free controls that underwent an identical fumigation and extraction process, from the fumigants (Brookes et al.1985; Sparling and West 1988; Vance et al. 1987). We did not apply an extraction efficiency correction factor (e.g.,Kec) to
the calculated values.
Dissolved inorganic N (DIN) in the K2SO4extracts was
analyzed with a Lachat QuikChem Nutrient Analyzer using the standard phenolate chemistry for NHþ
4 and the
cad-mium reduction/sulfanilamide chemistry for NO3 (Lachat
Instruments, Milwaukee, WI, USA). DOC and DON in the K2SO4extracts and the fumigated soil K2SO4extracts were
DON was calculated as TDN–DIN. All concentrations were corrected using measurements from blanks.
Enzyme assays
The enzyme assays were conducted using the procedures outlined by Saiya-Cork et al. (2002). We analyzed our samples for the activities of nine different enzymes involved in the breakdown of plant litter, and nitrogen and phosphorus cycling (Table1). Sample slurries were pre-pared by homogenizing 1 g of soil in 125 ml of 50 mM sodium acetate buffer, pH 5.0 (a typical pH for these soils) using a Virtex 45 tissue homogenizer (Virtex Inc., Yonkers, NY, USA). The slurries were continuously stirred
using a magnetic stir plate while 200-ll aliquots were
pipetted into 96-well microplates. For each assay and sample, 16 replicate wells were created.
All of the enzyme assays except phenol oxidase and peroxidase were fluorimetric (see Table 1for a list of sub-strates). All of the fluorimetric assays were set up in black 96-well microplates. We added 50ll of 200lM substrate
solution (Table1) to each sample well. Blank wells were created with 50ll of buffer and 200ll of sample slurry.
Negative control wells were created with 50ll substrate
solution and 200ll of buffer. Quench standards were
cre-ated with 50ll of standard (10 mM 4-methylumbelliferone,
or 7-amino-4-methylcoumarin in the case of leucine ami-nopeptidase) and 200ll of the sample slurry. Reference
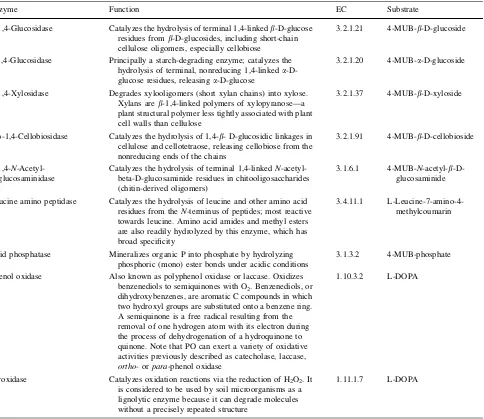
standards were created with 50ll of standard and 200ll of Table 1 The functions of the different enzymes we assayed, the substrates used, and the enzyme commission numbers for each (Bruce Caldwell, Robert Sinsabaugh Pers. Comm.; Saiya-Cork et al.2002)
Enzyme Function EC Substrate
b-1,4-Glucosidase Catalyzes the hydrolysis of terminal 1,4-linkedb-D-glucose
residues fromb-D-glucosides, including short-chain cellulose oligomers, especially cellobiose
3.2.1.21 4-MUB-b-D-glucoside
a-1,4-Glucosidase Principally a starch-degrading enzyme; catalyzes the
hydrolysis of terminal, nonreducing 1,4-linkeda -D-glucose residues, releasinga-D-glucose
3.2.1.20 4-MUB-a-D-glucoside
b-1,4-Xylosidase Degrades xylooligomers (short xylan chains) into xylose.
Xylans areb-1,4-linked polymers of xylopyranose––a plant structural polymer less tightly associated with plant cell walls than cellulose
3.2.1.37 4-MUB-b-D-xyloside
b-D-1,4-Cellobiosidase Catalyzes the hydrolysis of 1,4-b- D-glucosidic linkages in
cellulose and cellotetraose, releasing cellobiose from the nonreducing ends of the chains
3.2.1.91 4-MUB-b-D-cellobioside
b-1,4-N -Acetyl-glucosaminidase
Catalyzes the hydrolysis of terminal 1,4-linkedN -acetyl-beta-D-glucosaminide residues in chitooligosaccharides (chitin-derived oligomers)
3.1.6.1 4-MUB-N-acetyl-b
-D-glucosaminide
Leucine amino peptidase Catalyzes the hydrolysis of leucine and other amino acid
residues from theN-terminus of peptides; most reactive towards leucine. Amino acid amides and methyl esters are also readily hydrolyzed by this enzyme, which has broad specificity
3.4.11.1
L-Leucine-7-amino-4-methylcoumarin
Acid phosphatase Mineralizes organic P into phosphate by hydrolyzing
phosphoric (mono) ester bonds under acidic conditions
3.1.3.2 4-MUB-phosphate
Phenol oxidase Also known as polyphenol oxidase or laccase. Oxidizes
benzenediols to semiquinones with O2. Benzenediols, or
dihydroxybenzenes, are aromatic C compounds in which two hydroxyl groups are substituted onto a benzene ring. A semiquinone is a free radical resulting from the removal of one hydrogen atom with its electron during the process of dehydrogenation of a hydroquinone to quinone. Note that PO can exert a variety of oxidative activities previously described as catecholase, laccase,
ortho- orpara-phenol oxidase
1.10.3.2 L-DOPA
Peroxidase Catalyzes oxidation reactions via the reduction of H2O2. It
is considered to be used by soil microorganisms as a lignolytic enzyme because it can degrade molecules without a precisely repeated structure
1.11.1.7 L-DOPA
buffer. Eight replicate wells were set up for each blank, negative control, and quench standard. The assay plates were incubated in the dark at 13°C for up to 24 h. At the end of the incubation, 10ll aliquots of 1.0M NaOH were added
to each well to raise the pH, as 4-methylumbelliferone and 7-amino-4-methylcoumarin fluoresce more strongly at higher pH. Fluorescence was measured using a Fluoroskan II mi-croplate fluorometer (Thermo Labsystems, Franklin, MA, USA) with 365 nm excitation and 460 nm emission filters. After correcting for quenching and for the negative controls, enzyme activities were expressed as nmol reaction product h1g dry soil1(nmol h1g1).
The phenol oxidase and peroxidase assays were colori-metric, using L-3,4-dihydroxyphenylalanine (L-DOPA) as the substrate. All of the colorimetric assays were set up in clear 96-well microplates. For phenol oxidase, 50ll of
25 mM L-DOPA was added to each sample well, contain-ing 200ll of sample slurry. The peroxidase assays received
50ll of 25 mM L-DOPA, plus 10ll of 0.3% H2O2. For the
phenol oxidase assays, the negative control wells received 200ll of buffer and 50ll of the L-DOPA solution. The
blank wells received 200ll of sample slurry and 50ll of
acetate buffer. For the peroxidase assays, the negative control and blank wells also received 10ll of 0.3% H2O2.
Sixteen replicate sample wells were created for each assay and eight replicate wells were set up for the blanks and controls. The microplates were incubated in the dark at 13°C for up to 24 h. Enzyme activity was quantified by measuring absorbance at 460 nm using a Molecular Devi-ces Spectramax 340pc microplate spectrophotometer (Molecular Devices, Inc., Sunnyvale, CA, USA) and expressed as nmol h1g1. Phenol oxidase activity was subtracted from peroxidase activity to calculate the net peroxidase activities reported here.
Statistics
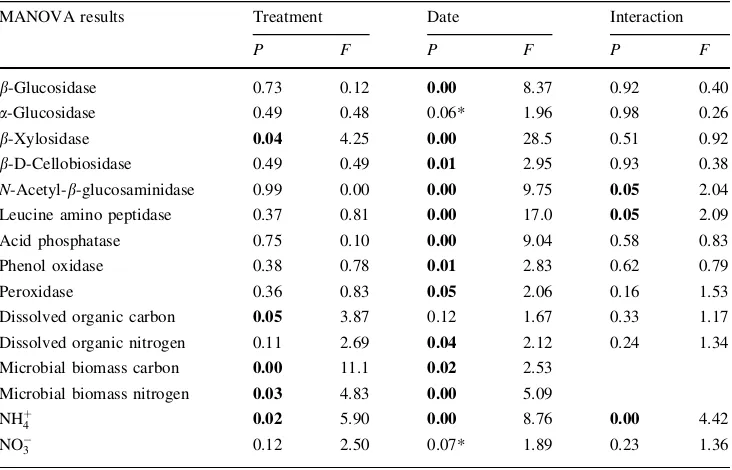
Data were analyzed using two-way multivariate analysis of variance (MANOVA) with treatment and date as factors (N= 6 for each treatment, N= 9 dates). Data were also analyzed using one-way MANOVAs for each individual date with treatment as the factor. For MB-C and MB-N there were not enough data for the two-way MANOVAs (there are no MB-C or MB-N data for 30 July 2004). In those cases, separate one-way MANOVAs were performed with each date and treatment as factors. In order to account for the possibility of finding significant results simply by chance, which is a concern with such a large number of statistical comparisons, the Bonferroni correction was used with all of the MANOVA tests, and all of the P values reported here are Bonferroni-corrected. For all analyses, differences were considered significant at P 0.05.
Systat version 11 (Systat Software Inc., Richmond, CA, USA) was employed for all of the statistical analyses, which were conducted on untransformed data.
Results
Climate
Average daily soil temperatures ranged from 1 to 20°C over the course of the study, while average daily air tem-peratures ranged from 21 to 19°C (Fig.1). Soil tem-peratures were at or below 0°C from 25 November 2004 through 15 May 2005, and were typically high enough for there to be unfrozen soil water (Patterson and Smith1981), and therefore biological activity, throughout the winter (Fig.1). There was a measurable snowpack beginning in late September, which had largely disappeared by the beginning of June. While variable, the snowpack was generally deepest in the spring of 2005. Precipitation was highly variable, but was generally greatest in the late fall of
m
Mean Air and Soil Temperatures
-20
eb-0501-Mar-0501-Apr-05
01-M
Precipitation and Soil Moisture
Fig. 1 Soil temperatures from a depth of 5 cm, air temperatures, snow depth, and precipitation from the C1 metereological station at the Niwot Ridge LTER (available athttp://culter.colorado.edu/NWT/), approximately 500 m from our girdled plots, and soil moisture (g H2O g dry soil1) from the means of our girdled and control plots.
2004 and in late April to early May 2005, and lowest in July 2005.
Soil moisture was relatively low at 1.3 g H2O g1dry
soil in our 2004 samples, and it then increased slowly through the spring, reaching a maximum of 3.0 g H2O
g1dry soil on 26 April 2005. Soil moisture peaked in late April after above-freezing temperatures throughout the third week in April caused snowmelt water to percolate down into the soil. Soil moisture then decreased steadily for the remainder of the experiment, reaching a low of 0.3 g H2O g
1
dry soil on 20 July 2005.
Nutrients and microbial biomass
We observed higher dissolved organic carbon (DOC) in the control plots, overall (P = 0.05; Table2). The seasonal time-course (Fig.2) suggests that this was caused by dif-ferences between girdled and nongirdled plots during the spring, when DOC was elevated in the control plots but not the girdled plots. In May, DOC concentrations decreased, especially in the control plots, and by June concentrations in the girdled and nongirdled plots had converged. In June and July, DOC increased again in both treatments.
The effect of girdling on soil microbial biomass (MB-C) was similar to DOC (Fig.2), and the decrease in MB-C was statistically significant (P 0.01). This treatment effect was driven by decreased MB-C in the girdled plots in the spring of 2005, with significantly lower MB-C in the girdled plots on 21 April 2005 (P 0.01; Fig.2, Table 3).
The pattern for dissolved organic nitrogen (DON) was similar to that of DOC, although the overall difference between the girdled and nongirdled plots not statistically
significant (P = 0.11; Table2). However, there was a strong trend toward higher DON concentrations in the control soils in the spring of 2005 (Fig.2). As a result of high variability over time in both treatments, date had a significant effect on DON concentrations (P = 0.04; Table2).
The pattern for microbial biomass N (MB-N) was fairly similar to that of MB-C, as MB-N was higher in the control plots at the same time as MB-C. Across all dates, MB-N was significantly higher in the control plots (P = 0.03; Table2). The seasonal time-courses suggest that the dif-ferences in MB-N we observed between treatments are similar to those for MB-C, but that MB-N varies more than MB-C (Fig.2).
Girdling resulted in a significant overall difference in NHþ
4, compared to the control plots (P= 0.02; Table2). In
May 2005, NHþ
4 was significantly higher in the control
plots (P= 0.01; Table3) after increasing in late April (Fig.3). NHþ
4 began to accumulate in the girdled plots in
June 2005, however, and was significantly higher in this treatment from 22 June onward (P= 0.05; Table3). As a result of this variability, the effect of date on NHþ
4
con-centrations was significant (P 0.01).
NO3 was typically low in both girdled and control plots,
and girdling did not significantly affect NO
3
concentra-tions (P= 0.12; Table2). The effect of date on NO 3
concentrations was not significant (P= 0.07; Table2).
Exoenzyme activity
The girdling treatment did not have a significant overall effect on the activities of any of the enzymes involved in
Table 2 Bonferroni-corrected multivariate analysis of variance results for all of the parameters we measured, with date and girdling treatment as factors
Results significant at the
P 0.05 level are shown in
bold. Results between
P 0.05 andP 0.10 are
marked with an asterisk (*)
MANOVA results Treatment Date Interaction
P F P F P F
b-Glucosidase 0.73 0.12 0.00 8.37 0.92 0.40
a-Glucosidase 0.49 0.48 0.06* 1.96 0.98 0.26
b-Xylosidase 0.04 4.25 0.00 28.5 0.51 0.92
b-D-Cellobiosidase 0.49 0.49 0.01 2.95 0.93 0.38
N-Acetyl-b-glucosaminidase 0.99 0.00 0.00 9.75 0.05 2.04
Leucine amino peptidase 0.37 0.81 0.00 17.0 0.05 2.09
Acid phosphatase 0.75 0.10 0.00 9.04 0.58 0.83
Phenol oxidase 0.38 0.78 0.01 2.83 0.62 0.79
Peroxidase 0.36 0.83 0.05 2.06 0.16 1.53
Dissolved organic carbon 0.05 3.87 0.12 1.67 0.33 1.17
Dissolved organic nitrogen 0.11 2.69 0.04 2.12 0.24 1.34
Microbial biomass carbon 0.00 11.1 0.02 2.53
Microbial biomass nitrogen 0.03 4.83 0.00 5.09
NHþ
4 0.02 5.90 0.00 8.76 0.00 4.42
NO
the breakdown of relatively easy-to-degrade C polymers (Fig.4), except b-xylosidase (P = 0.04; Table2). Their patterns of activity varied over time, but were similar forb -glucosidase (BG),a-glucosidase (AG),b-D-cellobiosidase (BC), andb-xylosidase (BX), and were much higher in the summer of 2004 than the summer of 2005 (Fig.4). BG was the most active of these enzymes, with catalytic activities
peaking at over 1,300 nmol h1
g1
in October 2004. Its activity had decreased to less than 150 nmol h1g1by July 2005, however. The activities of AG, BC, and BX were lower than those for BG, but they had similar seasonal dynamics; date was a significant factor affecting the activities of b-glucosidase,b-xylosidase, andb -D-cellobi-osidase (Table 2).
Table 3 Bonferroni-corrected multivariate analysis of variance results for all of parameters we measured by date, with girdling treatment as the factor
MANOVA results 30-7-2004 27-10-2004 11-1-2005 21-4-2005 26-4-2005 16-5-2005 1-6-2005 22-6-2005 20-7-2005
Treatment effect by date P F P F P F P F P F P F P F P F P F
b-Glucosidase 0.94 0.01 0.21 1.82 0.77 0.09 0.94 0.01 0.58 0.32 0.82 0.06 0.81 0.06 0.41 0.75 0.79 0.07
a-Glucosidase 0.41 0.75 0.68 0.19 0.60 0.30 0.68 0.18 0.77 0.09 0.77 0.09 0.57 0.34 0.82 0.05 0.620 0.27
b-Xylosidase 0.43 0.66 0.06* 4.58 0.48 0.54 0.92 0.01 0.41 0.73 0.86 0.03 0.85 0.04 0.34 1.01 0.92 0.01
b-D-Cellobiosidase 0.75 0.10 0.16 2.34 0.63 0.25 0.87 0.03 0.79 0.07 0.90 0.02 0.90 0.02 0.24 1.57 0.50 0.50
N-Acetyl-b -glucosaminidase
0.20 1.87 0.04 5.50 0.41 0.73 0.36 0.92 0.26 1.34 0.56 0.36 0.75 0.11 0.47 0.55 0.17 2.18
Leucine amino peptidase
0.10 3.25 0.54 0.41 0.88 0.02 0.17 2.20 0.01 11.2 0.06* 4.30 0.09* 3.55 0.49 0.51 0.46 0.59
Acid phosphatase 0.20 1.91 0.76 0.10 0.92 0.01 0.51 0.46 0.18 2.12 0.50 0.50 0.87 0.03 0.42 0.70 0.30 1.20
Phenol oxidase 0.04 5.62 0.35 0.98 0.61 0.28 0.54 0.41 0.94 0.00 0.98 0.00 0.02 7.14 0.93 0.01 0.53 0.41
Peroxidase 0.62 0.27 0.64 0.24 0.07* 4.24 0.58 0.33 0.88 0.02 0.22 1.75 0.43 0.68 0.71 0.15 0.24 1.57
Dissolved organic carbon
0.96 0.00 0.46 0.60 0.31 1.17 0.22 1.68 0.14 2.62 0.14 2.58 0.54 0.40 0.94 0.01 0.98 0.00
Dissolved organic nitrogen
0.38 0.86 0.36 0.94 0.60 0.30 0.29 1.26 0.08* 3.71 0.06* 4.77 0.18 2.12 0.97 0.00 0.8 0.07
Microbial biomass carbon
No data 0.87 0.03 0.72 0.14 0.01 12.5 0.15 2.38 0.27 1.39 0.23 1.63 0.38 0.86 0.32 1.22
Microbial biomass nitrogen
No data 0.73 0.12 0.71 0.15 0.06* 4.70 0.24 1.56 0.39 0.83 0.52 0.45 0.54 0.41 1.00 0.00
NHþ
4 0.18 2.14 0.41 0.75 0.84 0.04 0.16 2.35 0.22 1.71 0.01 9.36 0.47 0.57 0.03 6.30 0.05 5.02
NO
3 0.27 1.38 0.75 0.10 0.68 0.18 0.22 1.71 0.11 3.02 0.65 0.22 0.14 2.61 0.30 1.18 0.73 0.12
Results significant at theP 0.05 level are shown inbold. Results betweenP 0.05 andP 0.10 are marked with an asterisk (*)
Microbial Biomass Carbon
Control *p=0.08p=0.06 *
Fig. 2 Timecourses of soil DOC, DON, MB-C and MB-N in the girdled and control plots. Values are expressed aslg-C g
dry soil1andlg-N g
dry soil1, respectively. Error bars represent the standard error of the mean;asterisksrepresent a significant difference;
P 0.05 unless marked
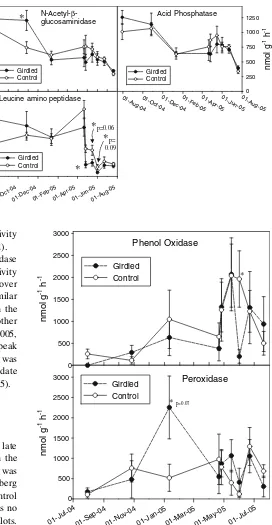
Girdling did not have a significant effect onN-acetyl-b -glucosaminidase (NAG) overall (P= 0.99; Table2), although NAG activity was significantly higher in the girdled plots on 27 October 2004 (P= 0.04; Table3). NAG was one of the most active enzymes we measured,
with activities averaging nearly 500 nmol h1g1(Fig.5). Similar to the other enzymes, NAG activity was highest in the summer and fall of 2004, and lowest in July 2005.
Leucine amino peptidase (LAP) was not significantly affected by girdling overall (P= 0.37; Table2). However, LAP activity was significantly lower in the girdled plots on April 26 (P 0.01; Table 3). LAP had the lowest activity of any of the enzymes in our study, with a mean activity of less than 20 nmol h1g1 (Fig.5). In contrast with the other enzymes, LAP activity did not decline substantially after October, and unlike the other enzymes, its activity decreased sharply in both control and girdled plots in late April. Like the other enzymes, though, its activity was much lower in the summer of 2005 than in the summer of 2004. LAP was the only enzyme for which activity exhibited a significant interaction between date and treat-ment (P= 0.05; Table 2).
There was no significant effect of girdling on acid phosphatase (AP) activity (P = 0.75; Table2). This was one of the most active enzymes in our study, with activities averaging nearly 800 nmol h1g1(Fig.5). The dynamics of AP activity over time were similar to those for of BG and BX, except that AP activity increased on 16 May 2005, while activity for the others decreased. As with most of the other enzymes, AP was highest in the summer and fall of 2004, and lowest in the summer of 2005. As a result, date had a significant effect on AP activity (P 0.01).
Phenol oxidase (PO) activity was not significantly affected by girdling overall (P= 0.38; Table2). However, its activity was significantly lower in the girdled plots on 30 July 2004, despite being relatively low in both girdled and nongirdled plots at this time (P= 0.04; Table3). PO activity was also significantly reduced by girdling on 1 June 2005 (P= 0.02; Table3). PO had a different pattern of activity than any of the other enzymes, and was lowest in the summer and fall of 2004, and highest in the spring of NH4+
Fig. 3 Timecourses of soil NH4+and NO3in the girdled and control
plots. Values are expressed aslg-N g dry soil1. Error bars represent
the standard error of the mean; asterisks represent a significant difference;P 0.05
α-Glucosidase
Aug-0401-Oct-0401-Dec-04
01
Fig. 4 Timecourses ofb -glucosidase,a-glucosidase,
b-xylosidase, andb -D-cellobiosidase in the girdled and control plots. Values are expressed as nmol reaction product catalyzed
h1g dry soil1. Error bars represent the standard error of the mean;asterisksrepresent a significant difference;
P 0.05 unless marked
2005 (Fig.6). As a result of this variability, PO activity was significantly affected by date (P 0.01; Table2).
Girdling did not have a significant effect on peroxidase (PX) activity, overall (P= 0.36; Table2). PX activity peaked in the girdled plots on 11 January 2005 at over 2000 nmol h1g1. Its pattern of activity was most similar to that of PO in that both had low rates of activity in the summer and fall of 2004, when the activities of the other enzymes were high, and higher rates in the spring of 2005, when the activities of the other enzymes were low. The peak in PX activity in the girdled plots on 11 January 2005 was unique, however. As a result of its variability over time, date had a significant overall effect on PX activity (P= 0.05).
Discussion
We observed elevated soil DOC in the control plots in late April 2005 (Fig.2). There was no similar elevation in the girdled plots, suggesting that this increase in DOC was caused by the presence of an active root system (Ho¨gberg and Hogberg2002). Spring increases in DOC in the control plots attenuated rapidly, and by early summer there was no longer any difference between the control and girdled plots. Another result that suggests girdling was effective in sup-pressing root activity is the accumulation of NHþ
4 we
observed in the girdled plots in June 2005, which may reflect reduced tree N uptake.
The patterns of DOC we observed are in accord with those from a previous girdling study in the same forest. In their control plots, Scott-Denton et al. (2006) observed a late winter pulse in soil sucrose, which they attributed to root leakage associated with mechanical damage to roots as a result of winter soil heaving, and late April increases in soil DOC that they attributed to active root exudation. This
conclusion is supported by eddy covariance data from the same forest, which indicates that photosynthesis began in this forest in mid-April in both 2002 and 2003, prior to their sampling (Scott-Denton et al.2006). They also found that girdling caused little difference in soil sugars at other
Leucine amino peptidase Fig. 5 Timecourses of
N-acetyl-b-glucosaminidase, leucine amino peptidase, and acid phosphatase in the girdled and control plots. Values are expressed as nmol reaction product catalyzed
h1g dry soil1. Error bars
represent the standard error of the mean;asterisksrepresent a significant difference;
P 0.05 unless marked
otherwise
Fig. 6 Timecourses of phenol oxidase and peroxidase in the girdled and control plots. Values are expressed as nmol reaction product catalyzed h1g dry soil1. Error bars represent the standard error of
times. While we do not have sufficient data to determine if a similar release of root sugars also occurred in the late winter of 2004, the timing of our late-April samples in 2005 was similar to that of Scott-Denton et al. (2006) in 2002 and 2003, and also began after the start of tree pho-tosynthesis, which was on April 19 in 2005 (data not shown). This suggests that the difference in DOC between our girdled and control plots in late April was also attrib-utable to root exudation.
Because some fine roots were present in the soil samples, it is possible that leakage from severed roots was at least partly responsible for the difference in DOC between the girdled and control plots in the spring. However, if leakage from severed roots was a significant contributor to the DOC pool, it likely would have caused a more consistent eleva-tion in control DOC concentraeleva-tions than we observed. The fact that DOC concentrations in both treatments were sim-ilar in the winter, early spring, and again in July, at the height of the growing season, when Scott-Denton et al. (2006) found root respiration to be highest, suggests that the contribution from severed roots to the DOC concentrations we observed in the control plots was minimal. Because late April is when root exudation has previously been observed to be highest in this forest (Scott-Denton et al.2006), the temporal pattern in DOC that we observed suggests that girdling caused differences in root C inputs to the soil.
As with DOC, we observed springtime increases in microbial biomass in only the control plots. This indicates that there are dynamic populations of soil microorganisms whose growth beneath the spring snow-pack is associated with active roots. In a girdling study of Scots pine, Ho¨gberg and Hogberg (2002) also found that girdling caused a significant reduction in microbial biomass, and concluded that the group of microorganisms most respon-sible for this reduction was ectomycorrhizal fungi. Since the lodgepole pines in our experimental plots are also ec-tomycorrhizal (unpublished observations), it is likely that a significant proportion of the microbial biomass lost in response to girdling was also from ectomycorrhizal fungi. We observed substantial declines in microbial biomass in the control plots in late April 2005 coincident with sharp decreases in DOC, just after the peak in rhizodeposition. That this decrease did not occur in the girdled plots sug-gests microbial turnover was higher in the control plots in late April, which would result in higher rates of C miner-alization in the control plots at this time. This suggests that a significant proportion of the priming effect in this soil is associated with rhizodeposition that initially stimulates microbial growth, and then is released as microbial bio-mass turns over during snowmelt.
Despite the fact that girdling resulted in a significant reduction in DOC and microbial biomass, there was little effect on exoenzyme activity. The only enzyme to show a
significant overall response was BX, which was stimulated by girdling after the initial three months, but was unaf-fected by the following spring, when girdling had the largest impact on DOC and microbial biomass. We hypothesized that tree girdling would cause a decrease in soil enzyme activities because rhizodeposition has a posi-tive priming effect on soil organic matter decomposition. This hypothesis was not supported by our observations. If anything, girdling caused an increase in soil enzyme activities, especially during the initial three months after initiation of the treatment.
An initial increase in enzyme activities is what we would expect to happen if tree girdling enhanced turnover of roots and their associated ectomycorrhizal fungi. The elevated NAG activity that we observed in the girdled plots is consistent with the hypothesis that tree girdling caused an initial increase in mycorrhizal fungal turnover (Ho¨gberg and Hogberg 2002). The observed increases in BX three months after girdling, and in PX activity another three months later, are also consistent with the hypothesis that root turnover in the girdled plots initially stimulated decomposition and exoenzyme activity. Existing models of litter decomposition indicate that we would expect a delay in the decomposition of lignin from dead roots relative to cellulose and other labile litter constituents (Sinsabaugh et al. 2002). Our data suggest that shortly following gir-dling, the breakdown of accessible polysaccharides such as chitin and xylan (a plant structural polymer less tightly associated with cell walls than cellulose, acted upon by BX) was stimulated. During mid-winter, approximately five months after girdling, the enhancement of enzyme activities in the girdled plots was minimal, suggesting that the the decomposition pulse related to turnover labile substrates had attenuated; however, there was a significant increase in PX activity, which is associated with degrada-tion of the less labile substrate, lignin.
We hypothesized that enzyme activity would be reduced in the girdled plots, particularly during the spring, when rhizodeposition is greatest. However, we observed no spring reductions in exoenzyme activities except LAP. Girdling significantly reduced LAP activity in late April and the trend continued to early June 2005 (Table3). The reduction in the girdled plots persisted despite a drop in activity affecting both types of plots in late April (Fig.5). That the difference in LAP between the girdled and control plots grew when microbial biomass in the controls decreased suggests that LAP may contribute to the min-eralization of microbial N.
lignin. This supports the hypotheses stated in past studies that enhanced mineralization of soil C pools in the presence of rhizodeposition is due not to enhanced breakdown of litter or complex SOM, but rather to the mineralization of microbial endocellular reserves (De Nobili et al.2001), the turnover of microbial biomass (Dalenberg and Jager1981; Dalenberg and Jager 1989; Wu et al. 1993), and greater microbial demand for N and other elements that are required to balance the elevated C availability from rhi-zodeposition (Kuzyakov2002). Thus, rhizosphere micro-organisms are able to respond positively to the presence of rhizodeposited C (Cheng et al. 1996), but this response requires them to allocate resources toward peptide degra-dation in order to enhance N availability. This conclusion is consistent with the hypothesis stated in Kuzyakov (2002) that greater microbial N acquisition is one of the principal causes of positive rhizosphere priming effects.
The reduction in DON in the girdled plots that we observed in the spring suggests that the activity of micro-organisms growing on rhizodeposited C contributes to increases in N availability. Previous studies have also found that root exudation is associated with increased N availability in the rhizosphere (e.g., Hamilton and Frank 2001; reviewed in Bardgett 2005; Paterson 2003). This is caused by a stimulation of microbial N immobilization in response to elevated C availability, followed by microbial N mineralization due to C starvation as a result of reduc-tions in root C inputs, and/or protozoans grazing rhizo-sphere microorganisms and excreting microbial N as NHþ 4
(Bonkowski2004; Clarholm 1985). However, we did not analyze the composition of rhizodeposits and thus we cannot rule out the possibility that the difference in DON between treatments was the result of direct root N inputs to the soil. We note, however, that rhizodeposits are known to have high C/N ratios relative to microbial biomass and have previously been shown to cause N limitation as a result (Kuzyakov2002). This causes us to doubt that the difference in DON between treatments was the result of direct root N inputs to the soil.
While the significant April increases in microbial bio-mass associated with rhizodeposition generally did not significantly alter enzyme activity, we found that the sea-sonal changes in climate exerted strong effects. Most enzymes had relatively high activities in the summer and fall of 2004, the summer of girdling, in large part due to a relatively wet season. The activities of most enzymes decreased with the onset of winter, but were still detectable in the soil despite the low temperatures; enzyme activities increased again in the spring, and then decreased steadily in the summer after girdling (Figs.4,5,6) as the soils dried (Fig.1) in response to drought. As a result, sampling date was a significant factor affecting the activities of all of the enzymes we measured except AG.
Conclusions
The results of this study indicate that the soil microbial biomass in a subalpine coniferous forest benefits from root C inputs in the spring, when the soils are still covered with snow. Our results suggest that the microorganisms growing on rhizodeposited C contribute to increases in N avail-ability by increasing protein breakdown. While enhanced protein degradation is likely to have a small priming effect on soil C mineralization, our data suggest that rhizodepo-sition does not stimulate the decomporhizodepo-sition of cellulose and lignin. Because the microbial community growing underneath the late snowpack includes populations that depend on rhizodeposition rather than the breakdown of organic polymers, the microbial biomass can grow beyond the constraints allowed by exoenzyme-mediated C acqui-sition. Thus, in the fall and winter microbial dynamics are controlled by rates of C acquisition from decomposition, but they are controlled by both decomposition and rhizo-deposition in the spring. Our results support the hypothesis that the priming effect of rhizodeposition is due to influ-ences on microbial biomass, turnover, and demand for other nutrients required to balance the higher availability of C, rather than the direct stimulation of exoenzymes required for depolymerization of soil organic matter.
Acknowledgments Thanks to the Niwot Ridge LTER program for providing measurement support for the inorganic N analyses. We thank Dr. Bill Bowman (University of Colorado Mountain Research Station) for providing valued logistical support in establishing the girdled and nongirdled plots. This work was financially supported by a grant from the South-Central Section of the National Institute for Global Environmental Change (NIGEC) through the US Department of Energy (BER Program) (Cooperative Agreement No. DE-FC03-90ER61010), and grants from the US National Science Foundation’s Ecological and Evolutionary Physiology (IBN-0212267) and Micro-bial Observatories (MCB-0455606) programs. We thank Laura Brotherton, Sean Burns, Peter Casey, Eric Reinsvold, and Lisa Tie-mann for assistance in the field and lab. We would also like to thank Robert Sinsabaugh, Christian Lauber, and Marcy Gallo for assistance with the enzyme assays, and Jason Neff and Jon Carrasco for assis-tance with the DOC and DON analyses. We are also grateful for Bruce Caldwell’s help in reviewing this manuscript and providing valuable input on table1. Climate data were provided by the Niwot Ridge Long-Term Ecological Research project (NSF DEB 0423662) and the Mountain Research Station (BIR 9115097).
References
Bardgett RD (2005) The biology of soil: a community and ecosystem approach. Oxford University Press, New York, pp 120–121 Bertin C, Yang X, Weston LA (2003) The role of root exudates and
allelochemicals in the rhizosphere. Plant Soil 256:67–83 Bhupinderpal-Singh, Nordgren A, Lofvenius MO, Ho¨gberg MN,
Bonkowski M (2004) Protozoa and plant growth: the microbial loop in soil revisited. New Phytol 162:617–631
Brookes PC, Landman A, Pruden G, Jenkinson DS (1985) Chloro-form fumigation and the release of soil nitrogen: a rapid direct extraction method to measure microbial biomass nitrogen in soil. Soil Biol Biochem 17:837–842
Cheng W, Zhang Q, Coleman DC, Carroll CR, Hoffman CA (1996) Is available carbon limiting microbial respiration in the rhizo-sphere? Soil Biol Biochem 28:1283–1288
Clarholm M (1985) Interactions of bacteria, protozoa and plants leading to mineralization of soil nitrogen. Soil Biol Biochem 17:181–188
Dalenberg JW, Jager G (1981) Priming effect of small glucose additions to C-14-labeled soil. Soil Biol Biochem 13:219–223 Dalenberg JW, Jager G (1989) Priming effect of some organic
additions to C-14-labeled soil. Soil Biol Biochem 21:443–448 De Nobili M, Contin M, Mondini C, Brookes PC (2001) Soil
microbial biomass is triggered into activity by trace amounts of substrate. Soil Biol Biochem 33:1163
Fontaine S, Bardoux G, Benest D, Verdier B, Mariotti A, Abbadie L (2004) Mechanisms of the priming effect in a savannah soil amended with cellulose. Soil Sci Soc Am J 68:125–131 Hamilton EW, Frank DA (2001) Can plants stimulate soil microbes
and their own nutrient supply? Evidence from a grazing tolerant grass. Ecology 82:2397–2402
Ho¨gberg P, Ekblad A (1996) Substrate-induced respiration measured in situ in a C3-plant ecosystem using additions of C4-sucrose. Soil Biol Biochem 28:1131
Ho¨gberg MN, Ho¨gberg P (2002) Extramatrical ectomycorrhizal mycelium contributes one-third of microbial biomass and produces, together with associated roots, half the dissolved organic carbon in a forest soil. New Phytol 154:791–795 Ho¨gberg P, Nordgren A, Buchmann N, Taylor AFS, Ekblad A,
Ho¨gberg MN, Nyberg G, Ottosson-Lofvenius M, Read DJ (2001) Large-scale forest girdling shows that current photosyn-thesis drives soil respiration. Nature 411:789–792
Hutsch BW, Augustin J, Merbach W (2002) Plant rhizodeposition: an important source for carbon turnover in soils. J Plant Nutr Soil Sci 165:397–407
Kuzyakov Y (2002) Review: factors affecting rhizosphere priming effects. J Plant Nutr Soil Sc 165:382–396
Kuzyakov Y, Friedel JK, Stahr K (2000) Review of mechanisms and quantification of priming effects. Soil Biol Biochem 32:1485– 1498
Mary B, Fresneau C, Morel JL, Mariotti A (1993) C and N cycling during decomposition of root mucilage, roots and glucose in soil. Soil Biol Biochem 25:1005
Monson RK, Lipson DL, Burns SP, Turnipseed AA, Delany AC, Williams MW, Schmidt SK (2006) Winter forest soil respiration controlled by climate and microbial community composition. Nature 439:711
Monson RK, Turnipseed AA, Sparks JP, Harley PC, Scott-Denton LE, Sparks K, Huxman TE (2002) Carbon sequestration in a high-elevation, subalpine forest. Global Change Biol 8:459–478 Paterson E (2003) Importance of rhizodeposition in the coupling of
plant and microbial productivity. Eur J Soil Sci 54:741–750 Patterson DE, Smith MW (1981) The measurement of unfrozen
water-content by time domain reflectometry: results from laboratory tests. Can Geotech J 18:131–144
Saiya-Cork KR, Sinsabaugh RL, Zak DR (2002) The effects of long-term nitrogen deposition on extracellular enzyme activity in an
Acer saccharumforest soil. Soil Biol Biochem 34:1309–1315 Scott-Denton LE, Rosenstiel TN, Monson RK (2006) Differential
controls by climate and substrate over the heterotrophic and rhizospheric components of soil respiration. Global Change Biol 12:205–216
Scott-Denton LE, Sparks KL, Monson RK (2003) Spatial and temporal controls of soil respiration rate in a high-elevation, subalpine forest. Soil Biol Biochem 35:525–534
Sinsabaugh RL, Carreiro MM, Alvarez S (2002) Enzyme and microbial dynamics of litter decomposition. In: Burns RG, Dick RP (eds) Enzymes in the environment: activity, ecology, and applications. Marcel Dekker, New York, pp 249–265
Sparling GP, West AW (1988) A direct extraction method to estimate soil microbial carbon: calibration in situ using microbial respiration and carbon-14 labelled cells. Soil Biol Biochem 20:337–344
Subke JA, Hahn V, Battipaglia G, Linder S, Buchmann N, Cotrufo MF (2004) Feedback interactions between needle litter decom-position and rhizosphere activity. Oecologia 139:551–559 Vance ED, Brookes PC, Jenkinson DS (1987) An extraction method
for measuring soil microbial biomass carbon. Soil Biol Biochem 19:703–708