Influence of fertilizing on the
137
Cs soil–plant transfer in a spruce forest
of Southern Germany
G. Zibold
a
,*
, E. Klemt
a
, I. Konopleva
a
, A. Konoplev
b
aHochschule Ravensburg-Weingarten, University of Applied Sciences, 88250 Weingarten, Germany bScientific Production Association ‘‘TYPHOON’’, Obninsk, Russiaa r t i c l e
i n f o
Article history:Received 6 August 2008 Received in revised form 4 March 2009 Accepted 12 March 2009 Available online 18 April 2009
Keywords: 137Cs root uptake
Fertilization Forest soil Selective sorption
a b s t r a c t
Fertilization with 2.5 t/ha limestone: (83% CaCO3, 8% MgO, 6% K2O, 3% P2O5) reduces the137Cs transfer
from spruce forest soil into plants like fern (Dryopteris carthusiana) and blackberry (Rubus fruticosus) by a factor of 2–5 during at least 11 years as measured by the aggregated transfer factor Tag. In 1997 and
2006 these results were confirmed by additional measurements of the137Cs transfer factor TF, related to the root zone (Ohhorizon), which were explained by the selective sorption of137Cs in the root zone by
measurements of the Radiocaesium Interception Potential (RIP) in fertilized (RIP>179 meq/kg) and non-fertilized soils (RIP<74 meq/kg).
Ó2009 Elsevier Ltd. All rights reserved.
1. Introduction
Forest liming has been used successfully in Europe for more
than 50 years to revitalize forests and reduce acid water runoff. In
Germany since 1984 about 3 million ha have been limed which is
nearly 1/3 of the total forest area (
Bericht u¨ber den Zustand des
Waldes, 2006
). Together with liming, improvement of the soil
nutrient quality by additions of potassium (K
2O) and phosphate
(P
2O
5) fertilisers have been used as a standard practice in
Baden-Wu¨rttemberg (
Forstliche Versuchs- und Forschungsanstalt BW,
2000
). In a radioactive fallout situation e.g. after the Chernobyl
accident 1986, it is of interest to investigate the effects of
fertil-ization on the
137Cs activity concentration in forest plants and to
assess whether fertilization can be a possible countermeasure or
restoration technique (
Fesenko et al., 2005)
. A one-time treatment
of a spruce forest site (Baden-Wu¨rttemberg, Germany) in 1984 with
fertiliser consisting mainly of CaCO
3has been found to reduce
substantially the
137Cs uptake. At this site the highest fraction of the
total caesium inventory was found in the O
hhorizon, rich in organic
matter (
Lindner et al., 1994
). After the treatment the effect of liming
has been measured in the years between 1991 and 1996 (
Drissner
et al., 1996; Zibold et al., 1997, 2003
).
Konopleva et al. (1998)
showed that results of liming are morphological changes of litter
and changes of characteristics of the root soil layer, determining the
biological availability of
137Cs, the parameters of caesium selective
sorption, radiocaesium exchangeability and ion composition of
a soil solution. On the basis of a model of
137Cs transfer from soil to
plants the prediction of
137Cs transfer factors for forest plants has
been made.
In central Finland
Levula et al. (2000)
reported the decrease of
the
137Cs concentrations in lingonberry (
Vaccinium vitis-idaea
L.)
berries in a 100-year-old Scots pine (
Pinus sylvestris
L.) stand due to
ash fertilization and prescribed burning.
Kaunisto et al. (2002)
discussed the effect of fertilization on the potassium and
radio-caesium distribution in tree stands (
P. sylvestris
L.) and peat on
a pine mire; fertilization with potassium-containing fertilisers
decreased the caesium uptake by pine trees considerably. In
western Finland fertilization experiments using potassium fertiliser
on a scots pine stand were reported (
Bre´chignac et al., 2006
). The
137
Cs concentrations in bark, wood and needles of Scots pine, as
well as in many samples of branches of different ages, were found
to be lower in the fertilized plots than in the control plots, both on
mineral soil and on peat-land. On the mineral soil site, the
137Cs
concentration was lower in
Deschampsia flexuosa
and
Vaccinium
myrtillus
on the fertilized plots as compared to the control plots. In
herbs, grasses, dead vegetation,
Dryopteris carthusiana
, and
V.
vitis-idaea
the activity concentrations at fertilized plots were 38–68% of
*Corresponding author. Hochschule Ravensburg-Weingarten, P.O. Box 1261, D-88241 Weingarten, Germany. Tel.:þ49 751 94011; fax:þ49 751 501 9876.
E-mail address:[email protected](G. Zibold).
Contents lists available at
ScienceDirect
Journal of Environmental Radioactivity
j o u r n a l h o m e p a g e : w w w . e l s e v i e r . c o m / l o c a t e / j e n v r a d
those at control plots, although the differences were not
statisti-cally significant (
Bre´chignac et al., 2006
).
In agricultural soils the application of lime and fertilisers may
influence the concentration of major elements (such as K, Ca and Mg)
in the plant root exchange complex and in the soil solution, thus
changing equilibrium parameters affecting the interaction between
the soil matrix and radiocaesium (
Lembrechts, 1993; Konoplev et al.,
1993; Rauret and Firsakova, 1996; Rauret et al., 1996
).
Camps et al.
(2004)
found that ploughing plus reseeding plus applying K-fertiliser
led to a maximal decrease in radiocaesium transfer at most sites. At the
doses applied, lime did not affect the Ca
2þand Mg
2þconcentrations in
the exchange complex and soil solution of the ploughed soils. With
respect to radiocaesium, an increase in the K
þand NH
4
þ
concentrations
in the exchange complex and soil solution was consistent with an
increase in soil–plant transfer.
The objective of this paper was to study the migration and
bioavailability of
137Cs in non-fertilized and fertilized soils of spruce
forest in the pre-alpine region in South-Western Germany in
connection with soil characteristics and soil solution composition.
Results from field measurements spread over 15 years are
summarized and compared with data from soil analysis. Special
attention was devoted to the uptake of
137Cs by the plants fern (
D.
carthusiana
) and blackberry (
Rubus fruticosus
) and its quantitative
assessment.
2. Materials and methods
2.1. Sampling sites, altitude, precipitation, soil type, geology
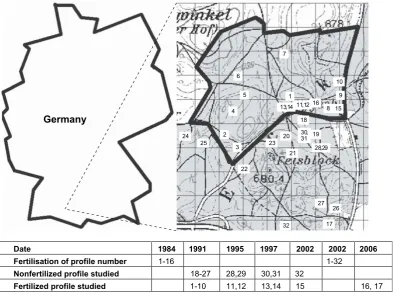
The spruce forest area Altdorfer Wald is located 30 km north of Lake Constance in the south of Germany (sampling site Gauss–Krueger coordinates (PD) 3552; 5290, seeFig. 1andKonopleva et al., 2009,Fig. 2), altitude about 650 m. Mean annual
temperature is about 8C. At Bad Schussenried, close to Altdorfer Wald, the following average values for the years 1980–2005 were recorded: maximum temperature: 17.8C in July, minimum temperature:1.1C in January, maximum precipitation: 116 mm in July, minimum precipitation: 49 mm in February, and a total precipitation of 916 mm on average per year. The annual precipitation varies locally between 700 and 1400 mm. The main type of soil is Luvisol with a tendency to podsolic Luvisol belonging to the soil family mottled loam. The geology of the bedrock is mainly moraine. A schematic map of the area under study and the 32 sampling sites are presented inFig. 1. In 1984 one part of the site was treated with fertiliser consisting mainly of CaCO3(83% CaCO3, 8% MgO, 6% K2O, 3% P2O5) with
a dose of 2.5 t/ha. In summer 2002, after soil and plant sampling at sites 15 and 32, another fertilization was applied to the whole area shown with a dose of 3 t/ha (3% CaO, 2% MgO, 53% CaCO3, 42% MgCO3).
2.1.1. Soil and plant sampling
In the years 1991–2002 soil samples were taken at the sites N. 1–15 and N. 18–32 inFig. 1, and the total material within a frame of 40 cm40 cm was dug and separated during sampling according to the different soil horizons, which were identified in situ by their colour, texture, mean grain size and smell. The thickness of the different horizons was measured and after removal of stones and tree roots, the material of the horizons was air dried for two weeks. After sieving (2 mm), the137Cs inventories of the different horizons were measured by gamma
spectrometry using HPGe detectors. Activity concentrations of plant species growing within the sampling frame were determined after drying at 105C. The sampled species were fern (D. carthusiana) and blackberry (R. fruticosus). The
137
Cs activity concentration was determined by gamma spectrometry using HPGe detectors. Measuring times were chosen in order to achieve a statistical uncer-tainty smaller than 5%.
In 2006 soil material was taken as a monolith at sites N. 16 and 17. A volume of dimension of about 30 cm20 cm area, and depth of about 25 cm was dug and divided according to the different horizons. Plant samples growing on the monolith were harvested and the137Cs activity concentration was determined as described above.
Statistical evaluation of soil and plant data was made using the software STA-TISTICA 7 from StatSoft, Inc. USA. The frequency distributions of soil and plant data could be classified as normal or lognormal according to the Kolmogorov–Smirnov test. Because of simplicity the normal distribution was chosen. For correlation analysis, the Pearson linear correlation coefficientras well as the non-parametric
Date 1984
1991
1995
1997
2002
2002
2006
Fertilisation of profile number
1-16 1-32
Nonfertilized profile studied
18-27 28,29 30,31 32
Fertilized profile studied
1-10 11,12
13,14
15
16,
17
109
8 1
7
6
5
4
2
3
18
19 20
21
22 23 24
25
26 27 28,29 11,12 13,14
30, 31
32
15 16
17
Germany
Spearman Rank correlation coefficientRwere calculated for the statistical signifi-cancep<0.05. If only the correlation coefficient r is given, both evaluations agree satisfactorily.
2.1.2. Aggregated transfer factor Tagsoil–plant
Tag(in m2/kg) is defined by the caesium activity concentration (in Bq/kg) of the
dry mass of the plants, divided by the total inventory (in Bq/m2) of the soil. Thus, the value of Tagis related to the total inventory, which means that the geometry of plant
roots, the depth distribution of137Cs, and the availability of the137Cs to plants in the root zone layer are not taken into consideration. This causes a high variability of Tag.
Measured values of Tagfor a plant can vary by a factor 100–1000, depending on
conditions in the soil and the distribution of roots of the respective plants (IAEA, 1994). Tagdetermination was done for all soil profiles.
2.1.3. Transfer factor TF soil–plant, attributed to the root zone
TF (in Bq/kg/Bq/kg) is defined by the caesium activity concentration (in Bq/kg) of the dry mass of the plants, divided by the caesium activity concentration (in Bq/kg)
of the air dried soil from the horizon, where most of the plant roots are located. For fern and blackberry in spruce forest this is the Ohhorizon. TF determination was
done for sites 13, 14, 16, 17 fertilized and 30 and 31 non-fertilized at the date of sampling. Five more sites in non-fertilized spruce forest in the neighbourhood were studied and the results are given in Konopleva et al. (2009). Those results are considered in this discussion as well.
2.2. Radiocaesium interception potential (RIP)
The product of the distribution coefficient Kd (137Cs) and the potassium
concentration in the soil represents the value of the radiocaesium interception potential RIP(Kþ) in relation to potassium, which will be written as ‘‘RIP’’ in this work. RIP is a measure for the selective sorption of137Csþby soils.
2.2.1. RIP determination (Wauters et al., 1996)
The air dried soil sample with organic matter being present (about 1 g) was equilibrated with a mixed potassium–calcium solution (0.5 mM KClþ100 mM CaCl2) to mask the regular exchange sites (RES) by Ca2þand to saturate frayed edge
sites (FES) by Kþ. After pre-saturation (3 times 20 h) a phase separation was implemented by centrifugation and the centrifuged soil sample was equilibrated with the same K–Ca solution, now spiked with137Cs. (The level of contamination of
the original soil was<0.83 Bq/g137Cs and the exchangeability was<17%, so we had
<0.14 Bq137Cs in solution. The level of the spiked solution was 10 Bq137Cs, which is
about 100 times more than in the original soil). After 24 h the distribution coefficient Kd(137Cs) was obtained by measuring the Cs activity remaining in the solution. RIP
determination was done for sites 13, 14, 16, 17 and 30, 31 in this work and earlier for site 30 byKonoplev et al. (1997)and for sites 13 and 30 byKonopleva et al. (1998) andKonoplev et al. (1999).
The radiocaesium interception potential in a NH4 scenario, RIP(NH4), was
measured in the same way, only NH4Cl was used instead of KCl. RIP(NH4) was
measured in order to estimate the selectivity coefficient KC(NH4/K) on frayed edge
sites (FES) (Table 3).
2.2.2. 137Cs exchangeabilityaex, exchangeable cations and prediction of TF for137Cs
After determining its137Cs activity the soil sample (50 g) was equilibrated with
1 M NH4OAc during 24 h using a solid/liquid ratio of 1:10 for mineral layers and of
1:20 for organic layers. The soil suspension was centrifuged and the solution was filtered through a 0.45mm membrane filter. The ratio of137Cs in the solution to that in the soil is its exchangeability. Contents of exchangeable Caþ, Mgþ, and Kþwere measured in a 1 M NH4OAc extract. Exchangeable ammonium was determined in
the same way using a 2 M KCl extract.137Cs exchangeability was determined for the
same sites as was RIP.
To predict the value ofTF for137Cs, one hypothesis has been to assume that TF is
proportional to the fraction of137Cs in the root exchange complex at the
plasma-lemma, which depends on the composition of the soil solution (Smolders et al., 1997). Using this hypothesisKonoplev et al. (1996, 1998)andKonoplev and Kono-pleva, 1999, developed a model which describes the bioavailability of137Cs in soil as
expressed in the form:
In this formula A is the ‘‘availability’’ factor, B, the proportionality coefficient between A and TF, is a plant specific property and characterizes the ability of a specific plant to sorb radiocaesium on the root exchange complex and transfer it through the cell wall,aexis the exchangeability of radiocaesium in soil, RIP is
a measure for the selective sorption of137Csþby soils, K
c(NH4/K) is the selectivity
coefficient of NH4þions with respect to the competing ion Kþ, in rectangular brackets
[ ] are the cation concentrations in the soil solution. This model was successfully tested for forest soils from Upper Swabia, Russia, Sweden and Switzerland ( Kono-plev et al., 1999, 2000). If sorption both on frayed edge sites (FES) and regular exchange sites (RES) is considered, this factor A can be rewritten as:
A¼ aex
concentration of radionuclide reversibly sorbed by the solid phase to its concen-tration in the liquid phase (Konoplev et al., 1992)
Kex
[ ]exare exchangeable cation concentrations in soil. These equations are used to
predict the values of TF, the transfer of137Cs from the root zone to the plant. The same equations were used byKonopleva et al. (2009)to explain that in spruce forest the bioavailability of radiocaesium was on average seven times higher than in mixed forest on sites in the neighbourhood to those of this study (Lindner et al., 1994). 0 200 400 600 800 1000 1200 1400
D
0 1000 2000 3000 4000 5000 6000
D
0 500 1000 1500 2000 2500 3000 3500
D
SoilpH was measured in 0.01 M CaCl2using a solid–liquid ratio of 1:2.5 for
mineral layers and a solid–liquid ratio of 1:5 for organic layers after 2 h of equilibration.
Soil texturewas determined using a hydrometer method (Gee and Bauder, 1986) after destruction of organic matter with hydrogen peroxide (30%). Classification of the soil by grain size was done according to USDA (US Department of Agriculture) standard.
The organic matter contentin samples (OM inTable 2) was determined by loss on ignition (10 h at 450C).
2.2.3. Soil solution isolation
To collect original soil solution at sites 16 and 17 a syringe without plunger was supplied with a paper filter. Then the soil sample was added and covered with glass fiber as a plug. The syringe with the soil was centrifuged for 1 h at 1700 g. The soil solution was filtered through a 0.45mm membrane filter.
Soil solution at sites 13 and 30 was gained by rewetting dried soil samples in a solid/liquid ratio of 1:5.
Cation content(K, Ca, and Mg) in soil solution was determined using atomic absorption spectrophotometry (AAS). The uncertainties are 0.1 mg/l for K and Mg and 0.2 mg/l for Ca. The NH4in soil solution was measured with a colorimetric
method by indophenol reaction (Krom, 1980). The uncertainty was about 5% as tested by replicates.
3. Results for fertilized and non-fertilized soils
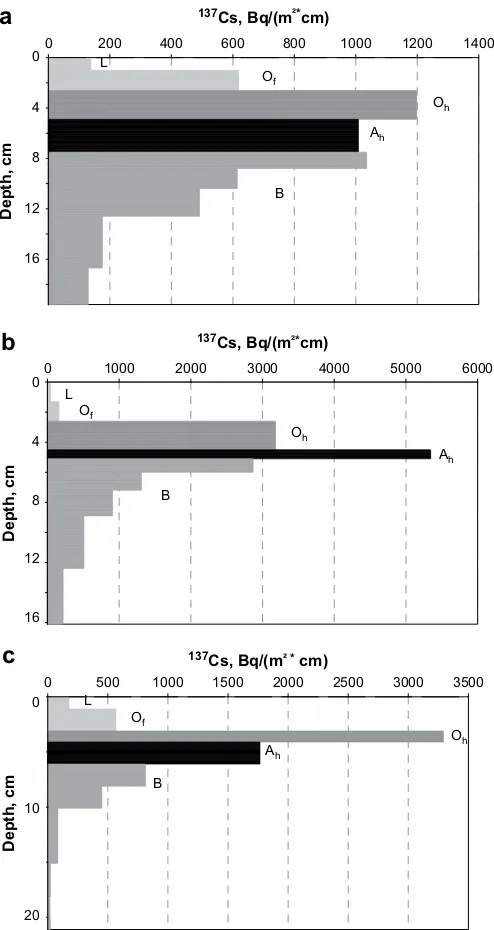
3.1. Depth distribution of
137Cs in forest soil
As can be seen in
Fig. 2
the spatial distribution of
137Cs in typical
profiles of spruce forest soil is changing only slightly under the
influence of time and fertilization. Maxima of the
137Cs activity
concentration are found always in O
hor A
hhorizons. The thickness
of the total humus layer (L, O
f, and O
h) is independent of the
timespan of (13 or 22) years after fertilization and does not depend
on fertilization (see also
Table 1
). Only the fraction of
137Cs in the O
hhorizon is larger in fertilized soil (see also
Table 1
).
In
Table 1
, expectation values and standard deviations of the
properties of all soil profiles studied are given. The data sets used in
Table 1
can be described with normal distributions according to the
Kolmogorov–Smirnov test and are thus characterized by the
arithmetic mean and standard deviation of the corresponding
normal distribution.
137Cs inventories in the fertilized profiles
studied are about 20% higher than those in non-fertilized profiles
and the variation in total inventories is substantial as indicated by
the large standard deviation in both fertilized and non-fertilized
plots. The mean fractional inventory is higher in non-fertilized L, O
fan A
hhorizons than in the respective fertilized horizons. In
fertil-ized O
hhorizons the mean fractional inventory is highest and
amounts to 34%. Mean values of pH are higher in fertilized L, O
f, O
hand A
hhorizons than in non-fertilized horizons. Mean values of the
lower bound of the depth of non-fertilized horizons are by 0.1–
0.7 cm larger than in fertilized horizons (
Table 1
). For all these
quantities standard deviations are substantial indicating that the
trends described above are masked by the variability of the
quantities.
The understory biomass production on fertilized plots was
larger than on non-fertilized plots as observed qualitatively during
sampling.
3.2. T
agof fern and blackberry
According to
Table 1
, mean values of the
137Cs activity
concen-tration of Fern and Blackberry are higher on non-fertilized plots by
factors 3.2 and 2.8. Mean values of T
agare higher on non-fertilized
plots by factor 4.4 and 5 than on fertilized plots respectively. In
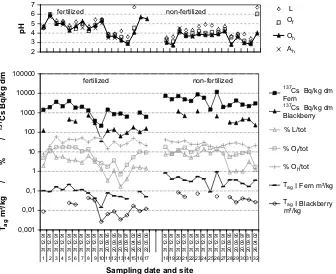
Fig. 3
single values of the
137Cs activity concentration (Bq/kg),
aggregated transfer factor (T
ag) in Fern and Blackberry, the
frac-tional
137Cs inventory (%) in L, O
fand O
hhorizons of the respective
profiles, and soil pH in L, O
f, O
hand A
hhorizons versus sampling
date and site number are shown. The following correlations exist
between the data sets given in
Fig. 3
:
For fertilized sites N
. 1–17 the data sets for activity
concentra-tion of plants and T
agsoil–plant are correlated with Pearson
correlation coefficients
r
¼
0.97,
p
¼
10
4for fern and
r
¼
0.93,
p
¼
10
4for blackberry. For non-fertilized sites N
. 18–32 the data
sets for activity concentration of plants and T
agsoil–plant are
correlated with
r
¼
0.91,
p
¼
10
4for fern and
r
¼
0.94,
p
¼
10
4for
blackberry, although values of activity concentration and T
agare
higher as indicated above. The fractional
137Cs inventory (%) in
fertilized L horizons is correlated to the aggregated transfer factor
(T
ag) of Blackberry with
r
¼
0.92,
p
¼
10
4, whereas for fern
r
¼
0.24,
p
¼
0.37 and
R
¼
0.54,
p
<
0.05. For the fractional
137Cs inventory (%)
of O
fhorizons of fertilized soils and T
agof fern and blackberry the
statistical parameters are
r
¼
0.76,
p
¼
0.001 and
r
¼
0.59,
p
¼
0.034
respectively. The fractional
137Cs inventory (%) in non-fertilized L
horizons is correlated with the value of T
agof blackberry with
r
¼
0.72,
p
¼
0.03. The fractional
137Cs inventory (%) in
non-fertil-ized O
fhorizons is correlated with the value of T
agof blackberry
with
r
¼
0.62,
p
¼
0.73 and
R
¼
0.7,
p
<
0.05. The fractional
137Cs
inventory (%) in O
hhorizons are always higher than those of O
fand
L horizons. Soil pH is generally higher for fertilized plots as already
mentioned and correlation coefficients of pH values and T
agof fern
and blackberry are small except for the non-fertilized A
hhorizons
r
¼
0.58,
p
¼
0.99 but
R
¼
0.68,
p
<
0.05. Single values of pH e.g. sites
N
. 14 and 31 can be small although the corresponding T
ag
values
are small (14) or high (31). pH values are highest in L horizons, and
smallest in O
hor A
hhorizons.
3.3. Main soil characteristics
According to
Table 2
, the soils under study can be characterized
as high organic matter soils with fractions of organic matter (OM)
ranging between 54% and 89% in the O
hhorizon. Fertilized soils
show reduced organic matter content. Soil textures can be classified
as sandy clay loam. As determined in 2006, silt is the dominant
grain size fraction with 48–51.5% in the mineral B horizon.
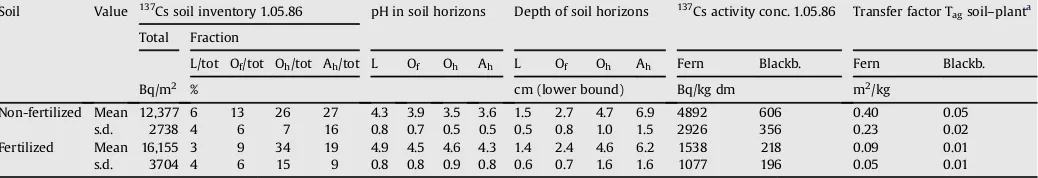
Table 1
Properties of soil profiles: Arithmetic mean and standard deviation (s.d.) calculated from 15 profiles non-fertilized and 17 profiles fertilized, under the assumption of a normal distribution, (Kolmogorov–Smirnovp¼non significant was fulfilled);137Cs soil inventories and activity concentrations of plants are decay corrected for May 1st, 1986.
Soil Value 137Cs soil inventory 1.05.86 pH in soil horizons Depth of soil horizons 137Cs activity conc. 1.05.86 Transfer factor T
agsoil–planta Total Fraction
L/tot Of/tot Oh/tot Ah/tot L Of Oh Ah L Of Oh Ah Fern Blackb. Fern Blackb.
Bq/m2 % cm (lower bound) Bq/kg dm m2/kg
Non-fertilized Mean 12,377 6 13 26 27 4.3 3.9 3.5 3.6 1.5 2.7 4.7 6.9 4892 606 0.40 0.05
s.d. 2738 4 6 7 16 0.8 0.7 0.5 0.5 0.5 0.8 1.0 1.5 2926 356 0.23 0.02
Fertilized Mean 16,155 3 9 34 19 4.9 4.5 4.6 4.3 1.4 2.4 4.6 6.2 1538 218 0.09 0.01
s.d. 3704 4 6 15 9 0.8 0.8 0.9 0.8 0.6 0.7 1.6 1.6 1077 196 0.05 0.01
aThe time-dependency of T
According to
Table 3
in non-fertilized spruce forest soil the
137Cs
exchangeability
a
exis about a factor 3–5 higher than in fertilized
soil. Radiocaesium Interception Potential RIP values are higher after
fertilization than before. In the soil solution potassium
concentra-tions are comparable to ammonium concentraconcentra-tions. RIP values
were determined for O
hhorizons of the soils under study. Our data
show that the higher values of the
137Cs exchangeability correspond
to lower values of RIP. The values of K
FEScð
NH
4=
K
Þ
are in a range from
3.2 to 3.7. The RIP values range from 35–829 meq/kg in the O
hhorizon in spruce forest and decrease with increasing organic
matter content (
Tables 2 and 3
). The RIP values increase with the
portion of clay minerals in O
hlayers (3.3% for the non-fertilized
profile site N
. 30 and 9–12% for the fertilized profiles, as calculated
from
Table 2
).
3.4. Measured and predicted
137Cs transfer TF
In
Table 3
the predicted ‘‘availability factor’’ ‘‘A’’ is shown
together with measured values of RIP. In soils of fertilized forests
the selective sorption of Cs
þon frayed edge sites (FES) dominates as
indicated by the small contribution of K
RESdin
Table 3
,
character-izing the sorption on regular exchange sites (RES). Availability
factors ‘‘A’’ of fertilized soils are mostly smaller than those of
non-fertilized soils (
Table 3
).
Table 3
also presents the measured values
of TF, attributed to the root zone for fern and blackberry, and the RIP
values of the correspondent soil layer for both cases. These
empirical TF values are about a factor of 3–10 smaller for fertilized
soil, this means they are positively correlated to the predicted A
factor on fertilization.
4. Discussion
4.1. Depth distribution of
137Cs in forest soil
137
Cs inventories of undisturbed soils can vary substantially and
the variation given in
Table 1
is similar to the variation found in the
literature (
IAEA, 1994
). The differences in fractional
137Cs
invento-ries of soil horizons in fertilized and non-fertilized sites can be
2 3 4 5 6 7
p
H
L fertilized non-fertilized
Of
Oh
Ah
0,001 0,01 0,1 1 10 100 1000 10000 100000
31.12.91 31.12.91 31.12.91 31.12.91 31.12.91 31.12.91 31.12.91 31.12.91 31.12.91 31.12.91 20.09.95 20.09.95 20.09.97 20.09.97 26.04.02 22.05.06 22.05.06 31.12.91 31.12.91 31.12.91 31.12.91 31.12.91 31.12.91 31.12.91 31.12.91 31.12.91 31.12.91 20.09.95 20.09.95 20.09.97 20.09.97 26.04.02
Sampling date and site
T
ag
m
²/
k
g
/
%
/
1
3
7
C
s
B
q
/k
g
d
m
% L/tot
% Oh/tot % Of/tot
Fern m²/kg
Blackberry m²/kg fertilized non-fertilized
1 2 3 4 5 6 7 8 9 10 11 12 13 14 15 1617 18 19 20 21 22 23 24 25 26 27 28 29 30 31 32
Tag Tag
137Cs Bq/kg dm
Blackberry 137
Cs Bq/kg dm Fern
Fig. 3.Lower part:137Cs activity concentration (Bq/kg), fractional137Cs inventory (%) in L, O
fand Ohhorizons of the respective profiles, and aggregated transfer factor Tag (m2/kg) in Fern and Blackberry versus sampling date and site number. In the upper part the corresponding pH values are shown. Sites N. 1–17 were fertilized. Sites N. 18–32 were non-fertilized at the date of sampling. Missing data points indicate that a plant was not growing on the soil profile.
Table 2
Particle-size and physicochemical soil properties of root zone layers Ohof non-fertilized and fertilized soils. Soil texture is sandy clay loam.
Soil Site, n. Depth, cm pH, CaCl
2 OM, % Particle-sizea Exchangeable cations Clay % Silt % Sand % Kþcmol kg1 NH
4
þcmol kg1 Ca2þcmol kg1 Mg2þcmol kg1
Non-fertilized 30 2.4–4.7 3.0 89 30 24 47 0.69 12 2.8
31 2–3.5 2.9 86 30 24 47 0.84 10
Fertilized 13 2.4–4.3 3.2 70 30 29 41 0.8 13.8 2.4
14 2.2–4.5 2.9 78 30 29 41 0.9 13.5
17 2–4 5.5 54 27 51.5 21.5 0.3 0.03 17.0 9.2
16 3–4 5.7 68 27 48 25 0.5 0.03 45.3 18.1
aParticle-size distribution was determined for B soil layers for samples in 2006 (Gee and Bauder, 1986); samples of 1997 were classified according to maps of forest
attributed to the stronger binding and the smaller bioavailability of
Cs in O
hhorizons of the fertilized sites, and agrees with the lower
fractional inventories found in the L, and O
fhorizons from this part,
due to the lower activity concentrations of the plant cover (
Lindner
et al., 1994
). The observed increase in pH after fertilization supports
the observed smaller bioavailability on fertilized sites. The depth of
the horizons in spruce forest soil is slightly larger on non-fertilized
plots caused by the lower rate of litter decomposition as compared
to fertilized plots; and possibly also due to the fact, that the biomass
production is smaller on non-fertilized plots and so less organic
material is taken out of this soil (
Zibold et al., 2003
).
4.2. T
agof fern and blackberry
137
Cs activity concentration (Bq/kg) and aggregated transfer
factor (T
ag) of Fern and Blackberry show smaller values on fertilized
soil because of the higher values of soil pH after fertilization
(
Drissner et al., 1996; Zibold et al., 2003
), however a correlation
between observed values of pH and T
ag(
Fig. 3
) is not found. For
fertilized profiles graphs for activity concentration and T
agin
Fig. 3
are correlated of course. For non-fertilized profiles there exists the
same correlation, however values of
137Cs activity concentration
(Bq/kg) and aggregated transfer factor (T
ag) are higher than those of
fertilized profiles. Comparing the graph of T
agto the graphs of the
fractional
137Cs inventory (%) in L and O
fhorizons in
Fig. 3
it can be
seen, that small values of T
agare measured for small fractional
inventories in L and O
fhorizons, and thus the transfer of
137Cs from
the L and O
fhorizons is decreasing with the fractional inventory in
these horizons which is supported by the correlation found
between these quantities. In the O
hhorizon the fractional
137Cs
inventory is highest and it is unaffected by fertilization. Therefore,
the uptake of
137Cs must be smaller in O
h
horizons than in O
fhorizons. pH values of O
fhorizons in
Fig. 3
are higher than in O
hhorizons and thus support a lower
137Cs transfer from
137Cs
enriched O
hhorizons and
137Cs depleted O
fhorizons. Even the low
value of pH at site 11 as compared to site 10 of
Fig. 3
is reflected in
a relatively large T
agvalue.
4.3. Main soil characteristics
Low soil solution K
þconcentrations in the root zone have an
essential influence on the plant availability of
137Cs (
Zhu and
Smolders, 2000
). The dependence of the
137Cs uptake by plants on
potassium in the K
þconcentration range of less than 1 mM has
been well studied (
Smolders et al., 1996; Waegeneers et al., 2001
).
The plant to solution concentration ratio CF for
137Cs is reduced
with increased K concentration in the solution and the largest effect
of K on Cs uptake was found in the K
þconcentration range of less
than 0.25 mM (
Zhu and Smolders, 2000
). So, observed low
concentrations of potassium in soil solution may cause higher
137Cs
soil–plant transfer.
The RIP value characterizes the ability of soils to selectively sorb
Cs
þ(
Cremers et al., 1988
). Taking into account the measured
potassium and ammonium concentrations means that in most sites
ammonium plays a more important role than potassium as
a competing cation of radiocaesium for the selective sorption sites
(FES) – not due to concentration but to its higher selectivity value
(
Table 3
).
The smaller portion of clay minerals in the humus layers of
non-fertilized spruce forest is caused by the lower rate of litter
decomposition. Coniferous litter decomposes very slowly and
forms a thick humus horizon like mor or moder.
For soils in fertilized forests essentially higher RIP values as
compared to non-fertilized forests have been observed and from
Eq.
(1)
can be expected that radiocaesium soil–plant transfer for the
fertilized forests should be lower than that for non-fertilized
forests.
4.4. Measured
137Cs transfer TF and predicted A values
It can be seen from
Table 3
that as expected fern has
substan-tially higher TF values in comparison to blackberry. For soils in
fertilized forests essentially higher RIP values as compared to
non-fertilized forests have been observed and it may be expected that
Table 3Selected characteristics of non-fertilized and fertilized soils: 137Cs exchangeability
aex; Radiocaesium Interception Potential RIP(K), RIP(NH4); selectivity coefficient KFES
c ðNH4=KÞ; soil solution Kþ, NH4þ, Ca2þand Mg2þconcentrations; percentage of137Cs on RES KRESd ; calculated availability factors (A); measured137Cs soil–plant transfer
factors TF attributed to root zone Oh.
Soil Site, n. a
ex, % RIP(K), meq/kg
RIP(NH4), meq/kg
KFES c ,
meq/kg
Kþ, mM NH 4
þ’ mM Ca2þ, mM Mg2þ, mM KRES
d , % A 104mM1/2,
kg/meq
TF, Bq$kg1/Bq$kg1
Fern Blackberry
Non-fertilized 30 14.8 35 0.17 0.76 0.26 0.12 23.7 3.2 0.6
30 14.8 35 –a –a –a –a 239 3.2 0.6
31 17 74 –a –a –a –a 141 1.2 0.3
Fertilized 13 2.8 190 0.17 0.91 0.3 0.09 2.4 0.4 0.03
13 2.8 190 –a –a –a –a 8 0.4 0.03
14 5.3 108 –a –a –a –a 29 0.3 0.04
17 2.2 829 223 3.2 0.03 0.05 1.34 1.02 1 0.03 0.9 0.21
16 2.6 179 90 3.7 0.07 0.07 2.29 1.31 4 0.15 0.7 0.07
aCation concentrations measured only in water extracts, S:L¼1:5.
Table 4
Soil properties collected from our earlier work:137Cs exchangeabilitya
ex; Radiocaesium Interception Potential RIP; calculated availability factors (A); measured137Cs soil–plant transfer factors attributed to root zone TF.
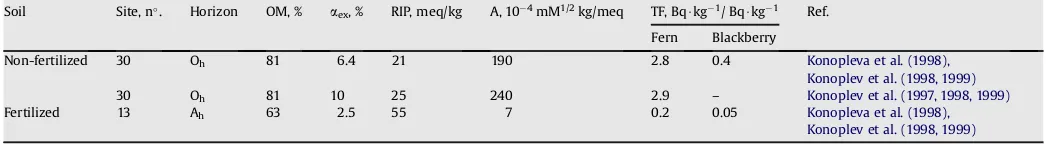
Soil Site, n. Horizon OM, % a
ex, % RIP, meq/kg A, 104mM1/2kg/meq TF, Bq$kg1/ Bq$kg1 Ref.
Fern Blackberry
Non-fertilized 30 Oh 81 6.4 21 190 2.8 0.4 Konopleva et al. (1998),
Konoplev et al. (1998, 1999)
30 Oh 81 10 25 240 2.9 – Konoplev et al. (1997, 1998, 1999)
Fertilized 13 Ah 63 2.5 55 7 0.2 0.05 Konopleva et al. (1998),
radiocaesium soil–plant transfer for the fertilized forests should be
lower than that for non-fertilized forests.
Thus,
Table 3
clearly shows that RIP plays a predominant role in
characterizing fertilized and non-fertilized forest soils in terms of
radiocaesium bioavailability. These results are supported by earlier
work which is collected in
Table 4
for comparison.
A total of 6 fertilized samples and 5 non-fertilized samples have
been investigated (
Tables 3 and 4
). Samples from sites 16 and 17
have been investigated using the method of masking with a K–Ca
mixture to determine RIP, for all other investigations the Ag(TU)
4method was used. Both methods yield essentially the same results
concerning A values (
Tables 3 and 4
). The following statements can
be made from the comparison of non-fertilized and fertilized soils:
O
hhorizons of non-fertilized soils have a higher organic matter
(OM) fraction.
The exchangeability
a
exis higher in non-fertilized soils.
RIP of O
hhorizons is about an order of magnitude smaller in
non-fertilized soils.
Predicted A values are about an order of magnitude higher for
non-fertilized soils.
Measured TF values of fern and blackberry are about an order of
magnitude higher on non-fertilized soils.
5. Conclusion
For predicting Cs uptake the performance of the RIP approach
can be compared to T
agmonitoring.
T
agmonitoring needs several but simple activity measurements;
the geometry of plant roots, the depth distribution of
137Cs, and the
availability of the
137Cs to plants in the root zone layer are not taken
into consideration. In
Fig. 3
the variation of the T
agof fern and
blackberry in spruce forest is about 100% as measured in 15 or 17
sampling sites. With respect to Cs uptake, this uncertainty still
allows to discriminate between fertilized or non-fertilized soils or
between mixed forest and spruce forest (
Lindner et al., 1994
).
Besides the possibility to predict the transfer factor (TF) and to
explain its variations the advantage of the RIP approach is that one
may know in advance where to expect higher and where lower TF
values only on the basis of soil properties which is important for
taking decision concerning countermeasures. It is possible to map
the soil in terms of arbitrary TF values for emergency or for
terri-tories with potential chronical sources. However, the RIP-appraoch
needs a chemistry lab to determine sorption, exchangeability and
ion concentrations besides activity measurements; it can explain
the Cs uptake from soil to plant; it takes account of the geometry of
plant roots and the depth distribution of
137Cs. Uncertainties of
these parameters add up and limit the information of single RIP
measurements. However, these uncertainties associated with the
predicted transfer factors using the RIP approach can be avoided in
selected cases, when a series of samples can be studied e.g. in this
work or to explain the influence of the kind of stocking on
radio-nuclide-uptake in forest (
Konopleva et al., 2009
). Under normal
field conditions the RIP approach is not feasible because the effort
to access its input parameters is too high. From
Tables 3 and 4
the
value of A in the non-fertilized site 30 was predicted 3 times with
a relative uncertainty of about 100%. In TF measurements the plant
concentration is related to the soil concentration of a specific
horizon; these concentrations are determined in general with
a statistical accuracy of 5%.
In spruce forest soil treated with lime plus potassium and
phosphorous fertiliser, values of pH, and radiocaesium interception
potential RIP were higher than corresponding values from
non-fertilized reference plots whereas values of
137Cs exchangeability
a
exwere smaller. Using this result, values of the bioavailability of
137
Cs were predicted as at least 10 times higher for non-fertilized
soil as compared to fertilized soil and they explained the measured
137
Cs soil–plant transfer factors TF attributed to the root zone for
fern (
D. carthusiana
) and blackberry (
R. fruticosus
). These findings
explain efficient reduction of radiocaesium soil–plant transfer on
fertilized forest soil as compared to non-fertilized soil.
Acknowledgement
Funding by Baden-Wu¨rttemberg Projektra¨gerschaft
Lebens-grundlage Umwelt und ihre Sicherung (BWPLUS) project N
. BWR
24018 ‘‘Migration und Bioverfu¨gbarkeit von Radioca¨sium in Bo¨den
Su¨ddeutschlands’’ and continuous support by FD Dr. Bosch and his
coworkers during sampling are gratefully acknowledged.
References
Bericht u¨ber den Zustand des Waldes, 2006.http://www.bmelv.deGermany 2006. Bre´chignac, F., Moberg, L., Suomela, M., 2006. Long-term environmental behaviour
of radionuclides. I P S N - C E C association final report. ISPN, pp. 1–65. Camps, M., Rigol, A., Hillier, S., Vidal, M., Rauret, G., 2004. Quantitative assessment
of the effects of agricultural practices designed to reduce137Cs and 90Sr soil–
plant transfer in meadows. Science of the Total Environment 332, 23–38. Cremers, A., Elsen, A., De Preter, P., Maes, A., 1988. Quantitative analysis of
radio-caesium retention in soils. Nature 335 (6187), 247–249.
Drissner, J., Flu¨gel, V., Klemt, E., Miller, R., Schick, G., Zibold, G., 1996. Transfer of radiocesium in prealpine forest ecosystems. In: Amiro, B., Avadhanula, R., Johansson, G., Larsson, C.M., Lu¨ning, M. (Eds.), Proc. International Symposium on Ionizing Radiation ‘‘Protection of the Natural Environment’’. Sweden, Stockholm, pp. 218–223.
Fesenko, S., Voigt, G., Spiridonov, S., Gontarenko, I., 2005. Evaluation of the effec-tiveness of countermeasures in contaminated forests. Radioprotection 40 (Suppl. 1), S825–S832.
Bodenschutzkalkung im Wald, 2000. Forstliche Versuchs- und Forschungsanstalt BW, Freiburg, Germany. Merkblatt 50.
Gee, G.W., Bauder, J.W., 1986. Particle-size analysis. In: Klute, A. (Ed.), Methods of Soil Analysis. Part 1-Physical and Mineralogical Methods – Agronomy mono-graph, vol. 9, pp. 383–411. Madison, Wisconsin USA.
International Atomic Energy Agency (IAEA), 1994. Handbook of Parameter Values for the Prediction of Radionuclide Transfer in Temperate Environments. Tech-nical Report Series N. 364 Vienna, Austria.
Kaunisto, S., Aro, L., Rantavaara, A., 2002. Effect of fertilization on the potassium and radiocaesium distribution in tree stands (Pinus sylvestrisL.) and peat on a pine mire. Environmental Pollution 117, 111–119.
Konoplev, A.V., Konopleva, I.V., 1999. Parameterisation of137Cs soil–plant transfer through key soil characteristics. Radiation Biology, Radioecology 39, 457–463 (in Russian).
Konoplev, A.V., Bulgakov, A.A., Popov, V.E., Bobovnikova, Ts.I.,1992. Behaviour of long– lived Chernobyl radionuclides in a soil–water system. Analyst 117, 1041–1047. Konoplev, A.V., Viktorova, N.V., Virchenko, E.P., Popov, V.E., Bulgakov, A.A.,
Desmet, G.M., 1993. Influence of agricultural countermeasures on the ratio of different chemical forms of radionuclides in soil and soil solution. Science of the Total Environment 137, 147–162.
Konoplev, A.V., Drissner, J., Klemt, E., Konopleva, I.V., Zibold, G.,1996. Parameterisation of radiocaesium soil–plant transfer using soil characteristics. In: Gerzabek, M. (Ed.), Proceedings of XXVIth Annual Meeting of ESNA. Working Group 3: Soil–Plant Relationships, Busteni (Romania) 12–16 September 1996, pp. 147–153.
Konoplev, A.V., Drissner, J., Klemt, E., Konopleva, I.V., Miller, R., Zibold, G., 1997. Characterisation of soil in terms of radiocaesium availability to plants. In: Proceedings of XXVII Annual Meeting of ESNA, Ghent, Belgium, 29. August–2. September 1997. Working Group 3: Soil-Plant-Relationships, pp. 163–169. Konoplev, A.V., Avila, R., Bulgakov, A.A., Drissner, J., Johanson, K.J., Klemt, E.,
Konopleva, I.V., Miller, R., Nikolova, I., Popov, V.E., Zibold, G., 1998. Modelling radiocaesium bioavailability in soil. In: Van der Stricht, E. (Ed.), Proceedings of International Union of Radioecologists Topical Meeting, SCK-CEN, Mol, Belgium, 1–5 June 1998, pp. 197–205.
Konoplev, A.V., Avila, R., Bulgakov, A.A., Drissner, J., Johanson, K.J., Klemt, E., Konopleva, I.V., Miller, R., Nikolova, V.E., Popov, V.E., Zibold, G., 1999. Modelling radiocaesium bioavailability in forest soils. In: Linkov, I., Schell, W.R. (Eds.), Contaminated Forests. Proc. NATO Advanced Research Workshop, Kiev (Ukraine) 24–28. June 1998, pp. 217–229.
Konoplev, A.V., Avila, R., Bulgakov, A.A., Johanson, K.J., Konopleva, I.V., Popov, V.E., 2000. Quantitative assessment of radiocaesium bioavailability in forest soils. Radiochimica Acta 88, 789–792.
Konopleva, I.V., Klemt, E., Konoplev, A.V., Zibold, G., 2009. Migration and bioavail-ability of137Cs in forest soil of Southern Germany. Journal of Environmental
Radioactivity 100, 308–314.
Krom, M.D., 1980. Spectrophotometric determination of ammonia: a study of a modified Berthelot reaction using salicilate and dichloroisocyanurate. Analyst 105, 305–316.
Lembrechts, J., 1993. A review of literature on the effectiveness of chemical amendments in reducing the soil-to-plant transfer of radiostrontium and radiocaesium. Science of the Total Environment 137, 81–98.
Levula, T., Saarsalmi, A., Rantavaara, A., 2000. Effects of ash fertilization and prescribed burning on macronutrient, heavy metal sulphur and137Cs
concen-trations in lingonberries (Vaccinium vitis-idaea). Forest Ecology and Manage-ment 126, 269–279.
Lindner, G., Drissner, J., Herrmann, T., Hund, M., Zech, W., Zibold, G., Zimmerer, R., 1994. Seasonal and regional variations in the transfer of caesium radionuclides from soil to roe deer and plants in a prealpine forest. Science of the Total Environment 157, 189–196.
Rauret, G., Firsakova, S., 1996. The Transfer of Radionuclides Through the Terrestrial Environment to Agricultural Products, Including the Evaluation of Agrochemical Practices. EUR 16528 EN. European Commission, Luxembourg.
Rauret, G., Alexakhin, R.M., Kruglov, S.V., Cremers, A., Wauters, J., Valcke, E., Ivanov, Y., Vidal, M., 1996. Physical and chemical factors influencing radionu-clide behavior in arable soils. In: Karaglou, A., Desmet, G., Kelly, G.N., Menzel, H.G. (Eds.), The Radiological Consequences of the Chernobyl Accident. EUR 16544 EN. European Commission, Brussels, pp. 81–96.
Smolders, E., Kiebooms, L., Buysse, J., Merckx, R., 1996.137Cs uptake in spring wheat
(Triticum aestivumL. cv Tonic) at varying K supply. I. The effect in solution culture. Plant and Soil 181, 205–210.
Smolders, E., Sweeck, L., Merckx, R., Cremers, A., 1997. Cationic interactions in radiocaesium uptake from solution by spinach. Journal of Environmental Radioactivity 34, 161–170.
Waegeneers, N., Camps, M., Smolders, E., Merckx, R., 2001. Genotypic effects in phytoavailability of radiocaesium are pronounced at low K intensities in soil. Plant and Soil 235, 11–20.
Wauters, J., Elsen, A., Cremers, A., Konoplev, A.V., Bulgakov, A.A., Comans, R.N.J., 1996. Prediction of solid/liquid distribution coefficients of radiocaesium in soils and sediments. Part one: a simplified procedure for the solid phase character-isation. Applied Geochemistry 11, 589–594.
Zhu, Y.G., Smolders, E., 2000. Plant uptake of radiocaesium: a review of mechanisms, regulation and application. Journal of Experimental Botany 51, 1635–1645. Zibold, G., Drissner, J., Klemt, E., Konopleva, I.V., Konoplev, A.V., Miller, R., 1997.
Biologische Verfu¨gbarkeit von Ca¨sium-Radionukliden in Waldgebieten des no¨rdlichen und su¨dlichen Voralpenlandes. In: Hecht, H., Honikel, K.O. (Eds.), Radioca¨sium in Wald und Wild. Bundesanstalt fu¨r Fleischforschung, Kulmbach, pp. 43–64.
Zibold, G., Drissner, J., Ha¨rle, C., Klemt, E., Spasova, Y., 2003. Measurement and modelling of137Cs in soil and biomass of a prealpine spruce forest. In: