Influence of hydromorphic soil condition (1)
Teks penuh
Gambar

Garis besar
Dokumen terkait
The present study involved determination of colour of soils collected from different regions of the state with varying properties at laboratory using Munsell Soil Colour chart
The monthly number of forest fires (or number of fire scars) and monthly total burned area are plotted against the monthly near surface soil moisture deviation in figures 2 and 3
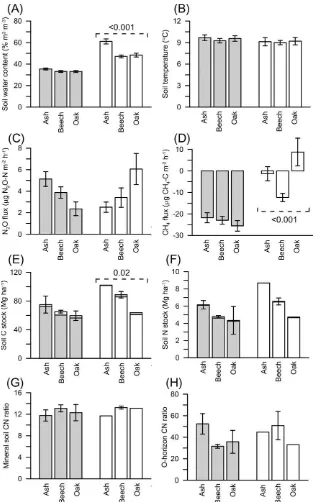
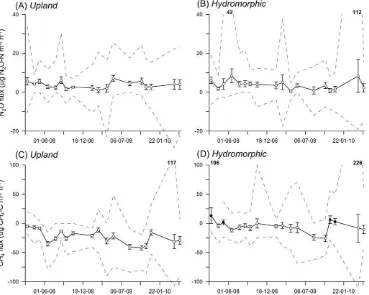
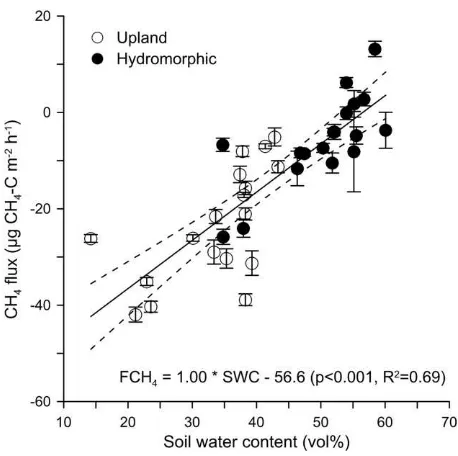
Hence, climate change effects on C- gas flux in taiga forest soils will depend on the relationship between soil temperature and moisture and the concomitant changes in soil
Microbial biomass (assayed by chloroform fumigation – extraction) nearly doubled in surface (0 – 5 cm) mineral soils in response to earthworm activity, an effect that
From laboratory approach 14 sites, 57 sites and 11 sites were found to be in low, moderate and high fertility indices, respectively for the 75 sites covered by both farmers assessment
Changes in microbial biomass and community composition soil carbon and soil nitrogen pools after incorporation of rye into three California agricultural soils.. Ed., The
The effect of the type and amount of organic matter on the maximum adsorption capacity of reclaimed-mining soils to absorb Fe from acid mine drainage is related to increasing the number
and the law 109 Drainage prospects for saline wheatbelt soils 112 Sub-surface drainage methods for salinity control 115 Saltland drainage: case studies 119 Assessment of waterlogged
