Other uses, including reproduction and distribution, or selling or
licensing copies, or posting to personal, institutional or third party
websites are prohibited.
In most cases authors are permitted to post their version of the
article (e.g. in Word or Tex form) to their personal website or
institutional repository. Authors requiring further information
regarding Elsevier’s archiving and manuscript policies are
encouraged to visit:
Contents lists available atScienceDirect
Forest Ecology and Management
j o u r n a l h o m e p a g e :w w w . e l s e v i e r . c o m / l o c a t e / f o r e c o
The relation of harvesting intensity to changes in soil, soil water, and stream
chemistry in a northern hardwood forest, Catskill Mountains, USA
Jason Siemion
a,∗, Douglas A. Burns
a, Peter S. Murdoch
a, Rene H. Germain
baU.S. Geological Survey, Troy, NY, United States
bState University of New York, College of Environmental Science and Forestry, Syracuse, NY, United States
a r t i c l e
i n f o
Article history:
Received 9 September 2010
Received in revised form 27 January 2011 Accepted 29 January 2011
Available online 20 February 2011
Keywords:
Stream water quality Nitrate
Aluminum Calcium Partial harvest
a b s t r a c t
Previous studies have shown that clearcutting of northern hardwood forests mobilizes base cations, inorganic monomeric aluminum (Alim), and nitrate (NO3−-N) from soils to surface waters, but the effects
of partial harvests on NO3−-N have been less frequently studied. In this study we describe the effects
of a series of partial harvests of varying proportions of basal area removal (22%, 28% and 68%) on Alim,
calcium (Ca2+), and NO
3−-N concentrations in soil extracts, soil water, and surface water in the Catskill
Mountains of New York, USA. Increases in NO3−-N concentrations relative to pre-harvest values were
observed within a few months after harvest in soils, soil water, and stream water for all three harvests. Increases in Alimand Ca2+concentrations were also evident in soil water and stream water over the
same time period for all three harvests. The increases in Alim, Ca2+, and NO3−-N concentrations in the
68% harvest were statistically significant as measured by comparing the 18-month pre-harvest period with the 18-month post-harvest period, with fewer significant responses in the two harvests of lowest intensity. All three solutes returned to pre-harvest concentrations in soil water and stream water in the two lowest intensity harvests in 2–3 years compared to a full 3 years in the 68% harvest. When the results of this study were combined with those of a previous nearby clearcut and 40% harvest, the post-harvest increases in NO3−-N concentrations in stream water and soil water suggest a harvesting level above
which the relation between concentration and harvest intensity changes; there was a greater change in concentration per unit change in harvest intensity when basal area removal was greater than 40%. These results indicate that the deleterious effects on aquatic ecosystems previously demonstrated for intensive harvests in northern hardwood forests of northeastern North America that receive high levels of atmospheric N deposition can be greatly diminished as harvesting intensity decreases below 40–68%. These results await confirmation through additional incremental forest harvest studies at other locations throughout the world that receive high levels of atmospheric N deposition.
Published by Elsevier B.V.
1. Introduction
Although nitrogen (N) is considered a growth-limiting nutrient in forests at a global scale (Magnani et al., 2007), many regions receive atmospheric N deposition in excess of biological demand, leading to elevated rates of net nitrification and leaching of nitrate (NO3−-N) through soils to adjacent surface waters (Aber et al., 1989). These regions of excess N deposition include forested lands in Europe, North America, and Asia that receive atmospheric N deposition that originates from NOxemissions of coal-fired power plants, ammonia (NH3) emissions from agricultural sources, and
NOxemissions from mobile sources (Gundersen et al., 2006; Elliott et al., 2007; Stephen and Aneja, 2008). Many of these forested
∗Corresponding author. Tel.: +1 518 285 5623; fax: +1 518 285 5601.
E-mail address:[email protected](J. Siemion).
regions have been receiving elevated atmospheric N deposition for decades resulting in large N stores and decreased C/N ratios in these ecosystems, particularly in soils (Aber et al., 1989; Johnson, 1992; Gundersen et al., 2006).
Intensive harvests such as clearcuts or whole-tree harvests in forests that receive elevated levels of atmospheric N deposi-tion often induce large releases of NO3−-N from soils, commonly
resulting in about 3–5 years of elevated NO3−-N concentrations
in surface waters (Hornbeck and Kropelin, 1982; Reynolds et al., 1995; Martin et al., 2000; Gundersen et al., 2006; Fukushima and Tokuchi, 2008). This release of NO3−-N is believed to result largely
from a lack of uptake of N by the vegetation that was removed; once a secondary forest is established, stream NO3−-N concentrations
generally diminish rapidly (Likens et al., 1969; Burns and Murdoch, 2005). Numerous other processes such as decreased N immobiliza-tion by microbes due to decreased litterfall rates also contribute to the response observed in surface water NO3−-N concentrations
(Prescott, 1997). In upland areas with steep slopes, thin soils, and resistant bedrock, the post-harvest period of elevated surface water NO3−-N concentrations is often accompanied by elevated losses of
nutrient base cations such as calcium (Ca2+), magnesium (Mg2+),
and potassium (K+) from soils, and increased soil water and surface
water acidity as evidenced by decreased pH and acid-neutralizing capacity (ANC) (Hornbeck et al., 1990; Dahlgren and Driscoll, 1994). Harvesting-induced increases in stream acidity and accompany-ing increased aluminum (Al) concentrations in these upland forests can be detrimental to the survival of many species of aquatic biota such as brook trout for up to 2–3 years after harvesting (Baldigo et al., 2005). Elevated Ca2+concentrations in stream water can
per-sist for more than a decade after harvesting is completed (Bailey et al., 2003). Changes in stream and soil chemistry that result from harvesting are of concern not only because of potential effects on aquatic ecosystems, but also because the Catskill Mountain region that is the focus of the current study shows evidence of soil Ca2+
depletion, which can slow regeneration and harm sugar maple (Acer saccharum) stands (Wilmot et al., 1995; Long et al., 1997; Lawrence et al., 1999).
Partial harvests offer a means of decreasing the effects of vege-tation removal on soil and stream chemistry relative to those that follow clearcutting; however, results indicate that the response of stream chemistry to partial harvests can vary widely (Martin and Pierce, 1980; Gilliam et al., 2004) because a diversity of partial har-vesting strategies have been deployed in a wide variety of forest types and climatic settings (Martin et al., 2000; Thompson and Pitt, 2003; Lee et al., 2004; LaPointe et al., 2006). Often, harvests of less than 20% biomass removal, such as a pre-commercial thinning, result in little change in soil-water chemistry, stream chemistry, or aquatic biota (Briggs et al., 2000; Baldigo et al., 2005). In con-trast, moderate cuts that remove half or more of tree biomass can result in large changes in water chemistry (Martin and Pierce, 1980; Tremblay et al., 2008). These study results suggest that the rela-tion between harvest intensity and nutrient export is not linear; a threshold of harvest intensity may exist below which only small increases in nutrient export occur (Knight et al., 1991; Prescott, 1997). However, few studies have identified a clear threshold where the relation between harvest intensity and the response variable changes sharply.
A previous study of harvesting effects in a northern hardwood forest in the Catskill Mountains of southeastern New York found that there was a non-linear relation between changes in stream chemistry and timber harvest levels (Wang et al., 2006). Addition-ally, the return of stream chemistry to reference levels was more rapid for the 40% harvest than for a previous clearcut. The decreased changes and shortened recovery time of stream chemistry follow-ing this partial harvest were attributed to a rapid expansion of the canopy crown into post-harvest gaps (Wang et al., 2006). Other studies support the governing role of harvesting-induced canopy gaps through direct storage of nutrients as well as through indirect effects of reduced litterfall on soil microbial N-cycling processes (Parsons et al., 1994; Prescott, 2002).
The study described in this paper was implemented on a model forest designed to demonstrate environmentally sustainable har-vesting practices at the Frost Valley YMCA in the Catskill Mountains, New York, USA, providing an opportunity to readily link the research described here with outreach and education activities for foresters and land owners. Three forest harvests of varying intensity were completed to identify whether changes in soil–water chem-istry, stream chemchem-istry, and indices of soil N availability showed evidence of a level above which the relation between concentra-tions and forest harvest intensity changed. The results of this study are also placed within the context of data from two nearby harvests: (1) a 40% harvest as previously discussed byWang et al. (2006)and (2) a clearcut previously described byBurns and Murdoch (2005)
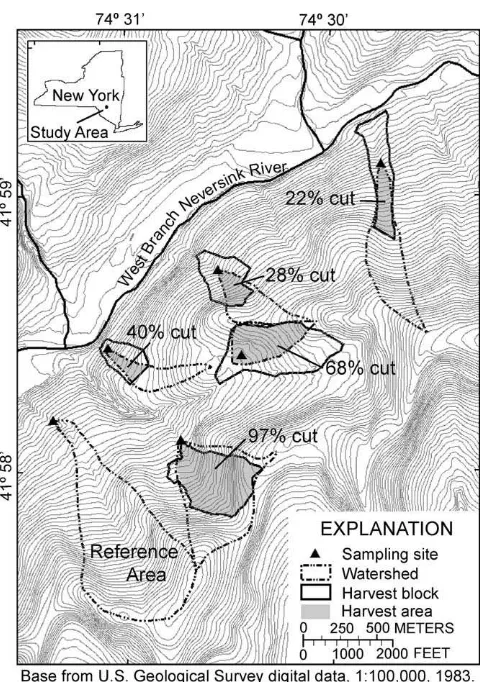
Fig. 1.Map of the study area showing study watersheds, harvest blocks, the portions of study watersheds which were harvested, and surface water sampling sites.
andMcHale et al. (2007). Including data from these previous inves-tigations allowed us to explore the effects of harvesting on soil and stream chemistry in this region for a range of harvesting intensities from unharvested to clearcut conditions.
2. Study area
The study area consisted of a 48-ha reference watershed and three timber harvest blocks located in the Frost Valley Model For-est: the 8.9-ha FV-N, the 10.5-ha FV-G, and the 22.7-ha FV-R harvest blocks (Fig. 1). The Frost Valley Model Forest is located in the headwaters of the Neversink River basin in the Catskill Moun-tains of southeastern New York. The watersheds delineated in
Fig. 1may not represent the actual area that drains to the sam-pling points. Subsurface runoff in the unharvested upper portions of the delineated watersheds may exit the watersheds via shallow bedrock fractures as previously discussed byBurns et al. (1998)for the Catskills. Field observations indicated greater stream flow in the 28% harvested area (watershed area 10.1 ha) than in the 22% harvested area (watershed area 17.8 ha). Additionally, field obser-vations indicated that the stream channels did not form until well within the harvested area, generally 100–200 m above the sampling point.
The climate is humid continental with a mean annual air temperature of 5.2◦C and mean annual precipitation of 161 cm
Table 1
Pre- and post-harvest stand density statistics for each harvest block.
Block Basal area
FV-R 30 107 1329 12.9 245
FV-G 29 100 1250 12.7 254
FV-N30 104 1294 11.9 284
Post-harvest
FV-R 10 30 106 33.0 111
FV-G 21 72 911 13.0 180
FV-N23 84 921 12.4 227
aDefined as the fraction of growing space occupied by trees.
N deposition of 8.12 kg N ha−1year−1 and sulfur (S) deposition
of 8.82 kg S ha−1year−1 during 2007–2008 as determined from
data collected at the Biscuit Brook National Atmospheric Deposi-tion Program site and the Claryville Clean Air Status and Trends network site ((http://www.epa.gov/castnet/sites/cat175.html, accessed 12/06/10).
Soils in the area are developed from glacial till on steep slopes and are predominately medium textured, well drained Incepti-sols of the Arnot-Oquaga-Lackawanna association (Tornes, 1979) with O horizons ranging in thickness from 3 to 6 cm (Burns and Murdoch, 2005). Total soil thickness ranges from 0 to 1 m; in
a nearby catchment mean thickness is 0.33 m (Johnson et al.,
2000). These poorly buffered soils are naturally acidic, and have become more acidic in recent decades through base cation deple-tion due to the high rates of acidic deposideple-tion (Lawrence et al., 1999).
The forest overstory within the study area is dominated by
northern hardwoods including sugar maple, red maple (Acer
rubrum), American beech (Fagus grandifolia) and yellow birch (Betula alleghaniensis), with small numbers of eastern hemlock (Tsuga Canadensis).
3. Methods
3.1. Forest harvesting
The harvest blocks shared similar pre-harvest stand density traits of basal area, relative density, and stems per hectare. Relative stem density is defined as the fraction of growing space occupied by trees (USDA Forest Service, 1984). Overall above-ground biomass averaged just over 250 tons per hectare prior to silvicultural activ-ities. However, in terms of acceptable growing stock (ability to produce saw logs now and into the future), block FV-R was stocked with much higher quality stems, notably sugar maple and black cherry (Prunus serotina). Pre- and post-harvest stand statistics are shown inTable 1.
Block FV-R received a shelterwood regeneration harvest, reduc-ing the basal area and relative density by 68%. The residual stand is dominated by high quality saw timber-sized seed trees at a 10-m spacing, which provides plentiful light for seedling establishment. Blocks FV-G and FV-N had been high-graded (harvested for high quality timber only) in the past, creating low quality uneven-aged stands. The silvicultural goal for these two blocks was to use the single tree selection method to simultaneously balance the distri-bution of the age classes and improve the quality of the residual stocking. The 22% reduction in basal area for FV-N was within the desired target harvest range; however, unfavorable markets for low quality roundwood resulted in a lower intensity harvest (28%) in FV-G than the prescribed 40% reduction in basal area. The timing of the harvests, block area, and percent basal area
removed are given inTable 2. This table also shows the percent of pre-harvest basal area of the three dominant northern hardwood species.
Block FV-A was harvested in 2002 as part of a previous inves-tigation (Wang et al., 2006), and is discussed in the current paper. This block is forested with northern hardwoods similar to the other forest blocks described here with pre-harvest and post-harvest basal areas of 31.7 m2ha−1and 21.4 m2ha−1, respectively,
indicat-ing removal of 33% of basal area from the watershed that drains the site. However, this harvest removed 40% of tree basal area from the lower part of the harvest block closest to and surrounding the stream with no harvest in the upper parts of the watershed. Assuming that outlying areas furthest removed from the stream contribute minimally to stream chemistry because of deep losses through fractured bedrock combined with the fact that subsurface flow from upper areas had to pass through the harvest-impacted soils (and would be expected to acquire the 40% harvest chemical signature) down gradient and surrounding the stream, we consider the stream in Block FV-A to have responded as though 40% of basal area was removed from its watershed.
3.2. Surface water
Stream water samples were collected bi-weekly from streams that drained each of the three harvest blocks and the reference watershed. Generally, 4 or 5 storms were sampled annually with automated samplers in the harvest blocks, and varying numbers of samples were analyzed per storm depending on the mag-nitude of the discharge. Storm sampling was not conducted in the reference watershed. The samples were collected in 500 mL polyethylene bottles and stored on ice during transport to the lab-oratory. Storm samples were collected by automated samplers in 500 mL polyethylene bottles that were generally retrieved within 2–3 days after collection.
3.3. Soil water
Soil water samples were collected monthly from March through November and every 6–8 weeks during the winter when weather conditions permitted. Samples were collected from six locations per harvest block and nearby reference locations along an eleva-tion gradient using zero-tension lysimeters installed horizontally in the B horizon beneath the root zone at a depth of 0.15–0.25 m. The samplers consisted of 50 cm long pvc tubes with a diameter of 5 cm, with 0.5 mm openings spaced 5 mm apart on half the cir-cumference of the tube, and sealed on one end. Two of these tubes were connected to a collection unit by tubing with an additional tube from the collection unit to the surface.
Table 2
Table 3
Significance of differences in pre-harvest and post-harvest concentrations of Alim, Ca2+, and NO3−-N in stream water and soil water, and between reference and post-harvest concentrations of NH4+and NO3−-N in O horizon soils.
Harvest intensity Stream water Soil water O horizon soils
Alim Ca2+ NO3−-N Alim Ca2+ NO3−-N NH4+ NO3−-N
22% ** ns * ns ns ns ** **
28% ns ** ** ns ns ns ** **
68% ** ** ** ** ** ** ** **
ns = no significant difference.
*p< 0.05. **p< 0.005.
3.4. Soil N
Inorganic nitrogen was measured in soil samples using a potas-sium chloride (2 M KCl) extraction method (Bremner, 1965). Thirty samples that represented the combined Oe + Oa horizons were col-lected 4–6 times per year during the snow-free months in each harvest block with an additional 30 samples collected from a nearby reference area. The samples were collected from evenly distributed locations throughout the harvest blocks and reference area. Before each field trip, 30 mL of KCl was placed in each of thirty 250 mL polyethylene bottles per block, which were then weighed. While in the field, approximately 5 g of O horizon soil was placed in each
bottle, and the bottle was capped and shaken vigorously. Approx-imately 1 kg of soil was also placed in a clean plastic bag and sealed for later soil moisture and loss on ignition analysis. Bot-tles were kept on ice until returned to the laboratory where they were refrigerated. Approximately 18 h after sampling, the bottles were weighed again, shaken, and the solution poured off and fil-tered through a glass fiber filter (GF/F). The filtrate was then stored frozen until analyzed.
Samples for soil moisture analysis were stored in sealed plastic bags until returned to the laboratory for analysis. Approximately 5 g of soil were weighed before and after drying in an oven at 65◦C
for approximately 24 h. The oven dried soil was then placed in a
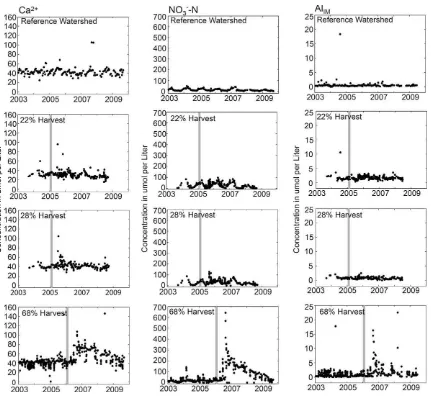
Fig. 2.Ca2+, NO
3−-N, and Alimconcentrations in stream water in reference, 22%, 28%, and 68% harvested watersheds in the Catskill Mountains of southeastern, NY. Vertical
muffle furnace at 450◦C for approximately 24 h after which it was
weighed and the loss on ignition calculated (Blume et al., 1990).
3.5. Laboratory methods
Stream water and soil water were analyzed by ion chro-matography for NO3−-N, by inductively coupled plasma-emission
spectrometry for Ca2+, by flow injection analysis for total
monomeric aluminum (Almono) and organic monomeric aluminum
(Alorg), by electrode for pH, and by a Gran titration for ANC
(Lawrence et al., 1995). Inorganic monomeric aluminum (Alim), the
fraction that is toxic to aquatic biota, was calculated by subtracting Alorgfrom Almono. KCl extracts from soils were analyzed for NO3−
-N and -NH4+by automated flow injection analysis (Lawrence et al., 1995).
3.6. Statistical methods
Comparisons of pre-harvest and post-harvest soil, soil water, and stream water chemistry were conducted using a one-tailed Wilcoxon rank sum test (Helsel and Hirsch, 1992) and results were considered significant ifp≤0.05. The pre-harvest and post-harvest
periods were defined as all data collected 18 months prior to the start of the harvests and 18 months after the harvests were com-pleted. For soil analysis, the post harvest period was defined as all data collected within 18 months after the harvest was completed. These harvests were not replicated, and thus there is a risk that the inferential statistical tests used here, while correctly identifying whether significant differences exist among the treatments, cannot identify with certainty that the observed changes were the result of the harvests. We rely here on past harvest research performed by some of the co-authors of this paper as well as researchers through-out the world that have identified responses of NO3−-N, Ca2+, and Al
to harvests and the biogeochemical processes responsible for these responses. However, the results presented in the current paper will require replication in other regions before harvesting response thresholds can be generalized.
Regression analysis was used to investigate changes in the rela-tion between harvest intensity and solute concentrarela-tions. Linear regression relations were calculated for varying harvest ranges of 0–40%, 0–68%, and 0–97%, and for each of the three stream water constituents (NO3-N, Ca2+, and Alim). Slopes and confidence
inter-vals of these regressions were compared to evaluate evidence for a change in these relations with increased harvesting intensity.
4. Results
4.1. Stream water
Mean concentrations for constituents in stream water sam-ples for the period October 1, 2003 through September 30, 2006 from the reference watershed were 0.7mol L−1 for Alim,
43.3mol L−1for Ca2+, 14.2mol L−1for NO3−-N, and 5.78 for pH.
NO3−-N concentrations showed seasonal variations typical of the
area—greater values during the dormant season and lower values during the growing season. Evidence of episodic acidification was also observed with elevated NO3−-N concentrations and decreased
ANC and pH during storm events and spring melt; these data are consistent with previous investigations that episodic acidification in streams of this region is driven largely by nitric acid (Murdoch and Stoddard, 1992). Concentrations of Alim, Ca2+, and NO3−-N
were higher during storm flow than during baseflow in the harvest blocks.
A Kruskal–Wallis test was applied to annual daily mean temper-atures and annual monthly precipitation totals for the four time periods covered by the harvests (1997, 2002, 2005, and 2006) to
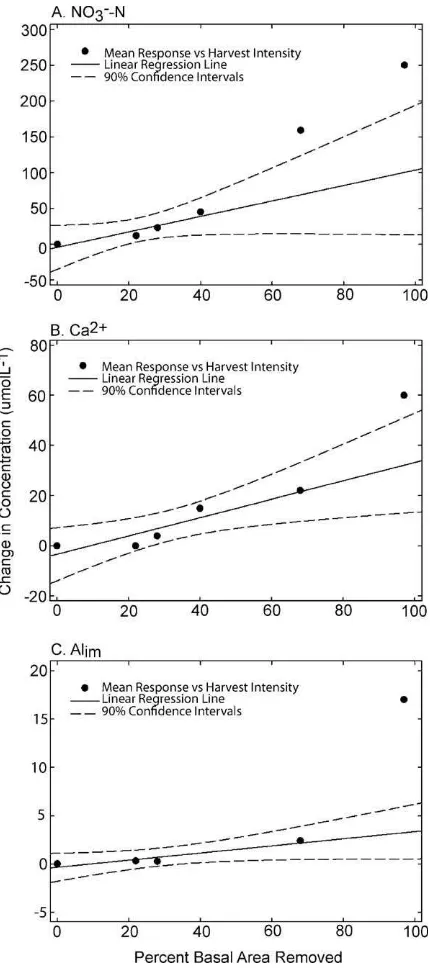
Fig. 3.Increase in mean concentrations of Alim, Ca2+, and NO3−-N in stream water
from 18 months prior to harvesting to 18 months post harvesting for the 22, 28, and 68% harvest blocks from this study and nearby 40% (Wang et al., 2006) and 97% (Burns and Murdoch, 2005) harvests. Also shown are linear regression lines and 90% confidence intervals.
investigate whether differences in climatic conditions during the periods that the harvests were conducted may have affected the results of the study. There was no significant difference (> 0.1) for the precipitation data between the four time periods. There was a significant difference for the daily mean temperatures, but the difference was minimal (1997 was cooler than the other years by approximately 1.5–2.0◦C). A Kruskal–Wallis test was also applied
to the Alim, Ca2+, and NO3−-N data from the reference stream for
the four time periods covered by the harvests. All three chemi-cal constituents were significantly higher during 1997 (p< 0.005). The differences in median values between 1997 and the later har-vests were approximately 12mol L−1 for Ca2+and 10mol L−1
for NO3−-N, while a 0.2mol L−1increase in Alimwas observed for
samples from the reference stream during 1997 may have been due to leakages of water through shallow bedrock fractures from the adjacent 97% harvest. The NO3−-N concentration timeline for the
97% harvest of 1997 given byBurns and Murdoch (2005)shows that the changes in concentrations in the reference stream appear to be coincident with changes in concentrations in the stream draining the 97% harvest.
Increases in chemical concentrations in stream water in response to the timber harvests were first evident 5 to 6 months after the harvests were completed, with peak concentrations gen-erally occurring within 1–2 months after the initial increase (Fig. 2). Concentrations of Alim, Ca2+, and NO3−-N in the 22% and 28%
har-vest blocks remained elevated for 26–28 months, while in the 68% harvest block concentrations remained elevated for 36 months. The results of comparisons between pre-harvest and post-harvest concentrations are shown inTable 3. Comparisons between the ref-erence watershed and the harvest blocks were not made due to the lack of storm sampling in the reference watershed.
The relations between changes in stream chemistry and har-vest intensity are shown inFig. 3, building on the work ofWang et al. (2006). The mean response (difference between pre-harvest period mean and post harvest period mean) of NO3−-N in stream
water to the various harvesting intensities was not linear (Fig. 3A). Above the harvesting range of 0–40% basal area removal, the mean response of NO3−-N concentrations rose sharply. The slope of the
linear regression line (r2= 0.89) for the harvests in the range of 0–40% was 1.08, indicating an increase of 1.08mol L−1of NO3−-N
for every percent increase in basal area harvest removal, whereas the slope of the linear regression line (r2= 0.94) for harvests in the range of 0–97% was 2.80, more than twice the response rate. The mean NO3−-N concentrations for the 68% and 97% harvests lie
above the 90% confidence interval for the linear regression based on the 0–40% harvest intensities, further indicating a change in response for harvests greater than 40%. A similar change in the linear relation between harvest intensity and the mean response in the 0–40% range was not evident for Alimand Ca2+as the mean
concentrations for 68% basal area removal fell within the 90% con-fidence intervals for the 0–40% regression (Fig. 3B and C). However, the relations with these constituents did show a clear change in the slope of the linear regression at a harvest intensity greater than 68%. For Alim concentrations, the linear regression slope for the
0–68% harvest range increased more than fourfold for the 0–97% range, and Ca2+ concentrations increased nearly twofold for the
same comparison of regression relations. Furthermore, the mean values for each of these constituents at a harvesting intensity of 97% were both greater than the upper limit of the 90% confidence interval for the 0–68% harvesting range.
4.2. Soil water
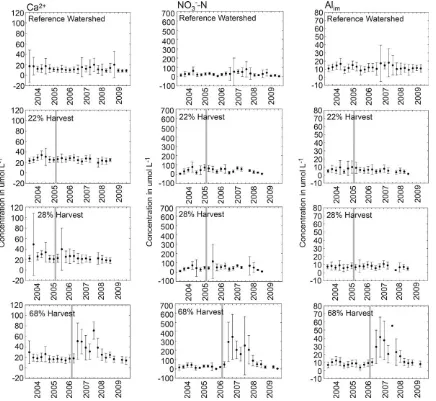
Responses in soil water chemistry were generally observed within 5–7 months of completion of the harvests (Fig. 4), with peak concentrations observed 10–20 months after completion of the harvests. The results of comparisons between pre-harvest and post-harvest concentrations are shown inTable 3. Post harvest Ca2+
and NO3−-N concentrations in soil water in the 22% and 28% harvest
blocks not only returned to pre-harvest values, but decreased below pre-harvest values 29 months after the harvests were completed. Similarly to the stream water results, Alim, Ca2+, and NO
3−-N
con-centrations in the 68% harvest block returned to pre-harvest levels 36 months after the harvest was completed.
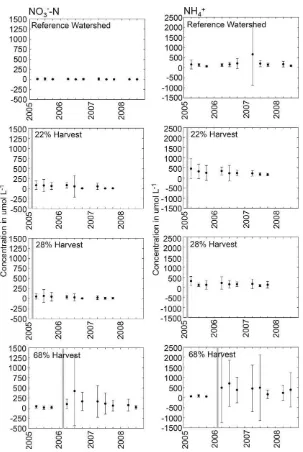
4.3. O-horizon soil nitrogen
Mean NH4+ concentrations in O-horizon soils of the
refer-ence area varied between 60 and 670 mg N kg−1 soil (Fig. 5).
The results of comparisons between the reference area and post-harvest concentrations are shown in Table 3. Mean NH4+
concentrations in O-horizon soils from the 22%, 28%, and 68% harvest blocks were all significantly greater than those of the reference area during the post harvest period (p< 0.005). The vari-ability of NH4+concentrations in the 22% harvest block decreased
14–16 months after the harvests were completed. However, the 68% harvest block NH4+concentrations had much greater
vari-ability after the harvest was completed than before. Maximum NH4+concentrations occurred 14 months after harvesting in the
22% harvest block, 4 months after harvesting in the 28% har-vest block, and 5 months after harhar-vesting in the 68% harhar-vest block.
Mean NO3−-N concentrations in O-horizon soils from the
22%, 28%, and 68% harvest blocks were all significantly greater than those of the reference area during the post harvest period (p< 0.005). The mean NO3−-N concentrations in O-horizon soils
of the reference area were below 20mol L−1 for all sampling
trips. Maximum NO3−-N values occurred 14 months after the
harvest was completed in the 22% and 28% harvest blocks and 5 months after the harvest was completed in the 68% harvest block.
5. Discussion
The responses in soil water chemistry, stream water chem-istry, and soil N availability were broadly consistent with previous harvesting studies in the Catskills, in other northern hardwood forests of northeast North America, and in forests in Europe and Asia (Hornbeck and Kropelin, 1982; Martin et al., 2000; Burns and Murdoch, 2005; Gundersen et al., 2006; Wang et al., 2006; McHale et al., 2007; Fukushima and Tokuchi, 2008). Elevated Alim, Ca2+,
and NO3−-N concentrations in streams and soil water during the
first two growing seasons after harvest are largely the result of an increased supply of NO3−-N in soils. A previous study in a nearby
clearcut in the Catskills suggested that these chemical changes are largely driven by decreased vegetation N uptake following harvest-ing, and most likely not by increased net rates of N mineralization and nitrification (Burns and Murdoch, 2005). Other factors may also contribute to increased NO3−-N availability such as NO3−-N
leach-ing from remainleach-ing slash, death and decay of roots, physical soil disturbance and mixing, and reduced litter inputs that might induce C-limitation and decreased N immobilization in microbial commu-nities (Fahey et al., 1991; Staaf and Olsson, 1994; Prescott, 2002). Several factors likely contributed to the post-harvest increases in Alim, Ca2+, and NO3−-N concentrations observed in the Catskills
such as high rates of atmospheric N deposition and resulting large soil N stores with low C:N, as well as thin, acidic soils; these soils have high rates of net nitrification even in the absence of disturbance (Dahlgren and Driscoll, 1994; Lawrence et al., 1999, 2000).
The mean NO3−-N response for the partial harvests
con-ducted in this study did not describe a linear relation between the reference watershed and the previously conducted clearcut (Fig. 3). The response increased markedly above 40% basal area removal. We recognize that results from only 5 har-vests are presented and used for the regression analysis, thus confirmation of these results from other studies is needed. Additionally, the pre- and post-harvest characteristics of these stands were not identical. For example, Block FV-R had a higher proportion of sugar maple and lower proportion of
yellow birch than Blocks FV-G and FV-N (Table 2) as well
Fig. 4.Mean seasonal concentrations of Alim, Ca2+, and NO3−-N in soil water from sets of 6 zero tension lysimeters collected every 4–6 weeks in reference, 22%, 28%, and 68%
harvested watersheds in the Catskill Mountains of southeastern, NY (vertical line represents timing of the timber harvest in each watershed, error bars 1 standard deviation, year label indicates position of winter season followed by spring, summer, and fall).
of these factors may have affected the results described herein.
An additional consideration is that only concentration results and not loads are presented here for the streams, and that increases in streamflow following forest harvesting have been documented at numerous study sites throughout the world driven largely driven by decreased transpiration (Jones and Post, 2004; Robinson and Dupeyrat, 2005). We did not calculate loads in this study, how-ever, because two of the streams (22% and 28% harvests) showed intermittent flow with evidence of water leaving the watershed via shallow bedrock fractures, and the partial harvests were conducted in limited portions of the watersheds. Although full watershed har-vests were not performed, the stream water results were similar to those obtained from soil water and soils, indicating that the unhar-vested portions of the watersheds located at the greatest distance from the streams minimally influenced the stream water results. Our expectation is that patterns of temporal change in loads as a function of harvesting intensity for Alim, Ca2+, and NO3−-N would
have been similar to the patterns we observed for changes in con-centration, but we cannot evaluate these patterns in the current study. Therefore, we used concentrations to examine the concept of harvesting thresholds above which negative effects of harvesting were measured. Additionally, slight changes in solute
concentra-tions resulting solely from changes in transpiration rates cannot be ruled out, but were unlikely to be a major driver of the concentra-tion changes we observed.
Four methods were used to explore forest harvest intensity thresholds: (1) the harvest intensity at which the relation between the mean response (the difference between pre-harvest mean and post-harvest mean concentrations of Alim, Ca2+, and NO3−-N) and
harvest intensity changed (Fig. 3); (2) the harvest intensity at which maximum concentrations in stream and soil water exceeded known biological thresholds; (3) the harvest intensity at which stream water concentrations exceeded human health criteria; and (4) the duration of elevated concentrations of Alim, Ca2+, and NO3−
-N in soils, soil water, and stream water.
The mean response in stream water NO3−-N concentration
increased substantially at harvest intensities greater than 40%. For Alimand Ca2+, the mean response was linear across the partial
har-vest intensities described in this study and byWang et al. (2006), but was relatively greater for the previous clearcut (97% basal area removal) suggesting greater increases in Alimand Ca2+
concentra-tions at harvesting intensities greater than 68%. A likely reason
why Alim did not respond in the same manner as NO3−-N can
Fig. 5.Mean seasonal concentrations of NH4+and NO3−-N in O-horizon soils from sets of 30 samples collected every 4–6 weeks in reference, 22%, 28%, and 68% harvested
watersheds in the Catskill Mountains of southeastern, NY (vertical line represents timing of the timber harvest in each watershed, error bars 1 standard deviation, year label indicates position of winter season followed by spring, summer, and fall).
the sum of acid anion concentrations (AA) exceeds the sum of base cation concentrations (BC), above which a linear relation is commonly observed (Driscoll, 1985). In these Catskill streams,
AA/BC was generally about 0.7–0.9 prior to harvesting, and
generally increased in all streams where harvest occurred because NO3−-N concentrations increased to a greater extent than those of
the base cations. The clearcut stream showed the greatest increase and had the highest mean value during the post-harvesting period (1.03) among these harvests. This increase inAA/BC resulted in an increasing response in Alimconcentrations with harvesting intensity that was proportionally greater at the greatest harvest intensity. Stream Ca2+concentrations may have shown a similar
response to those of Alimbecause exchange of Al for Ca2+in soils
tends to become dominant as soil base saturation declines in acidic soils, reflected by increased Alimconcentrations in soil solution and
nearby streams (McHale et al., 2007).
Studies have shown that brook trout experience high mortal-ity rates when exposed to stream water Alim concentrations in
the 3.7–7.4mol L−1range (Baldigo et al., 2005). Alim
concentra-tions in the 68% harvest block reached or exceeded this range on multiple occasions in the year following completion of the timber harvest.Wang et al. (2006)reported that total dissolved Al con-centrations in stream water in a 40% timber harvest exceeded a suggested mortality threshold for brook trout (Gagen and Sharpe, 1987).
The USEPA 710mol L−1 maximum allowable concentration
for drinking water for NO3−-N (10 mg L−1, USEPA, 2010) was
approached but not exceeded by the maximum observed con-centrations in the 68% harvest (642mol L−1). Total dissolved
Al concentrations exceeded the USEPA secondary drinking water standards (7.4mol L−1) in post harvest stream water of both the
22% and 68% harvest blocks.
to build in the soils and to be later flushed into lysimeters and streams. Also, the mean transit time of baseflow stream water in this region is about one year (Burns et al., 1998) indicating that hydrologic transport lags alone may in part be responsible for the lag observed from the period of harvesting to the first appearance of changes in soil water and stream water chemistry. The post-harvest elevated concentrations of Alim, Ca2+, and NO3−-N in stream and
soil water of the 22% and 28% harvests returned to pre-harvest levels approximately 2 years after the harvests were completed. Post-harvest concentrations of Alim, Ca2+, and NO3−-N in stream
and soil water of the 68% harvest remained elevated above pre-harvest levels 3 years after the pre-harvest was completed, and the elevated levels of NO3−-N in stream and soil water of the nearby
97% harvest persisted for 4 years (Burns and Murdoch, 2005). These results indicate that increasing the basal area removed during tim-ber harvests leads to increasingly prolonged periods of elevated Alim, Ca2+, and NO3−-N in stream and soil water post-harvest as
suggested previously byWang et al. (2006). We hypothesize that the faster recovery of stream chemistry in less intensive harvests may result from the rapid closure of the small canopy gaps (and con-sequent uptake of nitrogen) that form after these harvests; inverse exponential closure rates have been measured in northern hard-wood forests (Beaudet and Messier, 2002). The larger and expansive openings created by more intensive harvests and clearcuts likely require regeneration to fill gaps, a slower process.
KCL-extractable NO3−-N in soil samples showed a significant
post-harvest increase over levels found in the reference area. The responses in the 22 and 28% harvest blocks were less than in the 68% harvest block and lasted only 18 months, while the response in the 68% harvest block was approximately fourfold greater and was prolonged. The range of NH4+concentrations in soils of the harvest
blocks were mostly within the range measured in the reference area; however, greater mean post-harvest NH4+ concentrations
were noted in all of the harvest blocks relative to the reference area. These results are consistent with harvest-driven increases in the availability of NO3−-N that acidifies soils and soil solution and
mobilizes Ca2+and Al
imto local streams.
6. Conclusions
The evidence gathered during this study suggests that tim-ber harvests with a basal area removal of greater than 40–68% may lead to negative effects on the forest ecosystem. At lev-els above 40% basal area removal, the mean response of stream water NO3−-N concentrations increased substantially. Above 68%
basal area removal NO3−-N concentrations approached the USEPA
710mol L−1standard for drinking water and Alimconcentrations
exceeded a known brook trout mortality threshold and reached lev-els where root uptake of Ca2+may be impaired. The results of this
study also indicate that greater percentages of basal area removal lead to longer periods of elevated Alim, Ca2+, and NO
3−-N
concen-trations in post-harvest stream water. Soil water showed responses to the harvests that were similar to those of stream water.
A sound forest management or timber harvest plan needs to consider the long-term health of the forest ecosystem in order to assure future productivity. Soil base cation status and species composition, particularly sugar maple, are major concerns in this regard (Long et al., 2009). Maintaining soil, soil water, and stream water chemical concentrations below known ecological thresh-olds, above which negative consequences exist for the ecosystem, is also a major concern. These results suggest that limiting timber harvests in this region to a harvest intensity of less than 40–68% basal area removal will assist in maintaining the long-term viabil-ity of the forest ecosystem, reduce the risk to downstream aquatic ecosystems, and help ensure future timber productivity. The actual
percent basal area removal identified for this region may not apply to other regions. Soil type, soil chemistry, forest type, and forest health all affect the response to forest harvesting. Nonetheless, it is likely that the general conclusion of this study is transferable—that above a certain percent basal area removal there will be large increases in the mean chemical response to harvesting. However, this result awaits confirmation by other forest harvesting experi-ments in other regions throughout the globe that receive high levels of atmospheric N deposition.
Acknowledgments
The authors thank Michael R. McHale of the U.S. Geological Sur-vey, John Campbell of the U.S. Forest Service, and two anonymous reviewers for their helpful comments on earlier versions of this manuscript. The authors also thank the field and laboratory staff at the U.S. Geological Survey’s New York Water Science Center for field assistance and chemical analyses. Funding for this project was provided by the New York City Department of Environmental Protection and the U.S. Geological Survey. The cooperation of the Frost Valley YMCA, the landowner of the study sites, is also greatly appreciated.
References
Aber, J.D., Nadelhoffer, K.J., Steudler, P., Melillo, J.M., 1989. Nitrogen saturation in northern forest ecosystems. Bioscience 39, 378–386.
Bailey, S.W., Buso, D.C., Likens, G.E., 2003. Implications of sodium mass balance for interpreting the Ca2+cycle of a forested ecosystem. Ecology 84, 471–484.
Baldigo, B.P., Murdoch, P.S., Burns, D.A., 2005. Stream acidification and mortality of brook trout (Salvelinus fontinalis) in response to timber harvest in three small watersheds of the Catskill Mountains, New York, USA. Can. J. Fish. Aquat. Sci. 62, 1168–1183.
Beaudet, M., Messier, C., 2002. Variation in canopy openness and light transmission following selection cutting in northern hardwood stands: an assessment based on hemispherical photographs. Agric. For. Meteorol. 110, 217–228.
Blume, L.J., Schumacher, B.A., Schaffer, P.W., Cappo, K.A., Papp, M.L., van Remortel, R.D., Coffey, D.S., Johnson, M.G., Chaloud, D.J., 1990. Handbook of Methods for Acid Deposition Studies—Laboratory Analyses for Soil Chemistry. U.S. Environ-mental Protection Agency, EnvironEnviron-mental Monitoring Systems Laboratory, Las Vegas, Nevada, EPA/600/4-90/023 (variously paged).
Bremner, J., 1965. Nitrogen availability index. In: Black, C. (Ed.), Methods of Soil Analysis. Part 2. Amer. Soc. Agron., Madison, WI, pp. 1324–1345.
Briggs, R.D., Hornbeck, J.W., Smith, C.T., Lemin Jr., R.C., McCormack Jr., M.L., 2000. Long-term effects of forest management on nutrient cycling in spruce-fir forests. For. Ecol. Manage. 138, 285–299.
Burns, D.A., Murdoch, P.S., 2005. Effects of a clearcut on the net rates of nitrification and N mineralization in a northern hardwood forest, Catskill Mountains, New York, USA. Biogeochemistry 72, 123–146.
Burns, D.A., Murdoch, P.S., Lawrence, G.B., Michel, R.L., 1998. Effect of groundwater springs on NO3−concentrations during summer in Catskill Mountain streams.
Water Resour. Res. 34, 1987–1996.
Dahlgren, R.A., Driscoll, C.T., 1994. The effects of whole-tree clear-cutting on soil pro-cesses at the Hubbard Brook Experimental Forest, New Hampshire, USA. Plant Soil 158, 239–262.
Driscoll, C.T., 1985. Aluminum in acidic surface waters: chemistry, transport, and effects. Environ. Health Perspect. 63, 93–104.
Elliott, E.M., Kendall, C., Boyer, E.W., Burns, D.A., Wankel, S.D., Bain, D.J., Harlin, K., Butler, T.J., Carlton, R., 2007. An isotopic tracer of stationary source NOx emissions across the midwestern and northeastern United States. Environ. Sci. Technol. 41, 7661–7667.
Fahey, T.J., Stevens, P.A., Hornung, M., Rowland, P., 1991. Decomposition and nutrient release from logging residue following conventional harvest of sitka spruce in North Wales. Forestry 64, 289–301.
Fukushima, K., Tokuchi, N., 2008. Effects of forest clearcut and afforestation on streamwater chemistry in Japanese cedar (Cryptomeria japonica) forest: com-parison among watershed of various stand ages. J. Jpn. For. Soc. 90, 6–16. Gagen, C.J., Sharpe, W.E., 1987. Net sodium loss and mortality of three salmonid
species exposed to a stream acidified by atmospheric deposition. Bull. Environ. Contam. Toxicol. 39, 7–14.
Gilliam, F.S., Dick, D.A., Kerr, M.L., Adams, M.B., 2004. Effects of silvicultural practices on soil carbon and nitrogen in a nitrogen saturated central Appalachian (USA) hardwood forest ecosystem. Environ. Manage. 33 (Suppl. 1), S108–S119. Gundersen, P., Schmidt, I.K., Raulund-Rasmussen, K., 2006. Leaching of nitrate from
temperate forests—effects of air pollution and forest management. Environ. Rev. 14, 1–57.
Hornbeck, J.W., Kropelin, W., 1982. Nutrient removal and leaching from a whole-tree harvest of northern hardwoods. J. Environ. Qual. 11, 309–316.
Hornbeck, J.W., Smith, C.T., Martin, Q.W., Tritton, L.M., Pierce, R.S., 1990. Effects of intensive harvesting on nutrient capitals of three forest types in New England. For. Ecol. Manage. 30, 55–64.
Johnson, C.E., Ruiz-Méndez, J.J., Lawrence, G.B., 2000. Forest soil chemistry and ter-rain attributes in a Catskills watershed. Soil Sci. Soc. Am. J. 64, 1804–1814. Johnson, D.W., 1992. Nitrogen retention in forest soils. J. Environ. Qual. 21, 1–12. Jones, J.A., Post, D.A., 2004. Seasonal and successional streamflow response to
for-est cutting and regrowth in the northwfor-est and eastern United States. Water Resources Research 40, W05203.
Knight, D.H., Yavitt, J.B., Joyce, G.D., 1991. Water and nitrogen outflow from lodge-pole pine forest after two levels of tree mortality. For. Ecol. Manage. 46, 215–225. LaPointe, B., Bradley, R., Parsons, W., Brais, S., 2006. Nutrient and light availability to white spruce seedlings in partial and clearcut harvested aspen stands. Silva Fenn. 40, 459–471.
Lawrence, G.B., Lincoln, T.A., Horan-Ross, D.A., Olson, M.L., Waldron, L.A., 1995. Ana-lytical Methods of the US Geological Survey’s New York District Water Analysis Laboratory. US Geological Survey Open-File Report 95-416, Troy, NY, p. 96. Lawrence, G.B., David, M.B., Lovett, G.M., Murdoch, P.S., Burns, D.A., Baldigo, B.P.,
Thompson, A.W., Porter, J.H., Stoddard, J.L., 1999. Soil Ca2+ status and the
response of stream chemistry to changing acid deposition rates. Ecol. Appl. 9, 1059–1072.
Lawrence, G.B., Lovett, G.M., Baevsky, Y.H., 2000. Atmospheric deposition and water-shed nitrogen export along an elevational gradient in the Catskill Mountains, New York. Biogeochemistry 50, 21–43.
Lee, P., Smith, C., Boutin, S., 2004. Quantitative review of riparian buffer width guidelines from Canada and the United States. J. Environ. Manage. 70, 165–180.
Likens, G.E., Bormann, F.H., Johnson, N.M., 1969. Nitrification: importance to nutrient losses from a cutover forested ecosystem. Science 163, 1205–1206.
Long, R.P., Horsley, S.B., Lilja, P.R., 1997. Impact of forest liming on growth and crown vigor of sugar maple and associated hardwoods. Can. J. For. Res. 27, 1560–1573. Long, R.P., Horsely, S.B., Hallett, R.A., Baily, S.W., 2009. Sugar maple growth in rela-tion to nutrirela-tion and stress in the northeastern United States. Ecol. Appl. 19, 1454–1466.
Magnani, F., Mencuccini, M., Borghetti, M., Berbigier, P., Berninger, F., Delzon, S., Grelle, A., Hari, P., Jarvis, P.G., Kolari, P., Kowalski, A.S., Lankreijer, H., Law, B.E., Lindroth, A., Loustau, D., Manca, G., Moncrieff, J.B., Rayment, M., Tedeschi, V., Valentini, R., Grace, J., 2007. The human footprint in the carbon cycle of temper-ate and boreal forests. Nature 447, 848–850.
Martin, C.W., Pierce, R.S., 1980. Clearcutting patterns affect nitrate and calcium in streams of New Hampshire. J. Forest. 78, 268–272.
Martin, C.W., Hornbeck, J.W., Likens, G.E., Buso, D.C., 2000. Impacts of intensive har-vesting on hydrology and nutrient dynamics of northern hardwood forests. Can. J. Fish. Aquat. Sci. 57 (Suppl. 2), 19–29.
McHale, M.R., Murdoch, P.S., Burns, D.A., Lawrence, G.B., 2007. Controls on aluminum release from soils after a clearcut in southeastern New York, USA. Biogeochem-istry 84, 311–331.
Murdoch, P.S., Stoddard, J.L., 1992. The role of nitrate in the acidification of streams in the Catskill Mountains of New York. Water Resour. Res. 28, 2707–2720. Northeast Regional Climate Center, 2009. Single Station Climate Summaries.
Avail-able from:http://climod.nrcc.cornell.edu(accessed on December 1, 2009). Parsons, W.F.J., Knight, D.H., Miller, S.L., 1994. Root gap dynamics in lodgepole pine
forest: nitrogen transformations in gaps of different size. Ecol. Appl. 4, 354–362. Prescott, C.E., 1997. Effects of clearcutting and alternative silvicultural systems on rates of decomposition and nitrogen mineralization in a coastal montane conif-erous forest. For. Ecol. Manage. 95, 253–260.
Prescott, C.E., 2002. The influence of the forest canopy on nutrient cycling. Tree Physiol. 22, 1193–1200.
Reynolds, B., Robertson, W.H., Hornung, M., Stevens, P.A., 1995. Forest manipula-tion and solute producmanipula-tion: modeling the nitrogen response to clearcutting. In: Trudgill, S.T. (Ed.), Solute Modeling in Catchment Systems. John Wiley & Sons, pp. 211–233.
Robinson, M., Dupeyrat, A., 2005. Effects of commercial timber harvesting on streamflow regimes in the Plylimon catchments, mid-Wales. Hydrol. Proc. 19, 1213–1226.
Staaf, H., Olsson, B.A., 1994. Effects of slash removal and stump harvesting on soil water chemistry in a clearcutting in SW Sweden. Scand. J. For. Res. 9, 305–310. Stephen, K., Aneja, V.P., 2008. Trends in agricultural ammonia emissions and ammo-nium concentrations in precipitation over the Southeast and Midwest United States. Atmos. Environ. 42, 3238–3252.
Thompson, D.G., Pitt, D.G., 2003. A review of Canadian forest vegetation management research and practice. Ann. For. Sci. 60, 559–572.
Tornes, L.A., 1979. Soil Survey of Ulster County, New York. USDA Soil Conservation Service, Ithaca, NY.
Tremblay, Y., Rousseau, A.N., Plamondon, A.P., Lévesque, D., Prévost, M., 2008. Changes in stream water quality due to logging of the boreal forest in the Montmorency Forest, Quebec. Hydrol. Proc., doi:10.1002/hyp.7175.
U.S.D.A. Forest Service, 1984. General Technical Report NE-96-Prescribing Silvicul-tural Treatments in Hardwood Stands of the Alleghenis (Adapted for New York by R. Nyland).
U.S. Environmental Protection Agency, 2010. List of Contaminants and their Maximum Contaminant Levels. EPA 816-F-09-0004. Available from
http://www.epa.gov/safewater/contaminants/index.html (updated May, 2009; accessed January 29, 2010).
Wang, X., Burns, D.A., Yanai, R.D., Briggs, R.D., Germain, R.H., 2006. Changes in stream chemistry and nutrient export following a partial harvest in the Catskill Moun-tains, New York, USA. For. Ecol. Manage. 223, 103–112.