The implications of exoenzyme activity on microbial carbon
and nitrogen limitation in soil: a theoretical model
Joshua P. Schimel*, Michael N. Weintraub
Department of Ecology, Evolution, and Marine Biology, University of California, Santa Barbara, CA 93106, USA
Received 17 May 2002; received in revised form 22 October 2002; accepted 8 November 2002
Abstract
Traditional models of soil organic matter (SOM) decomposition are all based on first order kinetics in which the decomposition rate of a particular C pool is proportional to the size of the pool and a simple decomposition constantðdC=dt¼kCÞ:In fact, SOM decomposition is catalyzed by extracellular enzymes that are produced by microorganisms. We built a simple theoretical model to explore the behavior of the decomposition – microbial growth system when the fundamental kinetic assumption is changed from first order kinetics to exoenzymes catalyzed decompositionðdC=dt¼KC£EnzymesÞ: An analysis of the enzyme kinetics showed that there must be some mechanism to produce a non-linear response of decomposition rates to enzyme concentration—the most likely is competition for enzyme binding on solid substrates as predicted by Langmuir adsorption isotherm theory. This non-linearity also induces C limitation, regardless of the potential supply of C. The linked C and N version of the model showed that actual polymer breakdown and microbial use of the released monomers can be disconnected, and that it requires relatively little N to maintain the maximal rate of decomposition, regardless of the microbial biomass’ ability to use the breakdown products. In this model, adding a pulse of C to an N limited system increases respiration, while adding N actually decreases respiration (as C is redirected from waste respiration to microbial growth). For many years, researchers have argued that the lack of a respiratory response by soil microbes to added N indicates that they are not N limited. This model suggests that conclusion may be wrong. While total C flow may be limited by the functioning of the exoenzyme system, actual microbial growth may be N limited.
q2003 Elsevier Science Ltd. All rights reserved.
Keywords:Extracellular enzymes; Decomposition; Soil organic matter; Kinetics; Model
1. Introduction
It has long been dogma in microbiology that soil microbes are most commonly limited by carbon availability, even in organic soils where microbes live in the midst of potentially degradable C. Waksman and Stevens (1929)
stated: “The fact that the addition of available nitrogen, phosphorus, and potassium did not bring about any appreciable increase in the evolution of CO2 points
definitely to the fact that nitrogen is not a limiting factor in the activities of microo¨rganisms in peat but that the available carbon compounds are”. This logic has never been challenged; rather it has been restated and reinforced over the years (Broadbent and Norman, 1947; Alexander, 1977; Flanagan and Van Cleve, 1983; Fogg, 1988; Vance and Chapin, 2001). These results and conclusions are in contrast
to studies on N dynamics that strongly suggest that microbes in natural soils are sometimes N limited. For example, many field and lab incubation studies have shown net immobil-ization (Nadelhoffer et al., 1984; Giblin et al., 1991; Polglase et al., 1992; Wagener and Schimel, 1998), other studies have shown NO32assimilation in the presence of a
measurable NH4þ pool (Jackson et al., 1989; Hart et al.,
1994; Chen and Stark, 2000), and Schimel and Firestone (1989)showed that soil microbes use glutamine synthetase to assimilate NH4
þ
. All these constitute evidence that microbes were N limited. Even in a soil that is immobilizing N (suggesting microbial N limitation); however, adding C enhances respiration (suggesting C limitation by the traditional logic;Vance and Chapin, 2001).
Thus, there are two apparent contradictions that develop from previous studies: first, microbes appear to be C limited in the midst of plenty, and second, microbes can appear to be both C and N limited simultaneously. The normal argument to explain C limitation in organic-rich soils is that
0038-0717/03/$ - see front matterq2003 Elsevier Science Ltd. All rights reserved. doi:10.1016/S0038-0717(03)00015-4
www.elsevier.com/locate/soilbio
the low quality of soil substrates limits their availability to soil microbes, and thus, even if the organisms are not truly C limited, they are energy limited (Waksman and Stevens, 1929; Broadbent and Norman, 1947; Flanagan and Van Cleve, 1983). While this argument has been in circulation for many years, the specific physiological mechanisms involved in causing energy limitation have not been well discussed. The apparent contradiction that C based data suggests C limitation, while N based data suggests N limitation has not been discussed in the literature to our knowledge.
We believe that at least a partial resolution to both these apparent contradictions may lie in the nature of organic matter processing and our conceptual and mathematical models for describing it. Most models of soil organic matter (SOM) breakdown assume first order decomposition kinetics
dC=dt¼KCMdTd ðParton et al:; 1987Þ
In this equation, C is the size of a soil carbon pool,Ka first order rate constant, andMd andTd are reducing functions based on temperature and moisture. Each SOM pool has a single K value that defines its quality. This approach to modeling and thinking about SOM dynamics is at the heart of almost all SOM models (Van Veen et al., 1984; Parton et al., 1987; Molina et al., 1990; Chertov and Kumarov, 1997; Li, 1996; but seeParnas (1975, 1976)for an exception where decomposition is based on microbial growth), and is so thoroughly integrated in thinking about SOM dynamics that it is found in every soil biology textbook we examined (Alexander, 1977; Killham, 1994; Coleman and Crossley, 1996; Paul and Clark, 1996; Sylvia et al., 1998). The argument that grows out of this approach is that a low enough K limits C supply. Microbial biomass then grows up to the point at which the maintenance demand meets the C supply, inducing C and energy limitation. However, the simple argument that a lowKvalue induces C limitation is flawed in a fundamental mechanistic assumption. The flaw is that, biochemically, SOM decomposition is not simply first order. SOM does not break down spontaneously by itself. Rather, its breakdown is catalyzed by extracellular enzymes that are produced by microorganisms. To accurately describe the kinetics of catalyzed reactions the concentration of the catalystmustbe part of the rate equation (Roberts, 1977). The most familiar such rate equation is the Michaelis – Menton equation
dC=dt¼KEC=ðKmþCÞ ðRoberts; 1977Þ
whereK is the fundamental kinetic constant as defined by the quality of the substrate,Ethe concentration of catalyst, and Km is the half-saturation constant. The equation is
commonly simplified by assuming that E is constant, and thus can be combined with K into a Vmax term (the
maximum reaction rate, defined as KE). Under some conditions (e.g. low substrate concentrations), this relation-ship can be effectively simplified to a pseudo-first order
equation, but even in that case, the concentration of the catalyst remains part of the fundamental rate equation (Schimel, 2001). At the microbial scale, considering SOM breakdown kinetics and C supply to microbes requires considering the dynamics of the catalyst to accurately model processes (Parnas 1975, 1976; Vetter et al., 1998; Schimel, 2001). A number of authors have discussed the role of exoenzymes in controlling decomposition rates (Burns, 1982; Sinsabaugh, 1994; Sinsabaugh and Moorhead, 1994; Foreman et al., 1998; Moorhead and Sinsabaugh, 2000). However, we take those ideas further and argue that to understand the basis of microbial C and N limitation in soil, it is necessary to consider the nature of catalysis.
One can argue that if the microbes could increase their investment in exoenzymes, they could accelerate the breakdown of SOM and increase the flow of C back to the microbes, thus alleviating C limitation, regardless of the fundamental K value for organic matter breakdown. This defines the fallacy in the argument that a low K
value alone can induce C limitation. As long as catalyst concentration is a term in the reaction rate equation, recalcitrance, in terms of a low K value, cannot by itself induce C limitation.
While the rate at which SOM is processed is strongly controlled by the quality of the material (the fundamentalK
value), the extent of C limitation to the microorganisms is controlled by the dynamics of exoenzymes. The key control of C limitation becomes the ‘return on investment’ microbes get in producing exoenzymes. If that return is large, i.e. more atoms of C and more useable energy come back than went into producing the enzymes, then microbes should be able to synthesize yet more enzymes and grow rapidly on the substrate, regardless of its recalcitrance. In such a case, microbes would not be C limited. If the return on investment were negative, however, less C and energy would come back than it cost to produce the enzymes and provide basic cellular maintenance needs. If that were the only available substrate, growth would ultimately stop and the organism would starve, although it was in the midst of apparent plenty. In such a case, only if exoenzyme production were subsidized by C and energy from other substrates (e.g. root exudates) would exoenzyme production continue and the substrate be broken down. This is one of the rationales behind the concept of priming (Bingeman et al., 1953; Dalenberg and Jager, 1989); by supplying labile C it should be possible to subsidize and stimulate the breakdown of recalcitrant OM.
is induced by the behavior of the exoenzyme system, and (2) how C flow and microbial growth might behave under N limited conditions.
2. Methods
2.1. C-only model
The fundamental structure of the C-only model is shown inFig. 1. The basic concept underlying the model is that the breakdown of SOM is controlled by the activity of exoenzymes, rather than simply the concentration of SOM. This breakdown produces a pool of small dissolved organic molecules that can be taken up and used by soil microbes to provide for their needs (in order of priority):
1. exoenzyme synthesis;
2. cellular maintenance (respired as CO2);
3. biomass production.
The production of exoenzymes and cell biomass both require energy, and so some fraction of the available C pool is respired to provide that energy. The Model was created and run using Stella version 7.0.1 (High Performance Systems Inc., Hannover, N.H.). The model is constructed as a set of finite difference equations using daily time steps. The numbers of the equations match the processes shown in
Fig. 1. Each defines the amount of material transformed by that process in a single time step. Amounts of material transformed are sometimes controlled by the amount of material available in a pool.
DC¼KdSOC£EnzC ð1Þ
UC¼DOC available at the beginning of each time step
of the model run ð2Þ
EPC¼KeUC ð3Þ
ELC¼KlEnzC ð4Þ
Re¼EPCð12SUEÞ=SUE ð5Þ
Rm ¼KmBiomC ð6Þ
Rg ¼ ½UC2EPC2Re2Rmð12SUEÞ ð7Þ
where:
DC decomposition of polymeric material to produce available C
UC microbial C uptake EPC enzyme production
ELC enzyme loss and decay
Re respiration to support enzyme synthesis
Rm respiration to support maintenance energy needs Rg respiration to support growth of the microbial
biomass (Rgis not allowed to be negative.)
SOC polymeric soil organic carbon
DOC available dissolved organic C (derived from SOM breakdown)
BiomC microbial biomass
EnzC exoenzyme pool
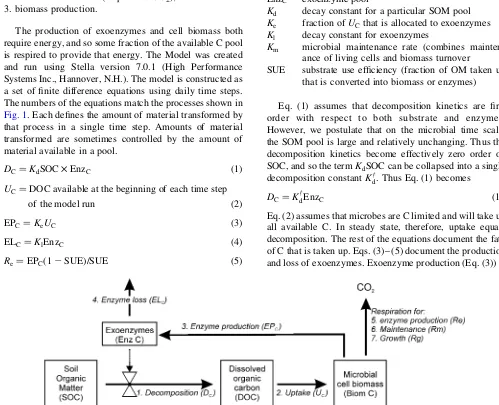
Kd decay constant for a particular SOM pool
Ke fraction ofUCthat is allocated to exoenzymes
Kl decay constant for exoenzymes
Km microbial maintenance rate (combines mainten-ance of living cells and biomass turnover
SUE substrate use efficiency (fraction of OM taken up that is converted into biomass or enzymes)
Eq. (1) assumes that decomposition kinetics are first order with respect to both substrate and enzymes. However, we postulate that on the microbial time scale, the SOM pool is large and relatively unchanging. Thus the decomposition kinetics become effectively zero order on SOC, and so the termKdSOC can be collapsed into a single decomposition constantKd†:Thus Eq. (1) becomes
DC¼Kd†EnzC ð10Þ
Eq. (2) assumes that microbes are C limited and will take up all available C. In steady state, therefore, uptake equals decomposition. The rest of the equations document the fate of C that is taken up. Eqs. (3) – (5) document the production and loss of exoenzymes. Exoenzyme production (Eq. (3)) is
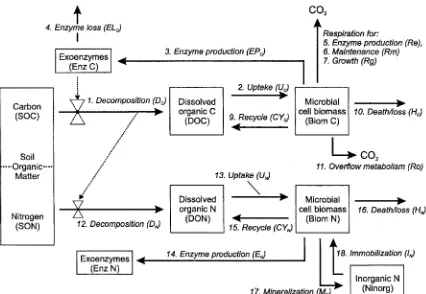
Fig. 1. Structure of the C-only model. Solid lines indicate flows of material, dashed lines connected to ‘valves’ indicate regulation points. Decomposition is a function of exoenzyme concentration and the fundamentalK†
assumed to be a constant fraction of the C taken up by microbes. A further portion of C taken up is used in respiration to fuel enzyme production (Eq. (5)). Enzyme loss (Eq. (4)) is a first order function of enzyme concentration. Since enzymes are not recycled in the model, the implicit assumption is that their major fate is humification, rather than microbial consumption. However, since they represent a small flow of C, the behavior of the model is relatively insensitive to this assumption.
Eqs. (6) and (7) define the respiration losses associated with microbial maintenance and growth. Maintenance respiration (Eq. (6)) is a first order function of microbial biomass. After all other uses of C, if there is any left over it is used for microbial growth. The respiration associated with growth is described by Eq. (7), which partitions the available C into biomass and respiration according to the SUE. Microbial growth (an increase in biomass) is not modeled by an explicit equation; rather it is the difference between C uptake and the various loss pathways
DBiomC=Dt¼UC2EPC2Re2Rm2Rg
This will be positive (net microbial growth) if C is available and maintenance needs are low, or it will be negative (net microbial death) if maintenance needs are larger than the C supply.
The challenge in relating this model quantitatively to SOM dynamics is that many of the parameters are unknown and are difficult to even estimate. For example, the size of the aggregate exoenzyme pool, its turnover time, and the actual kinetic terms for SOM breakdown are all unknown. We developed some parameters from the data on respiration and microbial biomass inVance and Chapin (2001) for their south birch soil. Other parameters were approximated from the literature, while others were assigned arbitrarily to ensure that the final respiration and microbial biomass values matched those reported byVance and Chapin (2001).
We assumed that 5% of C flow is allocated to exoenzyme production ðKe¼0:05Þ: This is based on the finding that in pure cultures of cellulytic organisms, exoenzyme production can be as high as 10 – 20% of total biomass production (Umikalson et al., 1997; Romero et al., 1999; Tholudur et al., 1999). We assumed that for the whole microbial community this value would be lower, but on the same order of magnitude. We assigned Kl a value of 0.05 d21
(5% loss of activity per day). In pure culture exoenzymes have a decay constant on the order of of 0.01 d21
(Velkovska et al., 1997), and since in the model enzyme loss includes degradation and sorption, we felt it is likely that the inactivation time would be substantially shorter. We assigned SUE a value of 0.5, which is generally consistent with measured values for carbohydrates, though it is higher than values for phenolics (Chapman and Gray, 1986; Sugai and Schimel, 1993).KmandKd†were calculated from the respiration and biomass size reported byVance and Chapin (2001). In a system where biomass is not increasing,
almost all the C respired is associated with maintenance and cell turnover. Thus, we assigned an initial value toKmequal
to the measured respiration divided by the reported biomass. Our estimated value of 0.022 d21
is within the range of values that other workers have reported (Paul and Voroney, 1980; Anderson and Domsch, 1985; Smith et al., 1986; Chapman and Gray, 1986).Kd† was calculated by initially dividing the reported respiration rate by the organic matter content of the soil, which provides an estimate ofKdEnzC:
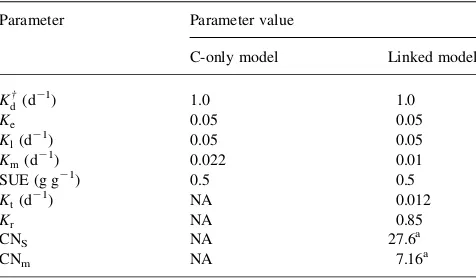
From this and an assignment of an estimated EnzC;Kdcould be estimated. The parameter values were then adjusted slightly to match the measured respiration and biomass values inVance and Chapin (2001). The full parameter set used for ‘core’ modeling is reported inTable 1.
As this is a theoretical exercise, the important questions are about the fundamental, qualitative behavior of the system. We tuned the model to match important output values to some published data to put the results into perspective, rather than to try to actually quantitatively predict the behavior of any particular ecosystem. We did sensitivity analyses on most parameters to determine the responsiveness of the model system to changes in those values. We made modifications to the specific form of some of the equations as we performed specific exper-iments with the model. These model experexper-iments are discussed later.
2.2. Linked C and N model
To link C and N required changing the control of several C flows, and it also required some changes in the structure of the C model (Fig. 2). First, we assumed that all available DOC and DON would be taken up and processed by the microbes, regardless of which element is limiting. Whichever element is in excess is released as waste; if N is in excess then it is mineralized (process 16), if C is in excess it is released as waste through ‘overflow metabolism’
Table 1
These were designed to match the data for the South Birch soil inVance and Chapin (2001). Target respiration¼0.67 mg CO2-C g21 C d21, microbial biomass¼29 mg C g21C, and the soil was mineralizing N.
(Tempest and Neijssel, 1992; process 11). Overflow metabolism occurs when microbes grow under nutrient limited conditions—they still take up C compounds, but they decouple catabolism from growth. This results in elevated respiration rates that are not associated with growth (Tempest and Neijssel, 1992; Larsson et al., 1995; Jingguo and Bakken, 1997; Gallmetzer and Burgstaller, 2001).
The second major change was to include recycling of microbial biomass C and N. In the C-only version, there is a single term for microbial maintenance that combines the maintenance of living cells with microbial turnover that involves death and regrowth. While there is a growth respiration term, that is only used fornetmicrobial growth (an actual increase in the microbial biomass). For N to limit microbial growth, there needs to be a mechanism for N to be lost from the microbial biomass. Without such a mechanism, available N would be produced from decompo-sition and would remain within the microbial biomass, ultimately saturating it with N and driving the microbes into C limitation. We therefore assume that some proportion of the maintenance component is truly maintenance of living cells (and thus involves only a C demand), while the rest results from death and regrowth (and thus involves both C and N demands). We assume that some fraction of both C and N in dying microbial biomass are recycled into
the available C and N pools, while the rest is lost.
Test of C vs:N limitation for microbial C use:
C limited if : UC
,RmþEPC=SUEþ ððUNþIN2EPC=3ÞCNm=SUEÞ ð8Þ
RgðC limitedÞ ¼ ðUC2EPC=SUE2RmÞð12SUEÞ
RgðN limitedÞ ¼ ðUNþIN2EPC=3ÞCNmð12SUEÞ=SUE ð70Þ
CYC¼KtKrBiomC ð9Þ
HC¼Ktð12KrÞBiomC ð10Þ
RoðC limitedÞ ¼0
RoðN limitedÞ ¼UC2Rm2EPC=SUE
2ðUNþIN2EPC=3ÞCNm=SUE ð11Þ
DN¼DC=CNS ð12Þ
UN¼DON available at the beginning of each time
EPN¼EPC=3
ðthe C=N ratio of protein is approximately 3Þ
ð14Þ
CYN¼CYC=CNm ð15Þ
HN¼HC=CNm ð16Þ
where
Ro respiration through overflow metabolism
DN decomposition producing available dissolved organic N
UN microbial N uptake
EPN use of N to produce exoenzymes
HC C lost to unavailable forms due to microbial death
HN N lost to unavailable forms due to microbial death CYC C recycled back to the DOC pool due to microbial
death
CYN N recycled back to the DON pool due to microbial
death
MN net mineralization
IN immobilization of available inorganic N
SON polymeric soil organic N DON available dissolved organic N BiomN microbial biomass N
EnzN exoenzyme N
Kt proportion of microbial biomass that dies in each time interval
Kr proportion of dead microbial biomass (C or N) that is available for microbial use
CNS C-to-N ratio of the SOM
CNm C-to-N ratio of the microbial biomass.
The core equation in the linked model is Eq. (8), which tests for C vs. N limitation of microbial growth. This calculates the C that would be needed to use all the available N (maintenance, enzyme production, and biomass production) and compares it to the C taken up. If C uptake is less than the C needed to use all the available N, then the microbes are C limited. We use similar equations to calculate whether mineralization or immobilization occurs
(Eqs. (17) and (18)), but these have slightly different forms than Eq. (8) to avoid circular equations, which Stella does not allow.
In this version of the model, Eqs. (1) – (6) are unchanged from the C-only version. Eq. (7) accounts for microbial growth respiration under either C or N limited equations; again the actual increase in biomass
results from C remaining in the biomass pool rather than as an explicit equation. Eqs. (9) and (10) describe microbial death, including recycling through the microbial loop (Eq. (9)) and loss of C from the microbial system (humification, grazing, etc.; Eq. (10)). Eq. (11) describes overflow metabolism; C that is taken up and cannot be used for microbial growth is respired. Eq. (14) accounts for exoenzymes as an N sink; it uses a C/N ratio for protein of 3. Eqs. (15) and (16) account for recycling microbial N through microbial death; they parallel Eqs. (9) and (10). Eq. (17) accounts for net N mineralization, if microbes are C limited, excess N is mineralized. Eq. (18) allows for exogenous sources of inorganic N; if such N is present and is needed, it will be used by microbes. The model does not calculate the loss of exoenzyme N since it plays no role in the model other than as a sink for N.
For the linked model, we started with the same core parameters as for the C-only model version. The new parameters that needed to be estimated were Kt and Kr;
while several existing parameters needed to be adjusted to tune the final output to match theVance and Chapin (2001)
south birch data on respiration rate and microbial biomass, while ensuring that it would also mineralize N (i.e. it is C limited) as reported by Vance and Chapin (2001). We assumed that half the respiration in the C model was associated with true maintenance needs for living cells, and that the other half was associated with death and regrowth. Our value of the Kt parameter (0.012) is higher than the value of 0.005 thatVan Veen et al. (1984)used for protected biomass, but it is within an order of magnitude, and could easily reflect a mix of protected and unprotected organisms.
Krwas adjusted to tune the output. The parameter values are
presented in Table 1. We experimented with the model to evaluate its response to varying substrate C/N ratios (CNs).
MN¼ UN2EPC
=32ððUC2Rm2EPC=SUEÞSUE=CNmÞ ifUC,RmþEPC=SUEþ ððUNþNinorg2EPC=3ÞCNm=SUEÞ
0 otherwise
(
ð17Þ
IN¼
ððUC2Rm2EPC=SUEÞSUE=CNmÞ þEPC=32UN ifUC ,RmþEPC=SUEþ ððUn2EPC=3ÞCNm=SUEÞ
0 otherwise
8 <
:
We ran sensitivity analyses to evaluate how the model responded to variations in the parameters.
3. Experiments and results
3.1. C-limited dynamics
3.1.1. Kinetic response to enzyme concentration
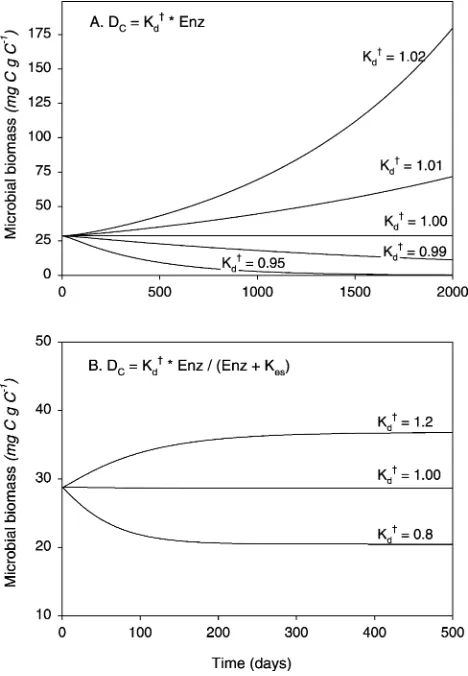
When the model is run with decomposition as a linear function of enzyme concentration, there is only a knife-edge equilibrium of stable system behavior (Fig. 3a). With aK†d
value other than exactly 1.00, the biomass ultimately either grows out of control or crashes. With aKd†.1:00;there is a net positive C supply to the microbes, fueling exoenzyme production and driving a positive feedback cycle among enzyme production, decomposition, and C flow to microbes (Fig. 3a). With other parameter sets, C flow is inadequate to sustain both microbial maintenance and exoenzyme pro-duction, in which case the system runs down (Fig. 3a).
Since fundamental chemical theory requires the catalyst concentration to be part of the rate expression, and our
simple analysis shows that a stable system cannot be constructed when the kinetics are first order on enzymes, there must be a mechanism to produce non-linear kinetics. The specific mechanism in nature remains unclear, but one must exist. A likely mechanism is that as an organism produces more enzymes that must bind to solid substrates, they must diffuse further out from the cells, the substrates must diffuse further back, and enzymes may compete with each other for binding sites (Reid, 1995). Based on both Langmuir adsorption isotherm theory that describes com-petitive binding on a surface, and from experimental data in aquatic systems (Vetter et al., 1998), we expect that the actual shape of the kinetic response should be asymptotic. While competition for binding on a solid surface has been used to model exoenzyme kinetics using the Langmuir adsorption isotherm (Vetter et al., 1998), we used an equation that only requires one unknown constant to produce an asymptotic relationship between enzyme concentration and reaction rate. The equation we used is a ‘reverse Michaelis – Menton’ equation
DC¼Kd†ðEnzC=½KesþEnzCÞ ð100Þ
where
Kes half saturation constant for enzymes on substrate;
Kes is functionally analogous to the Michaelis – Menton
Kmvalue, but is actually the reverse—there is functionally a saturating level of enzymes on the substrate, rather than a saturating level of substrates on the enzyme. We assigned
Kes a value of 0.3 mg C g21
soil; this was the most completely arbitrary assignment of a parameter value in the model. Total extractable protein concentrations in soil can be on the order of 1 – 2 mg protein C g21
C (McClaugherty and Linkins, 1988), and in a stable C limited system, we hypothesized thatKeswould have to be
substantially below this value. All further model exper-iments use the non-linear kinetics version of the model.
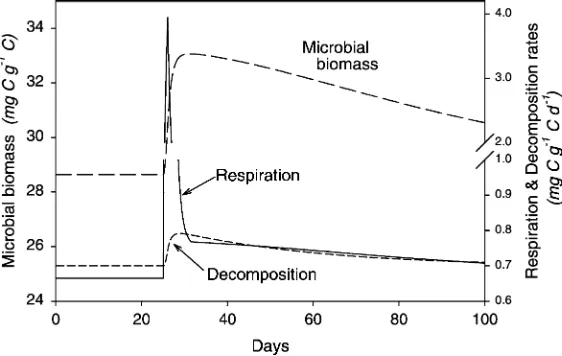
When decomposition is made a non-linear function of enzyme concentration, the model becomes stable (Fig. 3b). In this case, if the balance of parameters initially provides a positive C balance, biomass increases and extra enzymes are produced. However, as the enzyme pool increases, the activity per unit enzyme decreases, causing the total decomposition activity to increase more slowly than do biomass and maintenance requirements. Ultimately, therefore, because of the saturating effect of the enzyme kinetics, the system reaches some maximal state, where biomass is constant, the rate of C flow from SOC to microbes is constant, and respiration is constant. Regardless of the actual amount of C potentially available as SOM, the microbial population becomes C limited.
This experiment used an approach to producing non-linear dynamics in the functioning of the enzyme system
that is documented in the literature and that follows from basic theory of enzyme action on solid substrates (Vetter et al., 1998). However, we also tried two other approaches to making the system non-linear: introducing end-product inhibition of enzyme production and making enzyme breakdown a quadratic function of enzyme concentration. Both of these approaches also produced a system in which biomass is stable and C-limited (data not shown). Some mechanism to produce non-linear enzyme kinetics appears critical in the overall functioning of the decompo-sition system. The one enzyme-based decompodecompo-sition model we are aware of (Sinsabaugh and Moorhead, 1994) models decomposition solely as a first order function of enzyme concentration. These results suggest that assumption should be modified.
In a linear kinetics version of the C-only model version, the key determinant of C flow, and thus of microbial biomass, is the ratio ofKd†=Kl:This essentially defines the
amount of substrate processed over the lifetime of an enzyme. If this ratio is high, then the return from an exoenzyme will be large. If, however, that ratio is low, then microbes will be C starved and biomass levels will decline. In the non-linear model, however, the relationship between
Kd†;Kl;decomposition, and biomass becomes more complex mathematically, but the basic concept of the relationships remains the same. The important control over C limitation is the lifetime C-supply by an enzyme (the total return on a microbe’s investment).
3.1.2. Response to added available C
To demonstrate that the biomass is, in fact, C limited under equilibrium conditions, and to simulate the effect of adding labile C to the available C pool (DOC), we ran the non-linear enzyme kinetics version model until the system stabilized, added a single pulse of 10 mg of C to the DOC pool, and then ran the model until it returned to equilibrium values. To create a single C pulse in Stella, we used a pair of
‘conveyors’ in series that feed into the DOC pool. One conveyor contains the C pulse in the first ‘slot’; it feeds into the second conveyor that is initially empty, but is programmed with the desired transit time to supply the C pulse to DOC at the desired time.
The results of this model experiment are shown inFig. 4. When a pulse of available C is added to the system, microbes rapidly take it up and metabolize it, producing new biomass and increasing respiration to support growth. Total soil respiration spikes sharply because the added C is consumed immediately to fuel microbial growth. There is also a priming phenomenon, as a fraction of the C taken up is also used to make additional enzymes, stimulating decomposition. After the initial pulse, respiration declines slowly back toward the baseline value. The additional enzymes are slowly inactivated, and the larger biomass has an elevated maintenance demand. The C flow from the exoenzyme system is inadequate to meet the increased demand, so biomass is C-starved and slowly declines. Maintenance respiration declines in step with the reduction in biomass. Until the enzyme and biomass pools return to their equilibrium values, respiration remains somewhat elevated. Integrating the respiration curve and subtracting the equilibrium respiration indicates that an additional 2.25 mg C or 18% of the total respiration was due to the priming effect of additional enzyme synthesis. The specific amount of extra C produced by priming varies with the size of the C addition, but remains in the range of 15 – 20% (data not shown). An increase in microbial biomass with C addition is an additional illustration that the model does generate a C limited biomass, even though SOC is infinitely available.
3.1.3. Response to varying amounts of SOM
To demonstrate that the response of the model to variable SOC values, we modified the model to make decomposition a first order function of SOM concentrations, so that
the decomposition equation is
DC¼KdðEnzC=½KesþEnzCÞSOC ð1000Þ
We also added an input term to SOC that is equal to decomposition in each time step, so that the SOC pool does not vary over the model run. To adjust the model so that it would match the data from Vance and Chapin (2001) for south birch, we used aKdvalue of 0.001. When the size of the SOC pool is set to 414 mg C g21
soil, this matches the published values per gram soil. We made theKes term a linear function of SOC content. Since this term represents the competition by enzymes for substrate, it must be a function of the substrate concentration. We then ran the model at a range of SOC levels from 1 to 500 mg C g21
soil. Under the conditions of this model experiment, microbial biomass varied linearly with SOC concentration, and biomass remained a constant fraction of the SOC pool size (2.86%) over a range of SOC from 1 to 500 mg C g21
soil (data not shown).
3.1.4. Changing C allocation priorities to fulfill maintenance needs before producing exoenzymes
The core model assumes that exoenzyme production is the first priority in C flow, even before meeting cellular maintenance needs. We experimented with the model by changing that allocation priority. We changed Eq. (3) so that maintenance needs would be met before any C is allocated to enzyme production
EPC¼Ke†ðUC2RmÞ ð30Þ
In this caseKe†becomes the fraction of the C taken up after maintenance needs are met that is allocated to enzyme production. K†e necessarily has a higher value than Ke:
Having made that change, we then explored the behavior of the system with a range of different parameters forKe;Kl;
andKes:
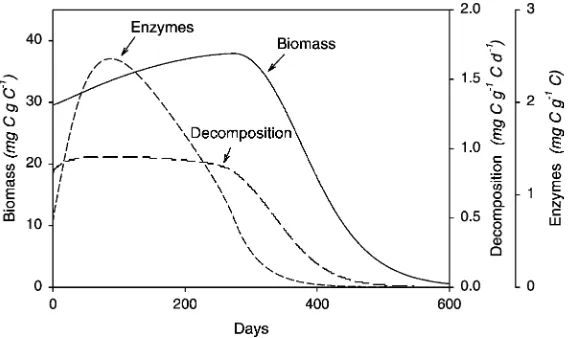
When maintenance is the first C allocation priority, the model is highly unstable and the system always crashes, very quickly with the core parameters, more slowly when enzyme lifetime is extended (Fig. 5). In all cases where any microbial growth is possible, biomass increases until all available C is consumed to supply maintenance require-ments for the microbial biomass. At that point, allocation to exoenzyme production decreases to zero, decomposition begins to decrease, the microbial population starves, and the system crashes. An implication of this result is that exoenzyme production ought to be either constitutive or induced under conditions of low substrate availability. In fact, this is the pattern that has been observed in pure culture studies. Both cellulolytic (Romero et al., 1999; Tholudur et al., 1999; Velkovska et al., 1997) and lignolytic microbes (Jeffries et al., 1981; Scheel et al., 2000; Ziegenhangen and Hofrichter, 2000) induce exoenzyme production under conditions of C limitation.
3.2. Linked C and N dynamics
3.2.1. Response to varying substrate C-to-N ratios
The second major modeling exercise we carried out was to use the linked C and N model to consider how this system’s behavior would change when N supplies are limited. If N availability is high, either from a low CNS
value or a high value ofKr(effective reuse of microbial N), the model behaves fundamentally the same as has already been described for the C-only model (data not shown). Biomass and respiration reach stable levels and the microbial biomass is limited by available C.
On the other hand, if N availability is low, from a high C-to-N ratio in SOM (CNS), then N limitation of microbial
growth results. If the parameters are such that microbes switch from C to N limitation, microbial growth and biomass are reduced, though decomposition does not
decrease. Thus, DOC is produced that microbes cannot use for biomass, and the excess material is respired through overflow metabolism (Fig. 6).
The degree of N limitation and the CNSvalue at which
N limitation is induced is sensitive to the allocation of C to enzyme production, the extent of N recycling from dead microbial biomass, and the microbial C-to-N ratio. The system is sensitive to the allocation to enzymes because enzymes are N rich relative to biomass. Thus, as the CNS value increases, enzyme synthesis becomes a
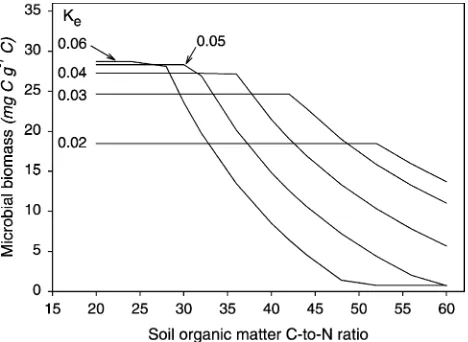
progressively greater demand on available N, and can compete with biomass production. Under C limited conditions, the greater the value of Ke (to a maximum
around 0.06), the larger the biomass (Fig. 7). However, as the C-to-N ratio of SOM increases, a high Ke diverts enough N to enzymes that biomass is reduced. Lower values ofKemaintain a larger biomass at high C-to-N ratio substrates, though at values below 0.02, decomposition rates are too low to support a substantial biomass at any CNS value. Under N limited conditions, a Ke value of
around 0.03 becomes optimum.
Increasing the recycling of dead microbial biomass (Kr) increases the microbial biomass under C limited conditions (the recycled C is also available for growth), and increases the CNS value at which N limitation results (Fig. 8). With no
recycling (Kr ¼0), microbes become N limited at a CNSvalue
of about 16. With complete recycling (Kr ¼1), N limitation can still result, due to N allocation to synthesizing N-rich enzymes (which the model does not recycle), but not until the CNSexceeds 40, without optimizingKe:At aKeof 0.03, the
CNS value that will induce N limitation rises to 66 with
complete recycling. If enzymes were recycled as well, then complete recycling would prevent N limitation from occurring at any SOM C/N ratio. The CNmratio also alters the dynamics
of microbial N limitation. Increasing the CNm from 7.16
(Table 1) to 10 increases the CNSat which N limitation starts
by 2–4 units, depending on the value ofKr(data not shown).
3.2.2. Response of an N limited system to C and N additions
We used the linked C and N version of the model for this experiment with a CNSof 36. To determine the effect of C
and N additions on soil respiration, we created a variable
Fig. 6. Microbial biomass, C waste generation through overflow metabolism, and net mineralization as a function of SOM C/N ratio in the linked model.
Fig. 7. Sensitivity analysis of the linked C and N model to varying allocation to exoenzyme production (Ke) as a function of SOM C/N ratio.
‘total respiration’ that was the sum of respiration for maintenance, enzyme synthesis, growth, and overflow metabolism. After allowing the system to reach equilibrium, we introduced either 3 mg C into the DOC pool or 100mg N into the DON pool. The model was then run until it returned to equilibrium.
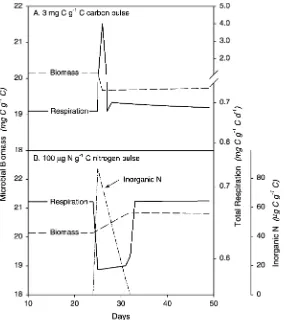
Adding C and N in the model when microbial growth is N-limited produces somewhat counter-intuitive results. Adding DOC when the system is N limited increases overflow metabolism and thus increases total soil respiration (Fig. 9a). In this model construct, adding C to an N limited system actually decreases microbial biomass. That happens because enzyme synthesis comes before biomass growth and is a fraction of the total C uptake. Thus, adding C stimulates enzyme synthesis and creates a drain on available N. We believe that this result is unlikely in reality, and that adding available C (e.g. glucose) to N limited microbes would not stimulate enzyme production. Thus adding C would likely not divert N away from biomass and thus would simply not affect microbial biomass, though the C would still be respired. Adding N to an N limited system, however, causes a decrease in total respiration (Fig. 9b). This odd result occurs because adding N alleviates N limitation, which
allows microbes to divert C from overflow metabolism into producing microbial biomass. Exoenzyme dynamics control the rate of supply of DOC, N availability controls its fate (Jingguo and Bakken, 1997).
Traditional logic predicts that respiration should increase only when the limiting element is added. Therefore traditional logic suggests that if N is limiting, adding N should increase respiration, while adding C should not. The model, however, predicts the exact opposite response: adding C increases respiration, while adding N reduces it. The changes in biomass with C and N additions, however, do follow intuitive logic as adding N increases biomass while adding C does not. The magnitude of biomass increase with added N, however, is limited by the flow of C (which is controlled by the exoenzyme system) and the rate of microbial turnover. The increase in biomass might be difficult to measure using techniques such as chloroform fumigation that are relatively insensitive to moderate changes in biomass. If the model of Van Veen et al. (1984)is correct and the death rate of unprotected biomass is as high as 70% d21
, then the biomass increase might be dissipated quickly enough that it would not be measurable. This would, however, increase respiration, and so leave no measurable overall effect.
Fig. 9. Effect of C and N pulses on microbial biomass and respiration in the linked C and N model. (A) The effect of a 3 mg C g21C pulse added to the DOC pool on day 25. (B) The effect of a 100mg N g21(C) N pulse added to the N
4. Discussion
4.1. C-only model
Using this model, we have examined how changing the underlying kinetic assumptions in a litter or SOM decomposition model can produce very different and perhaps counterintuitive results from those generated by traditional first order kinetic models. This alternative construct closely mimics several patterns that are commonly observed in real soils. First, studies have commonly suggested that soil microbes appear to be C limited, even in organic soils where C availability is potentially very large (Vance and Chapin, 2001). Second, microbial biomass is often a relatively constant fraction of total SOM across a very wide range of soil types (Anderson and Domsch, 1989; Wardle, 1992).
To resolve the apparent contradiction of C limitation in organic matter rich soils, discussion has usually focused on the idea of energy, rather than C limitation per se (Flanagan and Van Cleve, 1983). However, the real mechanism by which energy limitation would limit microbial growth has not been well developed, as discussion has focused solely on SOM quality. This new model, which involves only a few simple assumptions about the nature of C flow in soil addresses those issues and provides a mechanism for explaining energy limitation. There are two ways in which poor substrate may affect the flow of C to microbes and the dynamics of microbial growth. First, perhaps by definition, low quality substrates have a low value of Kd and thus decompose slowly. Additionally, however, they may generate monomers that are used by microbes with low SUE (e.g. phenolics). The model runs presented used a value of 0.5, which is generally consistent with many published values for simple sugars, but is higher than reported values for phenolic based materials (Sugai and Schimel, 1993). Thus lignins, tannins, and humics are likely to have both low Kd values and low SUE, reducing the return on investment in enzymes. This would make energy limitation to microbes easier than would be the case with carbohydrates that have higher Kd and SUE values. However, even with substrates that have lowKd and SUE values, if the active lifetime of exoenzymes is long enough, there is the potential for a positive net energy balance, thus preventing C or energy limitation. Unless exoenzymes are incapable of providing a positive return on their investment under any conditions, the saturation kinetics on exoenzyme concentrations actually appear more important in inducing energy limitation that the recalcitrance of the SOC.
That biomass is a relatively constant fraction of total SOM across a wide range of conditions (Anderson and Domsch, 1989; Wardle, 1992) is also a natural prediction of this model. The size of the biomass is a function of the relative values of the different parameters in the model. As long as they do not vary dramatically relative to one another, the microbial biomass will be a fairly constant
fraction of the organic matter pool size. While many of the parameters might be expected to vary substantially with environmental conditions, we argue that the key variables would follow the same general response to most of those environmental variables. For example, increasing tempera-ture would likely increaseKd;Kl;andKm:As long as these three parameters have the same temperature response, however, microbial biomass remains constant (data not shown). The only effect of increasing temperature is to speed up the rate at which equilibrium conditions are reached. Thus, according to this model, the common result that microbial biomass is 1 – 4% of organic matter across a wide range of conditions makes logical, mechanistic sense.
4.2. Linked C and N model
Perhaps even more interesting than the C behavior of the model is the behavior when N becomes limiting. In this case, adding C increases respiration, while adding the growth limiting element, N, actually decreases respiration. A decrease in respiration with added N has been observed in many experiments (Salonius, 1972; Foster et al., 1980; So¨derstro¨m et al., 1983; Fogg, 1988). These papers have consistently argued that this result indicates that the microbial biomass is not N limited and have postulated mechanisms by which adding inorganic N can inhibit respiration. The primary mechanisms discussed have been inhibiting lignolytic enzymes and forming more recalcitrant humic complexes (Haider et al., 1975; Fogg, 1988; Gold and Alic, 1993). While these mechanisms may well occur in nature, this model indicates that a decrease in respiration when N is added to soil or litter cannot be used to infer that the microbes are not N limited. According to our model, rather, such a result could be evidence that the microbes are, in fact, N limited.
An interesting suggestion of these results is that adding labile C to a soil should increase respiration regardless of the element limiting microbial growth. If the soils are C limited, growth respiration should increase, while if the soils are N limited, waste respiration should increase through overflow metabolism. The only way to infer which element is limiting is to analyze changes in microbial biomass, but since these are still limited by C flow, it may be difficult to measure the limited increases that might be expected when the soil microbes are N limited.
the extent of microsite N-limitation would increase with the overall C-to-N ratio of the SOM. Thus, it is possible that exoenzyme control of DOC generation may be one mechanism driving the relationship between DOC leaching and soil C-to-N ratio as reported by Aitkenhead and McDowell (2000).
These model constructs add mechanism to the standard first order decomposition models, and through this, we believe, add insight into the nature of soil enzyme and microbial dynamics. However, since some ongoing allocation to exoenzyme production appears to be essential, one could argue that enzyme production could be integrated into a single overall maintenance cost. At equilibrium, the exoenzyme pool is stable and the model predicts it should be above Kes; which together would make overall enzyme
activity insensitive to small fluctuations in the size of the enzyme pool. These are the conditions that allow the enzyme pool size to be collapsed withKdinto an aggregated K value and used in a first order decomposition model. Thus, at equilibrium, the patterns predicted by the mechanisms developed in this model may be adequately described by first order models that include microbial growth, such as that of van Veen et al. (1984).
There are a number of assumptions in the model that may not accurately represent reality. One such assumption is that enzymes are treated as an aggregate pool. In fact, there are at least three important classes of extracellular enzymes involved in decomposition: ligninases, cellulases, and proteinases. Microbes shift their allocation of C among these to balance the supply of resources returning to them— under N limited conditions proteinase production increases (Sinsabaugh and Moorhead, 1994). This would not affect any of the fundamental conclusions of the model however, since those fall out of the basic enzyme kinetics. Effectively, if microbes can increase protease activity relative to C acquiring enzymes, in the terms of our model that will reduce the effective C-to-N ratio of the substrates being processed. An additional assumption is that all excess C will be respired through overflow metabolism. In fact, it is likely that some of the C will be converted into other organic waste products, but this too should not change the fundamental behavior that adding N to an N limited microbial system should divert waste C into biomass and so reduce respiration. Other issues could be raised as well, but in each case they would only alter the quantitative result without altering the core model behavior.
4.3. Conclusions
Most SOM decomposition models assume that SOM decay is first order on the SOM pool and ignore the role of the catalyst in the reaction, though fundamental theory argues that the catalyst must be part of the kinetic expression. These models also have not dealt with polymer breakdown and microbial use of the breakdown products as distinct processes, possibly under different controls.
Despite this lack of mechanism, at the large scales of space and time that biogeochemical models operate, first order models appear to describe SOM turnover adequately, and our model supports the conclusion that under equili-brium conditions such models should reasonably describe decomposition dynamics and C flow in soil.
While first order models are clearly useful under large-scale equilibrium conditions, however, they cannot fully explain the behavior of soil C flow and microbial dynamics. Such models may not adequately describe C cycling under variable conditions where the size of the biomass and enzyme pools may vary relative to each other over time (Schimel, 2001). By more explicitly considering the role of exoenzyme catalysts in SOM decay and C flow, we have identified several important physiological and chemical mechanisms that appear to be important in controlling soil microbial dynamics. We also believe that several of the issues that are difficult to explain under traditional SOM models become clearer. For example, our model identifies a mechanism by which C and energy limitation results even when there are large amounts of potentially degradable C. C limitation in these circumstances results not from simply the recalcitrance of SOM but from the dynamics of exoenzyme production, activity, and loss.
Perhaps the greater power of our modeling approach comes in resolving contradictory evidence for microbial C and N limitation in soils. Exoenzyme-driven breakdown of SOM predicts a flow of small, dissolved organic molecules that are available for microbial use, but whose production is not under immediate microbial control. The separation of decomposition and microbial growth can explain why C flow and respiration have often not responded positively to increases in N availability, even in soils where the N dynamics suggest microbial N limitation.
We demonstrated these concepts using a simple theor-etical model with a number of arbitrary assumptions, perhaps the worst of which is to ignore inputs of simple available C (e.g. root exudates). However, we believe the core conclusions are robust. The role of exoenzymes in controlling the rate of decomposition has long been recognized. The role of exoenzymes in controlling microbial C and N availability and limitation, however, have not been well recognized. We believe that this model demonstrates the need to rethink many common conceptions and misconceptions about the nature of decomposition and C flow through the soil microbial system.
Acknowledgements
from the US National Science Foundation Bonanza Creek Long Term Ecological Research, TECO, ATLAS and Microbial Observatories Programs, and from the Andrew W. Mellon Foundation.
References
Aitkenhead, J.A., McDowell, W.H., 2000. Soil C:N ratio as a predictor of annual riverine DOC flux at local and global scales. Global Biogeochemical Cycles 14, 127– 138.
Alexander, M., 1977. Introduction to Soil Microbiology, Second ed., Wiley, New York.
Anderson, T.-H., Domsch, K.H., 1985. Determination of ecophysiological maintenance carbon requirements of soil microorganisms in a dormant state. Biology and Fertility of Soils 1, 81 – 89.
Anderson, T.-H., Domsch, K.H., 1989. Ratios of microbial biomass carbon to total organic carbon in arable soils. Soil Biology & Biochemistry 21, 471– 479.
Bingeman, C.W., Varner, J.E., Martin, W.P., 1953. The effect of the addition of organic materials on the decomposition of an organic soil. Soil Science Society of America Proceedings 17, 34 – 38.
Broadbent, F.E., Norman, A.G., 1947. Some factors affecting the availability of organic nitrogen in soil—a preliminary report. Soil Science Society of America Proceedings 11, 264– 267.
Burns, R.G., 1982. Enzyme activity in soil: location and a possible role in microbial ecology. Soil Biology & Biochemistry 14, 423– 427. Chapman, S.J., Gray, T.R.G., 1986. Importance of cryptic growth, yield
factors and maintenance energy in models of microbial growth in soil. Soil Biology & Biochemistry 18, 1 – 4.
Chen, J., Stark, J.M., 2000. Plant species effects and carbon and nitrogen cycling in a sagebrush-crested wheatgrass soil. Soil Biology & Biochemistry 32, 47 – 57.
Chertov, O.G., Komarov, A.S., 1997. SOMM: a model of soil organic matter dynamics. Ecological Modelling 94, 177 – 189.
Coleman, D.C., Crossley, D.A. Jr., 1996. Fundamentals of Soil Ecology, Academic Press, San Diego.
Dalenberg, J.W., Jager, G., 1989. Priming effect of some organic additions to14C-labelled soil. Soil Biology & Biochemistry 21, 443– 448. Flanagan, P.W., Van Cleve, K., 1983. Nutrient cycling in relation to
decomposition and organic-matter quality in taiga ecosystems. Canadian Journal of Forest Research 13, 795– 817.
Fogg, K., 1988. The effect of added nitrogen on the rate of decomposition of organic matter. Biological Review 63, 433 – 462.
Foreman, C.M., Franchini, P., Sinsabaugh, R.L., 1998. The trophic dynamics of riverine bacterioplankton: relationships among substrate availability, ectoenzyme kinetics, and growth. Limnology and Oceanography 43, 1344 – 1352.
Foster, N.W., Beauchamp, E.G., Corke, C.T., 1980. Microbial activity in a Pinus banksianalamb forest floor amended with nitrogen and carbon. Canadian Journal of Soil Science 60, 199 – 209.
Gallmetzer, M., Burgstaller, W., 2001. Citrate efflux in glucose-limited and glucose-sufficient chemostat culture of Penicillium simplicissium. Antonie van Leeuwenhoek 79, 81 – 87.
Giblin, A.E., Nadelhoffer, K.J., Shaver, G.R., Laundre, J.A., McKerrow, A.J., 1991. Biogeochemical diversity along a riverside toposequence in arctic Alaska. Ecological Monographs 61, 415 – 435.
Gold, M.H., Alic, M., 1993. Molecular biology of the lignin-degrading Basidiomycete Phanerochaete chrysosporium. Microbiological Reviews 57, 605– 622.
Haider, K., Martin, J.P., Filip, Z., 1975. In: Paul, E.A., McLaren, A.D. (Eds.), Humus Biochemistry, Soil Biochemistry, vol. 4. Marcel Dekker, New York. Hart, S.C., Nason, G.E., Myrold, D.D., Perry, D.A., 1994. Dynamics of gross nitrogen transformations in an old-growth forest: the carbon connection. Ecology 75, 880 – 891.
Jackson, L.E., Schimel, J.P., Firestone, M.K., 1989. Short-term partitioning of nitrate and ammonium between plants and microbial biomass in annual grassland. Soil Biology & Biochemistry 21, 409– 415. Jeffries, T.W., Choi, S., Kirk, T.K., 1981. Nutritional regulation of
lignin degradation by Phanerochaete chrysosporium. Applied and Environmental Microbiology 42, 290 – 296.
Jingguo, W., Bakken, L.R., 1997. Competition for nitrogen during decomposition of plant residues in soil: effect of spatial placement of N-rich and N-poor plant residues. Soil Biology & Biochemistry 29, 153 – 162.
Killham, K., 1994. Soil Ecology, Cambridge University Press, Cambridge. Larsson, C., von Stockar, U., Marison, I., Gustafsson, L., 1995. Metabolic uncoupling inSaccharomyces cerevisiae. Thermochimica Acta 251, 99 – 100.
Li, C., 1996. The DNDC model. In: Powlson, D.S., Smith, P., Smith, J.U. (Eds.), Evaluation of Soil Organic Matter Models, Springer, Berlin, pp. 263– 268.
McClaugherty, C.A., Linkins, A.E., 1988. Extractability of cellulases in forest litter and soil. Biology and Fertility of Soils 6, 322– 327. Molina, J.A.E., Hadas, A., Clapp, C.E., 1990. Computer simulation of
nitrogen turnover in soil and priming effect. Soil Biology & Biochemistry 22, 349– 353.
Moorhead, D.L., Sinsabaugh, R.L., 2000. Simulated patterns of litter decay predict patterns of extracellular enzyme activities. Applied Soil Ecology 14, 71 – 79.
Nadelhoffer, K.J., Aber, J.D., Melillo, J.M., 1984. Seasonal patterns of ammonium and nitrate uptake in nine temperate forest ecosystems. Plant and Soil 80, 321– 335.
Parnas, H., 1975. Model for decomposition of organic material by microorganisms. Soil Biology & Biochemistry 7, 161 – 169.
Parnas, H., 1976. A theoretical explanation of the priming effect based on microbial growth with two limiting substrates. Soil Biology & Biochemistry 8, 139– 144.
Parton, W.J., Schimel, D.S., Cole, C.V., Ojima, D.S., 1987. Analysis of factors controlling soil organic matter levels in Great Plains grasslands. Soil Science Society of America Journal 51, 1173– 1179.
Paul, E.A., Clark, F.E., 1996. Soil Microbiology and Biochemistry, Second ed, Academic Press, San Diego.
Paul, E.A., Voroney, R.P., 1980. Nutrient and energy flow through the soil microbial biomass. In: Elwood, D.C., Hedger, J.N., Latham, M.J., Lynch, J.M., Slater, J.H. (Eds.), Contemporary Microbial Ecology, Academic Press, London, pp. 215– 237.
Polglase, P.J., Attiwill, P.M., Adams, M.A., 1992. Nitrogen and phosphorus cycling in relation to stand age of Eucalyptus regnans F. Muell. II. N mineralization and nitrification. Plant and Soil 142, 167 – 176.
Reid, I.D., 1995. Biodegradation of lignin. Canadian Journal of Botany 73 (Supplement 1), S1011– S1018.
Roberts, D.V., 1977. Enzyme Kinetics, Cambridge University Press, Cambridge.
Romero, M.D., Aguado, J., Gonza´lez, L., Ladero, M., 1999. Cellulase production by Neurospora crassa on wheat straw. Enzyme and Microbial Technology 25, 244– 250.
Salonius, P.O., 1972. Microbiological response to fertilizer treatments in organic forest soils. Soil Science 114, 12 – 19.
Scheel, T., Ho¨fer, M., Ludwig, S., Ho¨lker, U., 2000. Differential expression of manganese peroxidase and laccase in white-rot fungi in the presence of manganese or aromatic compounds. Applied Microbiology and Biotechnology 54, 686– 691.
Schimel, J.P., 2001. Biogeochemical models: implicit vs. explicit microbiology. In: Schulze, E.D., Harrison, S.P., Heimann, M., Holland, E.A., Lloyd, J.J., Prentice, I.C., Schimel, D. (Eds.), Global Biogeochemical Cycles in the Climate System, Academic Press, New York, pp. 177 – 183.
Sinsabaugh, R.L., 1994. Enzymic analysis of microbial pattern and process. Biology and Fertility of Soils 17, 69 – 74.
Sinsabaugh, R.L., Moorhead, D.L., 1994. Resource allocation to extra-cellular enzyme production: a model for nitrogen and phosphorus control of litter decomposition. Soil Biology & Biochemistry 26, 1305– 1311.
Smith, J.L., McNeal, B.L., Cheng, H.H., Campbell, G.S., 1986. Calculation of microbial maintenance rates and net nitrogen mineralization in soil at steady-state. Soil Science Society of America Journal 50, 332 – 338. So¨derstro¨m, B., Ba˚a˚th, E., Lundgren, B., 1983. Decrease in soil microbial
activity and biomasses owing to nitrogen amendments. Canadian Journal of Microbiology 29, 1500 – 1506.
Sugai, S.F., Schimel, J.P., 1993. Decomposition and biomass incorporation of14C-labeled glucose and phenolics in taiga forest floor: effect of substrate quality, successional state, and season. Soil Biology & Biochemistry 25, 1379 – 1389.
Sylvia, D.M., Fuhrman, J.J., Hartel, P.G., Zuberer, D.A., 1998. Principles and Applications of Soil Microbiology., Prentice-Hall, Upper Saddle River.
Tempest, D.W., Neijssel, O.M., 1992. Physiological and energetic aspects of bacterial metabolite overproduction. FEMS Microbiology Letters 100, 169 – 176.
Tholudur, A., Ramirez, W.F., McMillan, J.D., 1999. Mathematical modeling and optimization of cellulase protein production using Trichoderma reeseiRL-P37. Biotechnology and Bioengineering 66, 1 – 16.
Umikalson, M.S., Ariff, A.B., Shamsuddin, Z.H., Tong, C.C., Hassan, M.A., Karim, M.I.A., 1997. Production of cellulase by a wild strain of
Chaetomium globosumusing delignified oil palm empty-fruit-bunch fibre as substrate. Applied Microbiology and Biotechnology 47, 590– 595.
Vance, E.D., Chapin, F.S. III, 2001. Substrate limitations to microbial activity in taiga forest floors. Soil Biology & Biochemistry 33, 173– 188.
Van Veen, J.A., Ladd, J.N., Frissel, M.J., 1984. Modelling C and N turnover through the microbial biomass in soil. Plant and Soil 76, 257 – 274. Velkovska, S., Marten, M.R., Ollis, D.F., 1997. Kinetic model for batch
cellulase production by Trichoderma ressei RUT C30. Journal of Biotechnology 54, 83 – 94.
Vetter, Y.A., Deming, J.W., Jumars, P.A., Krieger-Brockett, B.B., 1998. A predictive model of bacterial foraging by means of freely released extracellular enzymes. Microbial Ecology 36, 75 – 92.
Wagener, S.M., Schimel, J.P., 1998. Stratification of soil ecological processes: a study of the birch forest floor in the Alaskan taiga. Oikos 81, 63 – 74.
Waksman, S.A., Stevens, K.R., 1929. Contribution to the chemical composition of peat: V. The role of microo¨rganisms in peat formation and decomposition. Soil Science 28, 315– 340.
Wardle, D.A., 1992. A comparative assessment of factors which influence microbial biomass carbon and nitrogen levels in soil. Biological Reviews 67, 321– 358.