www.elsevier.comrlocateratmos
Short communication
Cloud drop spectra at different levels and with
respect to cloud thickness and rain
S.K. Paul
Indian Institute of Tropical Meteorology, Pune 411 008, India
Received 27 April 1999; received in revised form 23 August 1999; accepted 6 October 1999
Abstract
Ž .
Measurements on drop size were made in cumulus clouds over Pune inland region during the summer monsoon seasons. In this paper, the measurements of the cloud drop spectra made in non-raining clouds at different levels and for different thickness have been studied. Also, those on
Ž .
the days with rain and with no rain the rain being observed within the clouds have been compared. The average spectra broadened with height. The concentration of drops )50 mm
ŽN , liquid water content LWC , mean volume diameter MVD and dispersion increased withL. Ž . Ž .
Ž . Ž .
height. The concentration of drops -20mm NS and total concentration NT decreased with height. The spectra were broader, while N and NS T are smaller and the other parameters are greater for thicker clouds as compared to those for thinner. The spectra were broader, while NS
and N are smaller and the other parameters are greater on the days with rain with respect to thoseT on the days with no rain. The distributions were bimodal at higher levels, for thicker clouds and on the days with rain, while they were unimodal at lower levels, for thinner clouds and on the days with no rain. The variations of the cloud drop spectra, preceding rain, at initial stage of rain and following rain are discussed.q2000 Published by Elsevier Science B.V. All rights reserved.
Keywords: Indian clouds; Cloud drop spectra; Liquid water content
1. Introduction
A knowledge of cloud drop size distribution is important in the study of cloud physics, cloud development and rain formation. The processes which determine droplet size distribution in cumulus clouds are not completely understood although cloud
Ž .
condensation nuclei CCN spectrum and the entrainment between the cloud and the
Ž .
surrounding clear air are known to be important factors Raga and Jonas, 1993 .
Ž .
Weickmann and Aufm Kampe 1953 showed drop spectra ranging from 6 to 66 mm
diameter in fair weather cumulus and ranging from 6 to 200 mm in cumulonimbus
0169-8095r00r$ - see front matterq2000 Published by Elsevier Science B.V. All rights reserved.
Ž .
( ) S.K. PaulrAtmospheric Research 52 2000 303–314
304
Ž .
clouds. Squires 1958 obtained drop spectra 4–92mm and 4–165mm diameter in dark
Ž .
stratus and Hawaiian orographic clouds, respectively. Skhirt Tadze 1984 measured
drops in the diameter range 2–70mm by photoelectric counter in cumulus clouds over
Cuba. Cloud droplet spectra were also measured with a forward scattering spectrometer
Ž .
probe Raga and Jonas, 1993; Hallberg et al., 1997 . The growth rate of raindrops during fall depends upon the cloud type which, in turn, is determined by the vertical wind shear
ŽTakahashi, 1981 . Takahashi et al. 1989 observed that the summits of trade wind. Ž .
cumuli are regions of active raindrop growth.
The author, in an earlier paper, obtained broader droplet spectra over the Pune
Žinland region than over the Arabian sea and this was mentioned to be due to the.
Ž
presence of an industrial complex belt upwind of the experimental site at Pune Paul and .
Pillai, 1992 . Here, the author makes a comparative study of the cloud drop spectra at different levels, for different cloud thickness and on rain and non-rain situations.
2. Measurements
Measurements of drop size spectra were made in cumulus clouds from a DC-3
Ž X X .
aircraft at different levels over Pune 18832 N, 73851 E, 559 m MSL region during
different summer monsoon seasons. The experimental site near Pune is about 150 km from the nearest West Coast on the Arabian Sea. Winds are mostly westerly. The clouds over the Pune region are modified maritime. In this paper, the measurements of the spectra in cumulus clouds, 1–3 km thick, made in the years 1984, 1985 and 1986 in
Ž .
non-raining clouds at different levels 100–1000 m above cloud base and for different
Ž .
cloud thicknesses ranges of vertical extent 0.3–1.2 km and 1.4–3.0 km have been studied. Also, those measured on the days with rain and on the days with no rain in the experimental area in the years 1976, 1979 and 1980 have been compared, the
occur-Ž
rencernon-occurrence of rain being noticed visually within the clouds on board the
.
aircraft . The cloud base level was about 1400 m MSL. The measured updraftsr
down-drafts were"5 m sy1 and the lapse rate 0.4–0.6r100 m in the clouds. In general, the
samples were collected towards the center of a horizontal cross-section of the cloud that was 6–10 km. For different levels, 200 m averages were taken, as the number of samples was limited.
Ž .
A mechanical semi-automatic cloud drop sampler Srivastava and Kapoor, 1960
Ž .
containing magnesium oxide-coated glass slides effective size 4.4 cm=1.0 cm was
used for sampling the cloud drops. Each slide was exposed for 14.8 ms in the cloud at
an impact speed of 54 m sy1. The crater sizes were measured using an optical
microscope of magnification 80=and 400= for cloud drop diameters )20 mm and
Ž .
F20 mm, respectively. The exposure was made in cloud air away about 50 cm from
the aircraft. The volume of cloud sampled for each exposure was about 300 cm3. True
drop sizes were obtained from proper calibrations made earlier of the ratio of actual to
Ž .
crater size, for different cloud drop sizes, in the oxide layer 15–20 mm thick . The
Ž .
details of calibrations were reported elsewhere Paul et al., 1980 . The craters with mean
diameters 11.5–241.2 mm corresponded to cloud drops 5.7–90.0mm diameter.
Correc-Ž
.
Wong, 1952 . The collection efficiencies were 43–98% for cloud drops 4–18mm at an
air speed of 54 m sy1.
3. Results and discussion
Ž .
Microphysical parameters such as maximum size in diameter MS , total cloud drop
Ž . Ž .
concentration N , concentration of drops with diameter greater than 50T mm N ,L
Ž . Ž .
concentration of drops with diameter less than 20mm N , liquid water content LWC ,S
Ž .
mean volume diameter MVD and dispersion of drops were computed from the cloud drop size spectra. Dispersion is the ratio of the standard deviation to the arithmetic mean of the drop size distribution.
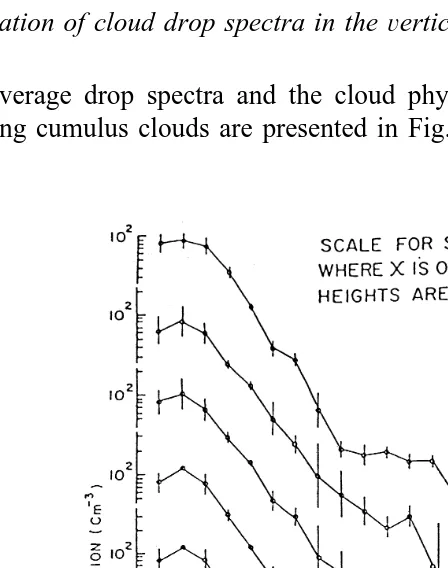
3.1. Variation of cloud drop spectra in theÕertical
The average drop spectra and the cloud physical parameters at different levels in non-raining cumulus clouds are presented in Fig. 1 and Table 1, respectively. The size
()
Microphysical parameters for the clouds at different levels and for different thicknesses The values in brackets are standard deviations. U — Unimodal, B — Bimodal.
y3 y3 y3 y3
Ž . Ž . Ž . Ž . Ž . Ž . Ž .
Cloud height a.m.s.l. m No. of samples MS mm NL cm NT cm NS cm LWC g m MVD mm Dispersion Mode
( )i Variation in theÕertical
Ž . Ž . Ž . Ž . Ž . Ž . Ž .
1540 80 34 70 0.032 0.105 314 206 306 206 0.1862 0.1174 10.9 2.3 0.51 0.14 U
Ž . Ž . Ž . Ž . Ž . Ž . Ž .
1740 50 53 75 0.058 0.144 308 193 301 193 0.1922 0.1195 10.7 1.9 0.50 0.12 U
Ž . Ž . Ž . Ž . Ž . Ž . Ž .
1910 50 48 62 0.061 0.154 287 206 278 207 0.2114 0.1515 11.7 3.2 0.53 0.13 B
Ž . Ž . Ž . Ž . Ž . Ž . Ž .
2110 70 44 80 0.084 0.227 247 198 238 199 0.1997 0.1505 12.5 3.3 0.55 0.14 B
Ž . Ž . Ž . Ž . Ž . Ž . Ž .
2380 120 18 70 0.061 0.187 287 144 280 142 0.2120 0.1049 11.3 2.0 0.54 0.13 B
( )ii Variation with cloud thickness Ž .a Higher thicknesss1369 m 296Ž .
Ž . Ž . Ž . Ž . Ž . Ž . Ž .
1983 206 58 80 0.137 0.267 236 162 227 200 0.2162 0.1165 12.7 2.7 0.56 0.15 B
Ž .b Lower thicknesss831 m 146Ž .
Ž . Ž . Ž . Ž . Ž . Ž . Ž .
spectrum usually broadened to some extent with height, the maximum size being highest Ž80mm at 2110 m. N steadily increased with height from the lowest level to 2110 m. L
and decreased at the top level. N and N steadily decreased with height from 1540 mT S
to 2110 m and increased at the top level. LWC progressively increased a little with height. MVD and dispersion increased with height, in general. These observations suggest growth of drops with height, inside the clouds, at the cost of small-sized drops
Žby condensation–coalescence process . The reduction in maximum size, N and MVD. L
Ž . Ž .
at the top level 2380 m with respect to the adjacent lower level 2110 m might be due to the mixing of dry air from above the top of the cumulus clouds and consequent evaporation of a fraction of the large-sized drops. The mixing process might well evaporate some droplets to more than others might and a modified droplet spectrum
Ž .
would result Telford et al. 1984 . The increase in NT and N at the top level withS
respect to the level just below it might be due to condensation of water vapour on the small-sized CCN particles supplied by fresh air from the top of the clouds. The entrainment of subsaturated air leads to evaporation and fresh activation or reactivation
Ž .
of CCN Pontikis and Hicks, 1993 . Usually, a decrease in droplet concentration with
Ž . Ž .
height Squires, 1958 and an increase in mean volume diameter Durbin, 1959 with height were reported. An increase in liquid water content, falling towards the cloud top,
Ž .
with height above cloud base in cumulus clouds, were observed Warner, 1955 . Raga Ž .
and Jonas 1993 observed increasing effective radii with height for small maritime Ž .
cumulus. Hicks et al. 1990 observed increase in mean radius and droplet spectral width with height in warm continental cumuli. The mean distributions were unimodal at the
Ž .
lower levels peak concentration at 7 mm diameter and bimodal at the higher levels
Žpeaks at 7mm, 42mm; 7mm, 39mm; 7mm, 48mm for 1910 m, 2110 m and 2380 m,
.
respectively . The bimodal distribution suggests growth of some drops by coalescence. The increase in dispersion with height above cloud base is partly a reflection of the
Ž .
increase in frequency of bimodal distributions with height Warner, 1969a .
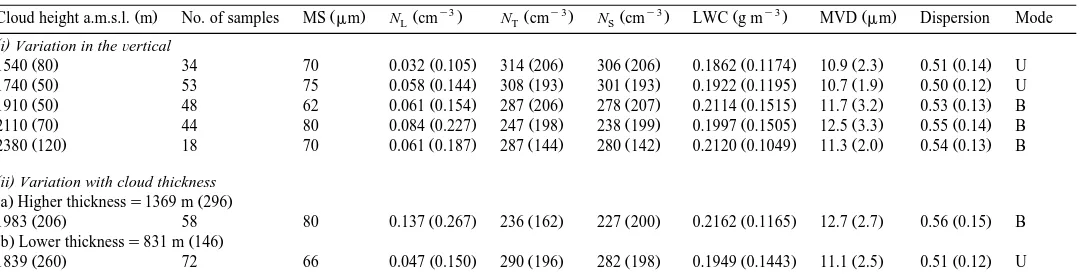
3.2. Variation of cloud drop spectra with cloud thickness
Ž The average drop spectra in non-raining cumulus clouds of higher thickness 1067–
. Ž .
2134 m and of lower thickness 305–1067 m , in the experimental area, are presented Ž in Fig. 2. The cloud physical parameters are given in Table 1. The maximum size 80
. Ž .
mm for thicker clouds was greater than that 66 mm for thinner clouds. The mean
Ž .
distributions were bimodal primary and secondary peaks at 7mm, 75mm diameter and
Ž .
unimodal peak at 7mm , respectively. N for thicker clouds was nearly three times thatL
w
for thinner clouds significant at 6% level, applying Wilcoxon–Mann Whitney test, Ž .x
Siegel 1956 . In clouds about 750–2500 ft thick, about one droplet in 1000 has a
diameter larger than 60 mm, whereas in clouds about 4000–7000 ft thick, about one
Ž .
droplet in 100 has a diameter larger than 60 mm Durbin, 1959 . The values of MVD,
Ž .
LWC and dispersion were greater significant at 0.13%, 5% and 3% levels, respectively ,
Ž .
while NT and N were smaller significant at 9% and 8% levels, respectively in theS
case of the thicker clouds as compared to those in the thinner clouds. These observations
Ž .
suggest that more number of drops grew to large size )50 mm in thicker clouds, at
( ) S.K. PaulrAtmospheric Research 52 2000 303–314
308
Fig. 2. Drop size spectra in non-raining cumulus clouds of different thicknesses.
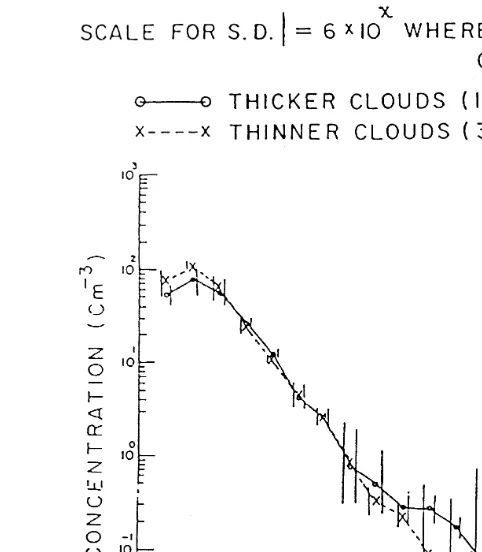
3.3. Variation of cloud drop spectra on the days with rainrno rain as obserÕed within the clouds from the aircraft
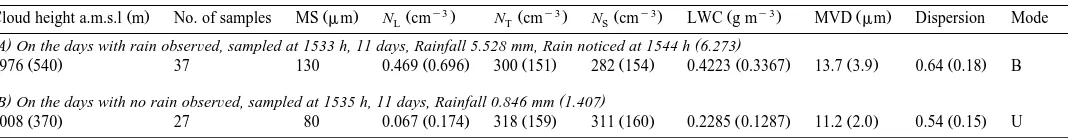
During the hours of sampling, on certain days, sometimes rain was visually noticed, on board the aircraft, within some clouds in the flight path, in the experimental area. The average drop spectra on the days with rain and with no rain as observed within the clouds are presented in Fig. 3. The corresponding parameters are given in Table 2. The
Ž . Ž .
maximum size 130mm on the days with rain was much greater than that 80mm on
Ž the days with no rain. The mean distribution in the former case was bimodal primary
.
and secondary peaks at 3mm and 10mm radius, respectively , while in the other case, it
Ž .
was unimodal peak at 3mm . Almost all maritime and some continental stratocumulus
contain bimodal populations of drops — one of cloud droplets, the other of drizzle-sized
Ž .
drops Fox and Illingworth, 1997 . On the days with rain, NL was seven times that on
Ž .
the days with no rain highly significant at 0.24% level . The values of LWC, MVD and
Ž .
dispersion were greater significant at 0.48%, 2% and 3% levels, respectively , while NT
Ž .
Fig. 3. Drop size spectra on the days with rainrno rain as observed within the clouds.
occasion, as compared to the latter. LWC were about 0.42 and 0.23 g my3 on the two
occasions. A drizzle water content larger than 0.2 g my3 near the cloud top is required if
Ž .
large drops are to form and fall against the updraft Takahashi, 1981 . The appreciably
higher concentrations of drops )50mm, much greater maximum size and significantly
higher values of LWC, MVD and dispersion indicate active growth of cloud drops on Ž
the days with rain. The relatively lower concentrations of small-sized drops and hence .
the total number of drops on the days with rain as compared to those with no rain suggest participation of small-sized drops in the growth of bigger drops. The larger drops grew by coalescence process at the cost of small-sized drops. Condensation can indirectly affect the growth rate of droplets larger than 25mm radius by enhancing the growth of the smaller droplets which are then captured more efficiently by the larger
Ž .
ones Jonas and Mason, 1974 . The formation of warm rain from cumulus clouds, 2–3 km thick, over the Hawaiian Islands was facilitated by the low concentration of cloud
Ž .
droplets Skhirt Tadze, 1984 . The correlation coefficients between the values of N andL
Ž .
those of rainfall on the days with rain, was 0.894 highly significant at 0.02% level ,
Ž .
while that on the days with no rain was 0.372 not significant .
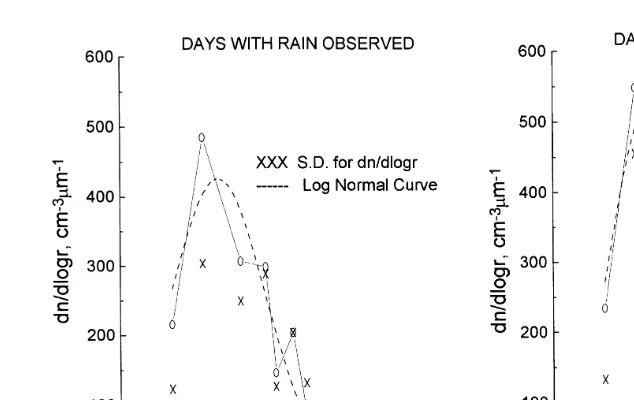
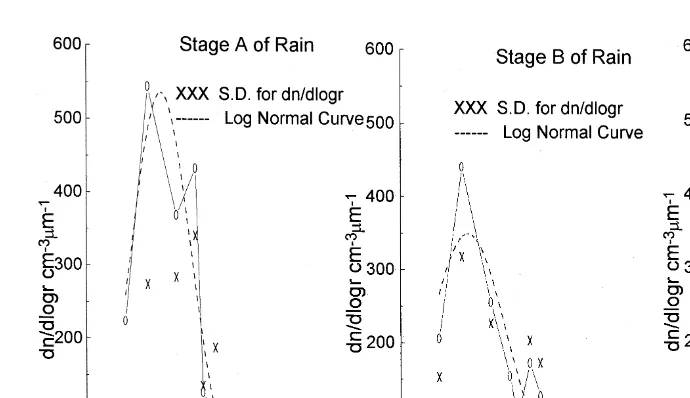
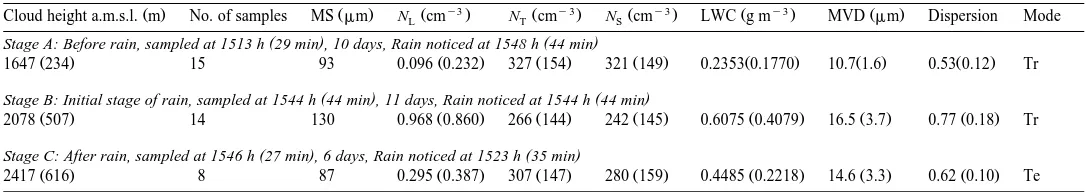
3.4. Cloud drop spectra at different stages of rain
The average cloud drop spectra, on the days with rain observed within the clouds, in
Ž .
()
S.K.
Paul
r
Atmospheric
Research
52
2000
303
–
314
310
Table 2
Cloud drop characteristics on the days with rainrno rain observed within the clouds The values in brackets are standard deviations. U — Unimodal, B — Bimodal.
Ž .
Rainfall values are the mean 24 h rainfall per raingauge total of 40 raingauges recorded at ground at 0830 h in the experimental area on the following day. Values in
Ž .
hours are the mean values I.S.T. .
y3 y3 y3 y3
Ž . Ž . Ž . Ž . Ž . Ž . Ž .
Cloud height a.m.s.l m No. of samples MS mm NL cm NT cm NS cm LWC g m MVD mm Dispersion Mode
( )A On the days with rain obserÕed, sampled at 1533 h, 11 days, Rainfall 5.528 mm, Rain noticed at 1544 h 6.273( )
Ž . Ž . Ž . Ž . Ž . Ž . Ž .
1976 540 37 130 0.469 0.696 300 151 282 154 0.4223 0.3367 13.7 3.9 0.64 0.18 B
( )B On the days with no rain obserÕed, sampled at 1535 h, 11 days, Rainfall 0.846 mm 1.407( )
Ž . Ž . Ž . Ž . Ž . Ž . Ž .
Fig. 4. Cloud drop spectra at different stages of rain.
maximum size increased much from 93mm at Stage A to 130mm at Stage B and then
decreased much to 87mm at Stage C. The mean distributions were trimodal for Stages
Ž . Ž .
A peaks at 3mm, 7mm, 13mm radius and B peaks at 3mm, 10 mm, 24mm radius
Ž .
and tetramodal for Stage C peaks at 3mm, 7mm, 10mm, 24mm radius . The values of
Ž
NL and LWC, MVD and dispersion increased much from Stage A to Stage B highly
.
significant at 0.007%, 0.1%, 0.01% and 0.03% levels, respectively and decreased much Ž
from Stage B to Stage C significant at 1% and 4% levels for N and dispersion and notL
.
significant for LWC and MVD . N and N decreased much from Stage A to Stage BS T
Žsignificant at 8% level and not significant, respectively and increased at Stage C not. Ž .
significant . These observations indicate active growth of drops just before rain or at the
Ž . Ž
beginning of rain. The concentrations of large-sized )50mm , moderate-sized 20–50
. Ž . y3
mm and small-sized -20 mm drops were 0.096, 5.9 and 321 cm , respectively,
before rain, 0.968, 23 and 242 cmy3, respectively, in the beginning of rain and 0.295, 27
and 280 cmy3, respectively, after rain. It appears that the number of large and
moderate-sized drops increased much, while that of small-sized drops reduced much just before rain started andror in the beginning of rain. Also, the large drops were mostly rained out, while the others were not at the end of rain. The concentration of small-sized drops increased again after the rain, and this might be due to fresh condensation of water
Ž .
vapour on small-sized CCN particles present in the cloudy air which were not washed out in the rain or this might be due to entrainment of subsaturated air leading to
Ž .
evaporation and fresh activation or reactivation of CCN Pontikis and Hicks, 1993 .
From Tables 1–3, it is observed that NL was higher when N and NS T were lower.
High droplet concentrations are commonly observed in clouds which contain few, if any,
Ž .
()
Cloud drop characteristics with respect to rain, on the days with rain observed The values in brackets are standard deviations. Tr — Trimodal, Te — Tetramodal.
Ž . Ž . Ž .
For B , Samples 0 to 2 min beforerafter rain noticed were considered. Values in hours are the mean values I.S.T. .
y3 y3 y3 y3
Ž . Ž . Ž . Ž . Ž . Ž . Ž .
Cloud height a.m.s.l. m No. of samples MS mm NL cm NT cm NS cm LWC g m MVD mm Dispersion Mode
( ) ( )
Stage A: Before rain, sampled at 1513 h 29 min , 10 days, Rain noticed at 1548 h 44 min
Ž . Ž . Ž . Ž . Ž . Ž . Ž .
1647 234 15 93 0.096 0.232 327 154 321 149 0.2353 0.1770 10.7 1.6 0.53 0.12 Tr
( ) ( )
Stage B: Initial stage of rain, sampled at 1544 h 44 min , 11 days, Rain noticed at 1544 h 44 min
Ž . Ž . Ž . Ž . Ž . Ž . Ž .
2078 507 14 130 0.968 0.860 266 144 242 145 0.6075 0.4079 16.5 3.7 0.77 0.18 Tr
( ) ( )
Stage C: After rain, sampled at 1546 h 27 min , 6 days, Rain noticed at 1523 h 35 min
Ž . Ž . Ž . Ž . Ž . Ž . Ž .
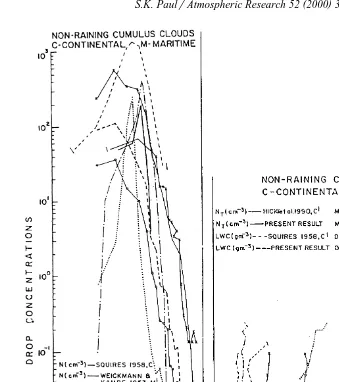
Fig. 5. A comparison of cloud drop spectra and some of the microphysical parameters obtained by various
Ž .
investigators Warner, 1969b; Paluch and Baumgardner, 1989 .
A few comparative curves showing cloud drop size distributions and vertical profiles
of N , LWC, MVD and dispersion obtained by some of the investigators are shown inT
Fig. 5.
Acknowledgements
( ) S.K. PaulrAtmospheric Research 52 2000 303–314
314
References
Durbin, W.G., 1959. Droplet sampling in cumulus clouds. Tellus 11, 202–215.
Fox, N.I., Illingworth, A.J., 1997. The retrieval of stratocumulus cloud properties by ground-based cloud radar. J. Appl. Meteorol. 36, 485–492.
Hallberg, A., Wobrock, W., Flossmann, A.I., Bower, K.N., Noone, K.J., Wiedensohler, A., Hansson, H.C., Wendisch, M., Berner, A., Kruisz, C., Laj, P., Facchini, M.C., Fuzzi, S., Arends, B.G., 1997. Microphysics of clouds : model vs measurements. Atmos. Environ. 31, 2453–2462.
Hicks, E., Pontikis, C., Rigaud, A., 1990. Entrainment and mixing processes as related to droplet growth in warm midlatitude and tropical clouds. J. Atmos. Sci. 47, 1589–1618.
Jonas, P.R., Mason, B.J., 1974. The evolution of droplet spectra by condensation and coalescence in cumulus clouds. Q. J. R. Meteorol. Soc. 100, 286–295.
Paluch, I.R., Baumgardner, D.G., 1989. Entrainment and fine-scale mixing in a continental convective cloud. J. Atmos. Sci. 46, 261–278.
Paul, S.K., Pillai, A.G., 1992. Cloud drop spectra in maritime and inland regions. Mausam 43, 415–420. Paul, S.K., Sharma, S.K., Kapoor, R.K., 1980. Calibration for studying microstructure of clouds sampled from
Ž .
an aircraft. J. Ind. Inst. Sci. 62 B , 83–88.
Pontikis, C., Hicks, E., 1993. Droplet activation as related to entrainment and mixing in warm tropical maritime clouds. J. Atmos. Sci. 50, 1888–1896.
Raga, G.B., Jonas, P.R., 1993. Microphysical and radiative properties of small cumulus clouds over the sea. Q. J. R. Meteorol. Soc. 119, 1399–1417.
Ranz, W.E., Wong, J.B., 1952. Impaction of dust and smoke particles on surface and body collectors. Ind. Eng. Chem., Ind. 44, 1371.
Siegel, S., 1956. Non-Parametric Statistics for the Behavioral Sciences. McGraw-Hill, NY, 312 pp. Skhirt Tadze, G.I., 1984. In: Concentration of cloud droplets in cumulus clouds over Cuba. Soviet
Meteorol-ogy and HydrolMeteorol-ogy 6 Allerton Press, NY, pp. 26–30, Meteorologiya i Giodrologiya.
Squires, P., 1958. The microstructure and colloidal stability of warm clouds: Part I. The relation between structure and stability. Tellus 10, 256–261.
Srivastava, R.C., Kapoor, R.K., 1960. Drop size distributions and liquid water in a winter fog at Delhi. Ind. J. Meteorol. Geophys. 11, 157–162.
Takahashi, T., 1981. Warm rain study in Hawaii — Rain initiation. J. Atmos. Sci. 38, 347–369.
Takahashi, T., Yoneyama, K., Tsubota, Y., 1989. Rain duration in Hawaiian trade wind rainbands — Aircraft observation. J. Atmos. Sci. 46, 937–955.
Telford, J.W., Keck, T.S., Chai, S.K., 1984. Entrainment at cloud tops and the droplet spectra. J. Atmos. Sci. 41, 3170–3179.
Warner, J., 1955. The water content of cumuliform cloud. Tellus 7, 449–457.
Warner, J., 1969a. The microstructure of cumulus cloud: Part I. General features of the droplet spectrum. J. Atmos. Sci. 26, 1049–1059.
Warner, J., 1969b. The microstructure of cumulus cloud: Part II. The effect on droplet size distribution of cloud nucleus spectrum and updraft velocity. J. Atmos. Sci. 26, 1272–1282.