A FAST METHOD FOR MEASURING THE SIMILARITY BETWEEN 3D MODEL AND
3D POINT CLOUD
Zongliang Zhanga, Jonathan Lia,∗,b, Xin Lic, Yangbin Lina, Shanxin Zhanga,d, Cheng Wanga
a
Fujian Key Laboratory of Sensing and Computing for Smart Cities, Xiamen University, Xiamen, FJ 361005, China [email protected];{junli, cwang}@xmu.edu.cn; [email protected]
b
Mobile Mapping Lab, Department of Geography and Environmental Management, University of Waterloo, Waterloo, ON N2L 3G1, Canada - [email protected]
cSchool of Electrical Engineering and Computer Science, Louisiana State University, Baton Rouge, LA 70803, USA
Xizang Key Laboratory of Optical Information Processing and Visualization Technology, Information Engineering College, Xizang Minzu University, Xianyang, SX 712082, China - jaysean [email protected]
Commission I/V, WG I/Va
KEY WORDS:Partial Similarity, 3D Point Cloud, 3D Mesh, Laser Scanning, 3D Object Retrieval, Weighted Hausdorff Distance
ABSTRACT:
This paper proposes a fast method for measuring the partial Similarity between 3D Model and 3D point Cloud (SimMC). It is crucial to measure SimMC for many point cloud-related applications such as 3D object retrieval and inverse procedural modelling. In our proposed method, the surface area of model and the Distance from Model to point Cloud (DistMC) are exploited as measurements to calculate SimMC. Here, DistMC is defined as the weighted distance of the distances between points sampled from model and point cloud. Similarly, Distance from point Cloud to Model (DistCM) is defined as the average distance of the distances between points in point cloud and model. In order to reduce huge computational burdens brought by calculation of DistCM in some traditional methods, we define SimMC as the ratio of weighted surface area of model to DistMC. Compared to those traditional SimMC measuring methods that are only able to measure global similarity, our method is capable of measuring partial similarity by employing distance-weighted strategy. Moreover, our method is able to be faster than other partial similarity assessment methods. We demonstrate the superiority of our method both on synthetic data and laser scanning data.
1. INTRODUCTION
Measuring the similarity between 3D geometric objects plays an important role in many 3D applications such as 3D object re-trieval (Biasotti et al., 2015) and inverse procedural modelling (Talton et al., 2011). Many methods have been proposed either for measuring the global similarity between two complete 3D ob-jects, or for measuring the partial similarity between complete 3D object and incomplete structured 3D object (Savelonas et al., 2015). However, there are a few methods proposed for measuring the Similarity between 3D Model and 3D point Cloud (SimMC) .
Measuring SimMC is becoming more and more important, as a result of easier and easier acquisition of point clouds due to the blooming of laser scanning techniques. A point cloud usually contains a large number of points. Point cloud is intrinsically in-complete and unstructured. SimMC is a special kind of partial similarity. The problem of partial similarity assessment is chal-lenging and not being well solved (Sipiran et al., 2014).
In the field of Partial 3D Object Retrieval (P3DOR), some ap-proaches have been presented for assessing the partial similar-ity in recent years. However, most of those approaches require structured data (e.g. mesh) as input (Lavou´e, 2012) (Bronstein et al., 2011). Recently, a similarity assessment method applicable on point clouds was proposed in (Savelonas et al., 2016). The method calculates similarity by combining differential fast point feature histograms with Fisher encodings.
∗Corresponding author
Although the similarity assessment methods introduced in the field of P3DOR can achieve state-of-the-art performance in terms of precison and recall, they may perform poorly in terms of speed. The size of model set used in P3DOR usually is not big. For example, the datasets used in (Savelonas et al., 2016) contain around 400 models. As a result, the time cost in P3DOR is not so important. However, in Inverse Procedural Modeling (IPM), we have to perform similarity assessment over procedural space which contains infinite models. The time cost for similarity as-sessment hence becomes critical in IPM.
In this papar, we present a fast SimMC assessment method which borrows the mean error idea from MESH (Aspert et al., 2002). However, different from MESH aiming to measure global simi-larity, in order to measure partial simisimi-larity, our method employs distance-weighted strategy to express different importance of dif-ferent parts in assessed objects. Our method is as fast as MESH which is one of the fastest global similarity assessment methods. Our method therefore is faster than exsiting partial similarity as-sessment methods to some extent.
The rest of this paper is organized as follows. Section 2 presents some related shape similarity assessment methods. Section 3 presents our distance-weighted partial similarity assessment method. Section 4 presents experimental evaluation. Section 5 presents concluding remarks.
The International Archives of the Photogrammetry, Remote Sensing and Spatial Information Sciences, Volume XLI-B1, 2016 XXIII ISPRS Congress, 12–19 July 2016, Prague, Czech Republic
This contribution has been peer-reviewed.
2. RELATED WORK
2.1 Weighted Hausdorff Distance
There are many modified Hausdorff distance measures have been proposed for different purposes in various applications. In face recognition, by assuming different regions have different impor-tance, several weighted Hausdorff distance measures have been proposed. Spatially eigen-weighted Hausdorff distance, which was proposed in (Lin et al., 2003), defines weighting function based on an eigenface which can effectively reflect the face struc-ture. Edge eigenface weighted Hausdorff distance, which was proposed in (Tan et al., 2011), defines weighted function based on the eigenface of edge images.
2.2 Partial Similarity between 3D Objects
Partial similarity assessment between 3D objects is mostly stud-ied in P3DOR which is essentially distinct from global 3D object retrieval. Persist heat signatures (Dey et al., 2010) was proposed for matching incomplete models. Bilateral map (van Kaick et al., 2013) was proposed as a local shape descriptor for partial matching. A pariwise 3D shape context for partial object retrieval was proposed in (Yu et al., 2014). A partial similarity assess-ment method based on differential fast point feature histograms and Fisher encodings was recently proposed in (Savelonas et al., 2016).
3. METHOD
We define the partial similarity between a 3D model and a 3D point cloud as the ratio of weighted surface area of the model to the weighted one-sided Hausdorff distance from the model to the point cloud.
3.1 Symmetrical Hausdorff Distance
The Symmetrical Hausdorff Distance (SHD)dsbetween two point setsAandBis defined as:
ds(A, B) = max [d(A, B), d(B, A)] (1)
whered(A, B)is One-sided Hausdorff Distance (OHD) fromA
toB:
wherek·kis Euclidean norm.
We can use SHDds(A, B)to exactly assess the global similarity between point setsAandB. AandBare identical ifds(A, B) equals0.
3.2 Mean Error
According to Eqs. (1) and (2), to calculate SHD , we have to compute OHD two times, one time fromAtoB, another time fromBtoA. (Aspert et al., 2002) proposes approximating SHD by Mean Error (ME) which only needs to compute OHD one time and therefore dramasttically saves time. The MEdm between surfaceAand point setBis defined as:
dm(A, B) =
Note that, to compute ME between two point sets, one of the point sets must be in structured form (e.g. surface), so as we can get the area of it. In practice, surface is commonly represented as discrete meshes (e.g. triangular meshes). SupposeAconsisting ofNnon-overlapping sub-surfaces (meshes):
A= N∪ i=1A
i (5)
Then the Discrete Mean Error (DME)ddmbetweenAandBcan be defined as:
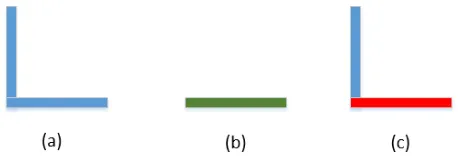
Partial similarity is different from global similarity. The global similarity can be assessed by computing SHD or ME. However, it is not straightforward to assess partial similarity. If an object is a part of another object, or these two objects have common part, then these two objects are partially similar. As shown in Fig. 1, (a) and (b) are partially similar since (b) is a part of (a).
Figure 1: Illustration of partial similarity. (a) and (b) are two objects. The red part in (c) shows the overlap between (a) and (b). Actually, (b) is a part of (a).
3.4 Reciprocal Weighted Mean Error
We propose two kinds of Reciprocal Weighted ME (RWME) for assessing the partial similarity between two 3D objects. One is smoothly-RWME, another one is piecewise-RWME.
Given a surface A, which consists ofN sub-surfaces (see Eq. (5)), and a point setB, the RWMErbetweenAandBis defined
wherecis a positive number which is fixed to0.1in this paper, andwiis the weight.
For smoothly-RWME,wiis defined as:
wi= exp(
−d(Ai, B)
h ) (8)
wherehis a positive number. In this paper, we sethto1. And for piecewise-RWME,wiis defined as:
wi=
(
1, d(Ai, B)< t
0, otherwise (9)
wheretis a number as a threshold.
The International Archives of the Photogrammetry, Remote Sensing and Spatial Information Sciences, Volume XLI-B1, 2016 XXIII ISPRS Congress, 12–19 July 2016, Prague, Czech Republic
This contribution has been peer-reviewed.
3.5 Computation of OHD
According to Eq. (7), to compute RWME between a surface and a point set, we have to compute OHD from the sub-surfaces of the surface to the point set, which consists of two parts. The first part is sampling points from the sub-surfaces, for which we adopt a uniform random sampling strategy. The second part is search-ing the point set for the nearest point of a query point, which is time consuming while the point set contains a large number of points (e.g. a laser scanning point cloud consisting of millions of points). We employ the FLANN (Muja and Lowe, 2014) al-gorithm to achieve the searching. The computational complexity for computing RWME depends on the number of points sampled from the surface and the size of the point set.
4. EXPERIMENTAL RESULTS
4.1 Synthetic Data
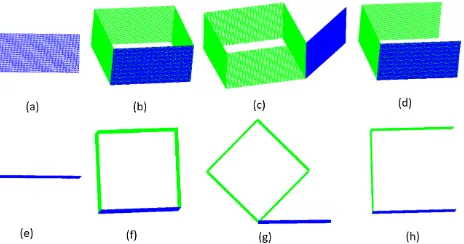
We test our method on a synthetic dataset consisting of 3 target models and 3 query point clouds. Fig. 2 shows the modelsM1,
M2 andM3. The height, width and length of the models are all 10m,20mand20mrespectively.M1andM2both have 4 faces.
M3has 3 faces.
Figure 2: ModelsM1,M2 andM3, from left to right. The top and bottom rows show the sideview and topview of the models respectively (the same below in this paper).
Figs. 3, 4 and 5 show the 3 query point cloudsC1,C2andC3(in blue). The figures also show the overlapping of the point clouds and the target models. Actually,C1,C2 andC3 are point sets uniformly sampled from one face, two faces and three faces of
M1respectively.
Table 1 shows the smoothly-RWMEs and DMEs (in italics) be-tween models and point clouds. Bigger RWME indicates more partially similar, and smaller DME indicates more globally sim-ilar. In the computation of RWMEs and DMEs, we divide the models into their primitive faces. In other words,Nin Eqs. (7) and (4), the number of sub-surfaces ofM1,M2andM3are4, 4, and3resp.. From the table, investigating partial similarity RWME at first, we can see all the point clouds are dissimilar to
M2and partially similar toM1andM3, and can also seeC3(C2) is more partially similar toM1 andM3thanC2 (C1). Now in-vestigating global similarity DME together,C1 (C2 orC3) has almost the same partial similarity but different global similarity toM1orM3. To sum up, the table shows the capability of our method for partial similarity assessement.
Figure 3: Point cloudC1. The leftmost column showsC1alone. The remaining 3 columns show the overlapping ofC1withM1,
M2andM3, from left to right.
Figure 4: Point cloudC2. The leftmost column showsC2alone. The remaining 3 columns show the overlapping ofC2withM1,
M2andM3, from left to right.
Figure 5: Point cloudC3. The leftmost column showsC3alone. The remaining 3 columns show the overlapping ofC3withM1,
M2andM3, from left to right.
4.2 Laser Scanning Point Cloud Data
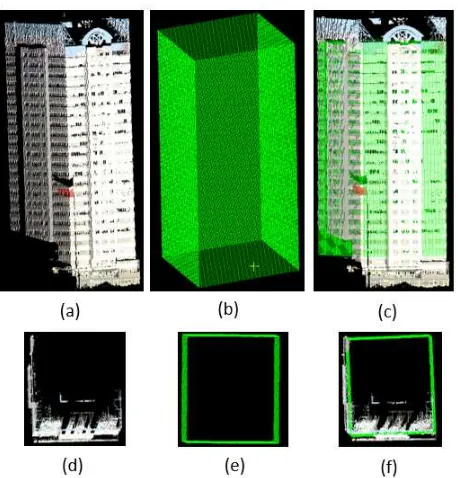
We also test our method on a mobile laser scanning point cloud
C4which is scanned from a building and contains 190,677 points, as shown along with a 4-face cuboid modelM4 in Fig. 6. The time for computing RWMEs (in italics) betweenM4with varied sampling desities andC4with different filtering levels is showed in Table 2, in which#(M4)denotes the number of points sam-pled fromM4 and#(C4) denotes the number of points ofC4 after voxelized grid filtering. Apparently, we can get more ac-curate result of RWME while spending more time to take more points into account. The table shows the flexibility and stability of our method.
The International Archives of the Photogrammetry, Remote Sensing and Spatial Information Sciences, Volume XLI-B1, 2016 XXIII ISPRS Congress, 12–19 July 2016, Prague, Czech Republic
This contribution has been peer-reviewed.
Model M1 M2 M3 Cloud
C1
803.407 0.0014 803.407
15.0339 22.6779 13.3784
C2
1130.93 0.0058 1130.16
10.0604 14.1425 6.7473
C3
1213.42 0.5834 1218.45
2.5953 11.6424 0.1265
Table 1: RWMEs andDMEsbetween models and point clouds.
Figure 6: Point cloudC4(left), modelM4(middle), and the over-lapping ofC4andM4(right).
5. CONCLUDING REMARKS
We presented an effective and flexible method for measuring the rigid partial similarity between a 3D model and a 3D point cloud. We defined the partial similarity as RWME which is the ratio of weighted surface area of the model to the weighted one-sided Hausdorff distance from the model to the point cloud. Different from other methods only available for assessing global similar-ity, our method is capable of assessing both global and partial similarity. Moreover, our method is able to be faster than other partial similarity assessment methods. The experiments for syn-thetic data and laser scanning data testified the superiority of our method.
ACKNOWLEDGEMENTS
This work is supported by the Xizang Minzu University scien-tific research project (No. 13myZP03) and Xizang Autonomous Region Natural science fund projects (No. 2015ZR-14-16).
REFERENCES
Aspert, N., Santa Cruz, D. and Ebrahimi, T., 2002. Mesh: mea-suring errors between surfaces using the Hausdorff distance. In:
ICME (1), pp. 705–708.
Biasotti, S., Cerri, A., Bronstein, A. and Bronstein, M., 2015. Recent trends, applications, and perspectives in 3D shape simi-larity assessment. In:Computer Graphics Forum, Wiley Online Library.
#(M4) 30 856 83,442 8,341,962
#(C4)
905 0.000137 0.001136 0.134565 10.4305
838.711 622.308 535.706 524.699
3,376 9.7e-05 0.002858 0.199431 16.0824
1791.86 1128.01 879.656 857.128
11,758 0.000299 0.007747 0.336818 30.9319
1785.82 1462.44 1048.82 885.532
37,617 0.000535 0.014857 0.707125 67.9103
2012.11 1600.59 1098.18 1027.73
103,396 0.000595 0.028038 1.30579 126.228
2020.34 1643.3 1190.02 1049.67
190,667 0.000658 0.033435 1.8441 178.746
1680.44 1217.65 1206.3 1041.67
Table 2: The time (in seconds) for computingRWMEsbetween
M4with varied sampling desities andC4with different filtering levels.
Bronstein, A. M., Bronstein, M. M., Guibas, L. J. and Ovs-janikov, M., 2011. Shape google: Geometric words and expres-sions for invariant shape retrieval.ACM Transactions on Graph-ics30(1), pp. 1.
Dey, T. K., Li, K., Luo, C., Ranjan, P., Safa, I. and Wang, Y., 2010. Persistent heat signature for pose-oblivious matching of incomplete models. In:Computer Graphics Forum, Vol. 29num-ber 5, Wiley Online Library, pp. 1545–1554.
Lavou´e, G., 2012. Combination of bag-of-words descriptors for robust partial shape retrieval. The Visual Computer28(9), pp. 931–942.
Lin, K.-H., Lam, K.-M. and Siu, W.-C., 2003. Spatially eigen-weighted Hausdorff distances for human face recognition. Pat-tern Recognition36(8), pp. 1827–1834.
Muja, M. and Lowe, D. G., 2014. Scalable nearest neighbor algo-rithms for high dimensional data. Pattern Analysis and Machine Intelligence, IEEE Transactions on36(11), pp. 2227–2240.
Savelonas, M. A., Pratikakis, I. and Sfikas, K., 2015. An overview of partial 3D object retrieval methodologies. Multime-dia Tools and Applications74(24), pp. 11783–11808.
Savelonas, M. A., Pratikakis, I. and Sfikas, K., 2016. Fisher en-coding of differential fast point feature histograms for partial 3D object retrieval.Pattern Recognition.
Sipiran, I., Meruane, R., Bustos, B., Schreck, T., Li, B., Lu, Y. and Johan, H., 2014. A benchmark of simulated range images for partial shape retrieval. The Visual Computer30(11), pp. 1293– 1308.
Talton, J. O., Lou, Y., Lesser, S., Duke, J., Mˇech, R. and Koltun, V., 2011. Metropolis procedural modeling.ACM Transactions on Graphics30(2), pp. 11.
Tan, H., Zhang, Y.-J., Wang, W., Feng, G., Xiong, H., Zhang, J. and Li, Y., 2011. Edge eigenface weighted Hausdorff distance for face recognition.International Journal of Computational Intelli-gence Systems4(6), pp. 1422–1429.
van Kaick, O., Zhang, H. and Hamarneh, G., 2013. Bilat-eral maps for partial matching. In: Computer Graphics Forum, Vol. 32number 6, Wiley Online Library, pp. 189–200.
Yu, Y., Li, J., Yu, J., Guan, H. and Wang, C., 2014. Pairwise three-dimensional shape context for partial object matching and retrieval on mobile laser scanning data. Geoscience and Remote Sensing Letters, IEEE11(5), pp. 1019–1023.
The International Archives of the Photogrammetry, Remote Sensing and Spatial Information Sciences, Volume XLI-B1, 2016 XXIII ISPRS Congress, 12–19 July 2016, Prague, Czech Republic
This contribution has been peer-reviewed.