A STUDY ON THE COMPREHENSIVE SIMULATION OF NONPOINT SOURCE
POLLUTION FOR ER-HAI LAKE’S WATERSHED IN DALI OF CHINA
Kun YANG a, *, Quan-li XU a, b, c, Liao-yuan YE a
a
The Engineering Research Centre of GIS
Technology in Western China, Ministry of Education, Kunming, China –
[email protected]
b
Faculty of Tourism and Geographic Science, Yunnan Normal University, Kunming, China – [email protected]
cSchool of Remote Sensing Information Engineering, Wuhan University, NO.129, Luo-yu Road, Wuhan, 430079,
China – [email protected]
Commission II, WG II/3
KEY WORDS: Non-Point Source Pollution, ABM, GIS, SWAT, Model Integration, Comprehensive Simulation
ABSTRACT:
Er-hai Lake lies in state of Dali of Yunnan Province in China, which is so important to the local people that they revere her as the Mother Lake. Unfortunately, she is threatened by the more serious pollution of water. And from the water quality assessment of Er-hai Lake over the years, it is indicated that the major water pollution source come from nonpoint source pollution. The argument is that what has formed the nonpoint source pollution? As we known, the land use and cover change of watershed called LUCC is deemed as the major reason for Non-point pollution of water. However, what has made the land use and cover changes? It is another important question we should give an answer for water pollution. Many evidences have given that the change of LUCC is more due to the human activities in watershed, especially those for agriculture production. Thereby, there is a chain process for water pollution formation in Er-hai Lake Watershed, which could be described like this: Human activities (more in agriculture) have changed LUCC, and LUCC leads non-point source pollution. As a result, in this paper, those have been discussed according to the driving mechanism of nonpoint source water pollution in Er-hai Lake, which include three explorations. The first is how to build a ABM-LUCC model by using Repast and GIS technology, and the second is the method and implementation for hydrological and water quality model by using SWAT model and GIS, as well as Remote Sensing technology. And establishing a platform for comprehensively simulating the whole process of water pollution by integrating GIS, ABM-LUCC models and hydrological models is the last work for this study.
* Corresponding author:[email protected]
1. INTRODUCTION
Er-hai Lake lies on the state of Dali, which is so important to the local people that they consider her as the Mother Lake. Unfortunately, she is threatened by the more serious pollution of water. And from the water quality assessment of Er-hai Lake over the years, it is indicated that the major water pollution source come from nonpoint source pollution. The arguments for water environmental protection of Er-hai Lake are focused on some issues such as what has formed the nonpoint source pollution of water? What has lead to the environmental change of Er-hai watershed? And the most important is how to get the efficient methods to simulating the temporal-spatial process for change on environment and nonpoint pollution? Those are the questions that we should give more attention to. When the questions are clearly answered, the real reasons of producing for non-point source pollution maybe found and the reasonable suggestions for solving water pollution could be given for Er-hai Lake. water environment and it takes a major research field since the study of LUCC plan is developed in the 90s of 20th century. As declared by Veldkamp and Verburg, what is the biggest challenge for researchers in studying of LUCC is to explore the
dynamic interaction and process between change of LUCC and response on water environments.[1] It is no doubt that, as the carrier of water resources, the changes of environments of Er-hai Lake watershed will make effective changes to the cycle of hydrology as well as the space distribution and density of pollution loads. Thereby, we could conclusion that a reasonable plan or structure for land use could improve the quality of water, otherwise, it maybe take a degradation of water quality. As a result, it could be declared that the driving force of nonpoint source pollution of Er-hai Lake is coming from the negative changes of LUCC such as the lose of soil and water, excessive fertilisation and so on.
However, what has been affecting the LUCC? It is another important question we should give an answer for water pollution. As we known, land is one of the important resources and material ensure mend as concerned for human survival and development, as well as the foundation in the complex system of “Population - Resources - Environment - Development (PRED)”[2]. And many evidences have given that the change of LUCC is more due to the human activities in lake basin,[3] especially those for agriculture production. Thereby, there is a chain rule for water pollution in Er-hai Lake Watershed, which could be described like this: Human actions (more in agriculture) have changed the LUCC, and LUCC leads non-point source pollution. Finally, based on the approach of this chain, we could explore the effect between human activities and non-point water pollution by using the indicator of LUCC of Er-hai Lake watershed.
At last, the more important issues in the paper we should discussed is how to establish the models to simulate this chain that drives the producing of non-point source pollution for Er-hai Lake. Obviously, the impact on LUCC from human activities is a complex system, which modelling is no more better than using the theory of Complex Adaptive System (CAS).[4] The emergence of complexity in science is questioning traditional methods and tools of modeling. Furthermore, as a popular method and a new approach to understand and learn complex systems, Agent-Based Modeling (ABM) is playing a very important role in the CAS world.[5][6] ABM is used to simulate the behaviour of agents in complex systems, as well as relations between the patterns in order to find the emergence of macro behaviour.[7] As far as the modeling for space-time process of hydrologic and water quality as concerned, many distributed hydrological models are good for this work, such as SWAT, which is a power tool for simulate the space-time process of hydrology and the change of water quality.[8]
As a result, in this paper, those have been discussed according to the driving mechanism of nonpoint source pollution in Er-hai Lake, which include three explorations. The first is how to build a ABM-LUCC model by using Repast and GIS technology, and the second is the method and implementation for hydrological and water quality model by using SWAT model and GIS, as well as Remote Sensing technology.
2. METHODOLOGY OF ESTABLISHING FOR SIMULATING MODEL
2.1 Modeling for ABM-LUCC model by Using GIS
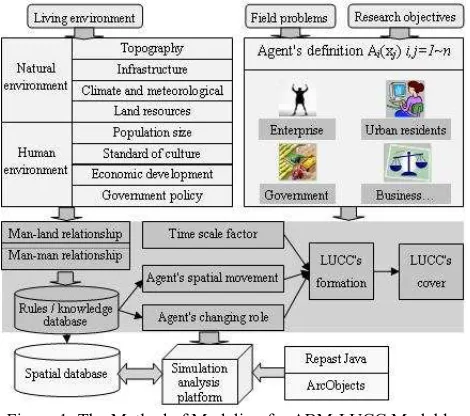
The model of ABM-LUCC is based on multi-agent systems, which are made up of the environmental factors and many agents in those environments. The interactions between the agents as well as between agents and the environments influence the land using tendency in whole regional, in other word, the regional land use change is decided by agents through judging the comprehensive properties of the surrounding environment and the choice they want to make. Based on this approach, we established a model of land use change in Er-hai basin. The method for establishing ABM-LUCC model is shown as figure 1.
Figure 1. The Method of Modeling for ABM-LUCC Model by Using GIS
2.1.1 Agents category
The major purpose in this step is to define the vary agents those are charge of simulating the human activities. This work includes finding the dynamic factors which could directly change the status of LUCC, and then making a classification for those factors, as well as giving some attributes for them. Through exploring the development of agriculture and economy in Er-hai watershed, there are two agents designed in this model, which are Farmer and Government. Government agents play a decisive role in land use. They often consider natural and cultural factors and combine with government master plan so as to determine whether land use type is changed and how to converse them. Farmer agents are those people that have demand for agricultural land, and they drive the change in agricultural land use by making their decisions based on their probable incoming in one year. In addition, all Agents are attributed as some properties, such as age, sex, culture and profession etc, which would affect those agents’ choices greatly during the process of their decisions.
2.1.2 Layers of environmental factors
These are two types of environment, which are natural environment and cultural environment. The former includes terrain, natural resources and infrastructures etc. And those as the social and economic development, the model of cultivating are contained in the later. Each type may contain some layers that could impact the decision of different agents.
Layers of natural environmental factors include the layer for evaluation of traffic distance-based from the road, the layer for evaluation of cultivating distance-based from agriculture resources (such as slope, aspect, water, market and so on). And the cultural environments consist of the layers for economic distribution (major GDP), the layer of population distribution etc. In order to meet the needs of model simulation, land use types for initializing are divided into five categories, which include forest land (woodland and grassland), agricultural land (cultivated land and garden), water (water and water facility), resident and construction land (commercial service land, mining storage space, resident land, public management and service land, special land use, transportation land use) and other land uses.
2.1.3 Agents’ behaviours and status
Agents’ behaviours and status are impacted by their attributes very much. What Farmer Agents do is to gain an individual development or to make some choices to find a job, and the later includes two jobs which are cultivating and being migrant workers. And government Agents may be make policies for social developing of economy, for planning of LUCC or for residential expansion etc.
2.1.4 Agents Decisions for change of LUCC
In this step, the first work is to create the rules between agents and environment where they live through doing investigation in true world, as well as the interaction rules among agents themselves. Influenced by the rules, each agent’s category does a special behaviour and makes a different decision on LUCC. And then, a function for agent decision will be built, which translates the rules to a explicit and formal expression such as mathematic formula or spatial analysis model. Take farmer agents for instances, what they want to obtain mostly is maximize returns from the agricultural productions. Thereby, when the probable profits of maximization from some special land uses are coming to realize, they would tend to make a
choice to keep those land uses, or they would like to change them to another types of land use to get more benefits. We could give a formulation to express this rule.[9]
Maximize Profits (Bm)=Total Gains(G)-Total Costs(C) (1) Bm=Price in Marketplace(P)×Output of Productions(Q) (2) C=Cost of Living(Cl) + Cost of Cultivating(Cc) (3) However, the P and Q and C are all deep affected by natural and cultural environments, such as terrain, water resources, traffic condition, marketplace, population and Agents themselves. Taking those layers as weighting factors, we could improve the formulation 1 as follows.
Bm=Price{P|P=Average of Price(Pa) × [1+Evaluation of Marketplace(M)+ Evaluation of Population Density(Pd)+ Evaluation of Individual(I)]}×Output{Q|Q= Average of(Qa)× [1+ Evaluation of Traffic(T)+ Evaluation of Water Resource(W)+ Evaluation of Slope(S)+ Evaluation of Aspect(A)]}-C. Finally, this formula 2 could be simplified to formula 4 as the last expression for Farmer Agents’ decision.
M Pd I
Qa
T W S A
CPa
Bm 1 1 (4)
2.1.5 The Integrating between ABM-LUCC model and GIS
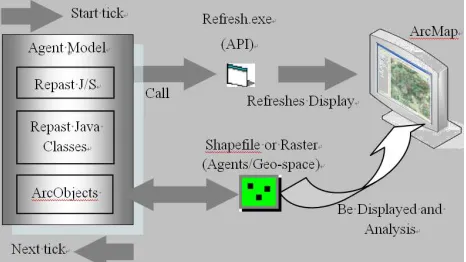
Repast is a very professional platform for agent-based modeling, which has imported some GIS packages such as Geotools.jar, LTC.jar etc. Those packages are coded by Java language and could import the real geographic environment based on ASCII or Shapefile format, as well as drive agent to moving. However, it is insufficient for those GIS tools to make spatial analysis on the results of simulation. Thereby, our destination is gaining the help of ArcGIS to analyse spatial features of agents and environment, for ArcGIS is more skilled to do spatial analysis than those built-in tools. The method for integrating GIS and ABM tightly by using REPAST and ArcGIS platform in this case may be shown in Figure2.
Figure2. The Integrating of GIS and ABM Model by using ArcGIS and Repast
2.2 SWAT-Based Modeling for Hydrological Model by Integrating GIS
2.2.1 The Method for Simulating of Water Quality Base on SWAT
As we known, SWAT model has been providing many advantages in simulating nonpoint source water pollution, such as hydrological analysis based on DEM and LUCC, the spatial
distribution of total N, total P and COD and so on. The simulation of SWAT consists of two major parts, which are runoff producing module and confluence calculating module. The former is charge of calculating and simulating the input and output of water yield, sediment, nutriment and chemistry etc, and the latter is charge of the transporting process of those factors. The method of SWAT model for simulation in non-point source pollution is shown as figure 3.
Figure 3. The Process of Simulating with SWAT Model 2.2.2 The Method for Integrating GIS and SWAT SWAT model could run now in ArcGIS as an embedding extension module, which will be beneficial to integrate hydrological model and GIS application. The principle and method of integrating SWAT-Based hydrological model with GIS technology have been displaying in figure 4. As the picture shown, SWAT model is divided to two parts, one analysis is called data requirement that offers the services of parameters for model, another is called functional requirement which is responsible for special calculations in hydrological cycle and change of water quality. Remote Sensing will be the major technology for getting and dealing parameters and ArcGIS will be the main software for analyzing the result of model output, such as visualization, report, statistics and themes etc.
Figure 4. The Principle and Method for SWAT-Based Hydrological Modeling by Using GIS and Remote Sensing
3. EXPERIMENTS AND RESULTS
3.1 Design and Processing for Experimental Data
As discussed in the context, it is clear for the data requirement of ABM-LUCC and SWAT model in Er-hai Lake watershed. The data list for designing and processing is shown in detail as the table1.
Table 1. Data Requirements and Handling for ABM-LUCC and SWAT model by Integrating ArcGIS
Name Application Processing Memo
Evaluation of Terrain for ABM-LUCC Raster analysis for slope, aspect and reclassify 1:250000 precision DEM of Watershed
Hydrological analysis for SWAT ArcHydro Tools in ArcGIS Initialization for land use for
ABM-LUCC Extracting from TM and ETM of Watershed
Original image of 2009, and simulating to 2015 and 2020 LUCC of Watershed
Major impacting layer for N and P
distribution Coming from the result of simulating of ABM-LUCC
Road of Watershed Evaluation of traffic for ABM-LUCC Distance analysis Raster Water of Watershed Evaluation of agricultural irrigation for ABM-LUCC Distance analysis Raster Marketplace of Watershed Evaluation of agricultural products’ sale for ABM-LUCC Interpolation and Distance analysis Raster Economy of Watershed Evaluation of agricultural products’ price for ABM-LUCC Interpolation and Distance analysis Raster Policy of government As a weight parameter for ABM-LUCC Convert text file to raster Raster Population of Watershed Evaluation of human resources for ABM-LUCC Interpolation and Density analysis Raster
Soil type of Watershed Major impacting layer for transporting of pollution loads. Important parameter
of SWAT model Convert vector to raster Raster
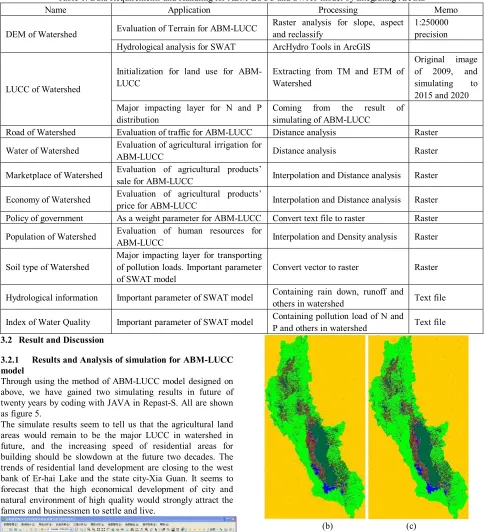
Hydrological information Important parameter of SWAT model Containing rain down, runoff and others in watershed Text file Index of Water Quality Important parameter of SWAT model Containing pollution load of N and P and others in watershed Text file 3.2 Result and Discussion
3.2.1 Results and Analysis of simulation for ABM-LUCC model
Through using the method of ABM-LUCC model designed on above, we have gained two simulating results in future of twenty years by coding with JAVA in Repast-S. All are shown as figure 5.
The simulate results seem to tell us that the agricultural land areas would remain to be the major LUCC in watershed in future, and the increasing speed of residential areas for building should be slowdown at the future two decades. The trends of residential land development are closing to the west bank of Er-hai Lake and the state city-Xia Guan. It seems to forecast that the high economical development of city and natural environment of high quality would strongly attract the famers and businessmen to settle and live.
(a)
(b) (c)
(a).Integrating Interface of Simulation (b).Simulating Result of 2015 (c).Simulating Result of 2020
Figure 5. The Simulating Interface and Results with REPAST-S by Integrating ArcEngine
3.2.2 Results and Analysis of Simulation for Hydrology and Water Quality Model
The simulating for hydrology is divided into 3 steps that are hydrology analysis based on DEM, setting for parameters and calculation of space-time distribution for pollution loads such as N and P. What could be extracted from DEM are water flow, river network, sub-watershed and HRU (Hydrology Response Unit). And the HRU is the destination of hydrological analysis as well as the most important impact factor on calculation for water quality. The setting of parameters is also very important
to simulation of SWAT because that could deep affect the reasonability and validity of simulating process. The results for simulation in different step are shown as figure 6.
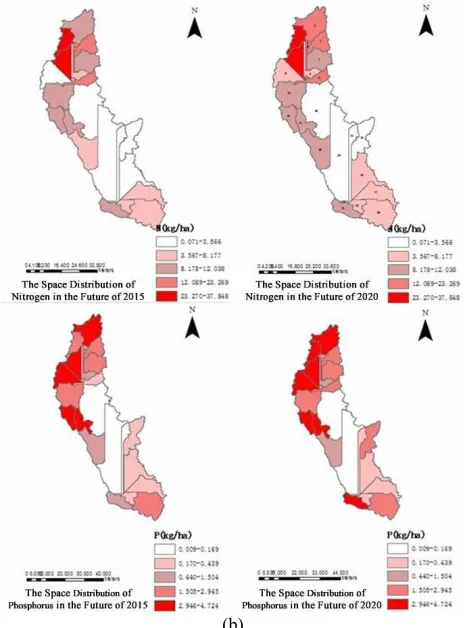
As depicted in results, in Er-hai Lake watershed, the more rapid developing of economy and exploitation for agricultural land, the more losing for soil and water, as well as the more increasing of soil erosion. Meanwhile, the high level of nonpoint water pollution on N and P seems concentrate on the northern and western of lake, which is due to the major agriculture land use with high fertilizing amount crops such as vegetable and garlic. And when it rains, a large number pollution loads such as N and P in the fertilizers and pesticides would be washed into the water from the soil along the runoff. Then, the loads of N and P in water become so much as the water quality is going to degradation, and finally, the nonpoint source pollution is forming in the watershed.
(a)
(b)
(a).The DEM and Sub-watershed of Er-hai Lake; (b). The space distribution of N and P in 2015 and 2020 Figure 6. The SWAT-Based Hydrological Analysis and The
Distribution of Water Quality in ArcGIS
4. CONCLUSION
Firstly, the dynamic driving mechanism of nonpoint water source in Er-hai Lake watershed was discussed in this text. And then, the methodology of how to establish the human activity-driven LUCC model based on Agent-Based Modeling by integrating GIS is explored in detail. Meanwhile, by establishing the hydrological and water quality response model on LUCC result, we also give a method and integrating framework with GIS to simulate the hydrological process and space-time distribution of nonpoint water source pollution loads such as N and P based on SWAT model. And by simulating the LUCC-ABM model, we have forecasted the LUCC information in 2015 and 2020. Furthermore, based on the LUCC layers, the results of response on hydrology and water quality are also calculated by running the ArcSWAT model. And the explanations to all simulating results are also declared clearly.
However, the simulating models and their results are still primary because the cultural environment of Er-hai Lake is uncertain, and the precise of DEM in watershed is also short, let alone the lack of important information about climate, soil and monitoring index of water quality. Therefore, how to improve the validity and stability of the simulating model will wait for further study for this case.
5. ACKNOWLEDGEMENTS
This paper has gained a financial support from 973 Program of China under grand No.2010CB434803, from two projects under grand No. 2012AA1214002 and 2012AA1214003 from National 863 Theme Project(NO.2012AA1214000), and from Yunnan Provincial Science and Technology Project under grand NO.2011XX2005, and Yunnan Provincial Department of Education Research Fund under grand NO. 2011Y307.
6. REFERENCES
1. Veldkamp A, Verburg P H. 2004, Modeling land use change and environmental impact. Journal of Environmental Management, 72(1-2): 1-3.
2. Yunlong Cai, 2001, “Land Use / Land Cover Change: Looking for a new integrated approach,” Geographical Research, 2001, vol.20 (6), pp.645 – 652.
3. Xiu-lan Wang, Yu-hai Bao, 1999, Land Use Change in Research Methodology, Progress in Geography, 1999, vol.18 (1) , pp.81- 87.
4. Hong-zhong Deng, Yue-jin Tan, Yan Chi. 2002, A study method for complex systems— —policy of modeling in entirety based on multi-agent. Systems Engineering, 18(4):73-77
5. Batty, M. 2001, Agent-Based Pedestrian Modeling, Environment and Planning B, 28(3):321-326.
6. Allen, P. M. 1997, Cities and regions as self-organizing systems: models of complexity Gordon and Breach, Buffalo.
7. Batty, M. 2005, Cities and complexity. Understanding cities with cellular automata, agent-based models, and fractals MIT Press, Cambridge, Mass.
8. Arnold, J. G, N. Fohrer.2005,SWAT2000:Current capabilities and re-search opportunities in applied watershed modeling. Hydrological Processes, 19 (3):563~572.
9. Li-hu Pan, He Huang. 2010.8, Application of Artificial Society Model to Study of Land Use Change. Journal of
System Simulation. 22(8):1965~1969