LEAF AREA INDEX ESTIMATION IN VINEYARDS FROM UAV HYPERSPECTRAL
DATA, 2D IMAGE MOSAICS AND 3D CANOPY SURFACE MODELS
I. Kalisperakisa∗, Ch. Stentoumisa, L. Grammatikopoulosb,, K. Karantzalosc a
up2metric, Athens, Greece,
[email protected],[email protected] b
Laboratory of Photogrammetry, Technological Educational Institute of Athens, Greece, [email protected]
cRemote Sensing Lab., National Technical University of Athens,
Commission I,WG ICWG I/Vb
KEY WORDS:Precision agriculture, biomass, crop, narrow band indices
ABSTRACT:
The indirect estimation of leaf area index (LAI) in large spatial scales is crucial for several environmental and agricultural applications. To this end, in this paper, we compare and evaluate LAI estimation in vineyards from different UAV imaging datasets. In particular, canopy levels were estimated fromi.e., (i)hyperspectral data,(ii)2D RGB orthophotomosaics and(iii)3D crop surface models. The computed canopy levels have been used to establish relationships with the measured LAI (ground truth) from several vines in Nemea, Greece. The overall evaluation indicated that the estimated canopy levels were correlated (r2 >73%) with the in-situ, ground truth LAI measurements. As expected the lowest correlations were derived from the calculated greenness levels from the 2D RGB orthomosaics. The highest correlation rates were established with the hyperspectral canopy greenness and the 3D canopy surface models. For the later the accurate detection of canopy, soil and other materials in between the vine rows is required. All approaches tend to overestimate LAI in cases with sparse, weak, unhealthy plants and canopy.
1. INTRODUCTION
Biomass and leaf area index (LAI) are important variables in many ecological, environmental and agricultural applications. Ac-curate estimation of biomass is required for carbon stock account-ing and monitoraccount-ing, while LAI, which is defined as the one half of the total leaf area per unit ground surface area, controls many biological and physical processes in the water, nutrient and car-bon cycle. These key crop parameters are frequently used to as-sess crop health status, nutrient supply and effects of agricultural management practices [Zarco-Tejada et al., 2013], [Duan et al., 2014].
In particular, for precision agriculture applications LAI is asso-ciated with agronomic, biological, environmental, and physio-logic processes, which are related to growth analysis, photosyn-thesis, transpiration, interception of radiation, and energy bal-ance [Thenkabail et al., 2000], [Haboudane et al., 2004], [Liu et al., 2012], [Kandylakis et al., 2013], [Atzberger et al., 2015]. It is also one of the most relevant indices applied to experimentation, even for crop yield prediction and water balance modelling in the soil-water-atmosphere system [Verger et al., 2014].
Direct methods are the most precise, but they have the disadvan-tage of being extremely time-consuming and as a consequence making large-scale implementation only marginally feasible. Pre-cision problems may in this case result from the definition of LAI, the scaling-up method, or from the error accumulation due to frequently repeated measurements. LAI estimation with direct methods are the most precise and therefore are often implemented as calibration tools for indirect measurement techniques. Indirect optical observations on LAI can be well correlated with vegeta-tion indices like NDVI for single plant species which are grown
∗Corresponding author: Dr. Ilias Kalisperakis,up2metric, Athens, Greece,[email protected], www.up2metric.com
under uniform conditions. However, for mixed, dense and multi-layered canopies, these indices have non-linear relationships and can only be employed as proxies for crop-dependent vegetation parameters such as fractional vegetation cover, LAI, albedo and emissivity.
Recent advances in remote sensing and photogrammetry have combined 3D measurements with rich spectral information, yield-ing unprecedented capabilities for observyield-ing crops, biodiversity and ecosystem functioning. Aerial manned and unmanned sys-tems are gaining continually important research and development efforts and also market share for several geospatial applications due to the describing cost and increasing reliability. In particu-lar, for precision agriculture applications many studies beyond estimating a standard NDVI map aim to build consistent cali-brated models and validate them against the accurate estimation of crop LAI. The estimation of the canopy volume through the calculation of 3D models and other metrics of vertical structure have been, already, employed from several studies for estimating aboveground biomass and carbon density, biomass change and LAI [Dandois and Ellis, 2013], [Bendig et al., 2015]. While con-ventional airborne LIDAR acquisitions have become less expen-sive over time, they remain very costly for researchers and other end-users, especially if required at high spatial resolution over a few small areas or at high temporal frequencies [Dandois and Ellis, 2013].
(a) The multicopter (OnyxStar BAT-F8, Altigator, Belgium) with lightweight single board computer and frame grabber.
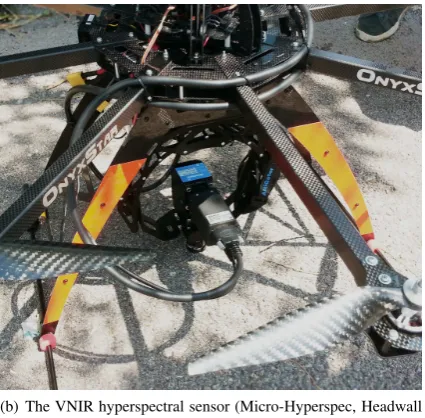
(b) The VNIR hyperspectral sensor (Micro-Hyperspec, Headwall Photonics, USA) onboard the UAV.
Figure 1: The UAV system that was employed during the aerial campaigns with a low cost standard RGB camera (i.e., GoPro Hero3) and the push-broom hyperspectral sensor.
ground truth. The quite promising experimental results indicate that hyperspectral sensors along with low cost RGB cameras can provide high spatial and rich spectral information for estimating accurately key crop paramters.
2. MATERIALS AND METHOD
Nemea Study Area: Our experiments were performed in the study area of Nemea which is located in the North-East of Pelo-ponnese, with the Agiorgitiko vine variety the dominating one for red winemaking. In particular, Nemea- Agiorgitiko is the grape allowed to use the Nemea Appellation (PDO Nemea). During this study we focused on vineyards near the semi-mountainous village of Asprokambos at an altitude of about 700m above sea level. Aerial and concurrent field campaigns were conducted with a low-cost standard RGB camera, a push-broom hyperspectral sensor and a portable spectroradiometer.
Aerial campaign: An aerial campaign with an unmanned aerial vehicle (Figure 1) was conducted on the3rd
of August 2014 at
(a) The resulted orthomosaic from the collected aerial RGB images.
(b) The calculated GRVI index on the detected canopy
Figure 2: The Green-Red Vegetation Index (GRVI) was calcu-lated on the detected canopy from the aerial RGB orthomosaic.
the Nemea study area. A multicopter (OnyxStar BAT-F8, Altiga-tor, Belgium) with electronic controllers and navigation systems (BL-Ctrl V2.0, Navi-Ctrl v2.0, Mikrokopter, Germnay) equipped with:
• a push-broom hyperspectral VNIR imaging sensor (Micro-Hyperspec A-Series 380nm-1000nm, Headwall Photonics, USA)
• a low-cost standard RGB camera (i.e.,GoPro Hero3)
was employed. The sensors were mounted and stabilized thought a camera gimbal (AV200, PhotoHigher, New Zealand). The hy-perspectral sensor was connected through a frame grabber with a custom-made lightweight mini-ITX with low power consumption (Figure 1). A GoPro HERO3+ Black Edition was, also, concur-rently onboard the UAV delivering video and images at certain time intervals.
(a) The resulted DSM from the aerial dataset with texture from the RGB orthomosaic.
(b) The 3D model of the canopy after the estimation of the soil in-between the vine rows.
Figure 3: The estimated DSM and 3D model of the canopy derived from the aerial imagery and the low-cost standard RGB lightweight camera.
vineyard or vine row [Karakizi et al., 2015]. Existing maps with geographic information and varietal plantation were verified or updated during field surveys. In situ reflectance measurements were performed using the GER 1500 (Spectra Vista Corporation, US) portable spectroradiometer which provides spectra with 512 spectral bands distributed in the spectral region from 350nm to 1050nm with 3.2 nm FWHM. The position of each measurement was recorded using a portable GPS. Moreover, at certain locations with vigour and non vigorous plants, LAI was assessed directly by a non-destructive precise counting of all leaves per vine. In particular, after collecting the aerial and ground reflectance data the mean leaf area was estimated along with the number of leaves per sampling location.
Automatic aerial image orientation: An indispensable step for the generation of both 2D RGB orthomosaic and 3D canopy model is the estimation of image orientations and camera calibra-tion. This is performed via an automatic image-based framework. In a first step all GoPro views are corrected from severe radial distortion effects due to the fish-eye lens. Following a hierarchi-cal image orientation process (structure from motion, SFM) all available images are relatively oriented and optimally calibrated. This procedure incorporates 2D feature extraction and matching among images, outlier detection for the elimination of false point correspondences, orientation initialization through closed-form algorithms and a final self-calibrating bundle adjustment solution. It should be noted that all these steps are applied at successive im-age scales in order to handle effectively the large number of high resolution images. The resulted orthophotomosaic from the col-lected aerial RGB images is shown in (Figure 2a).
3D canopy model: Once all aerial images are oriented a dense point cloud is generated by employing dense stereo and multi-image matching algorithms. The 3D point cloud is then converted to a 3D model (3D Mesh) through 3D triangulation and finally to a DSM by keeping the highest elevation for every planimetric ground position. Appropriate texture is also computed for each 3D triangle via a multi-view algorithm, using a weighted blend-ing scheme. The resulted DSM from the collected aerial RGB images is shown in (Figure 3a). In order to estimate more pre-cisely the volume of the canopy the soil between the vine rows was detected. Having detected both the canopy and the soil in 2D, the DTM was estimated based on a morphological reconstruction approach. The 3D model of the detected canopy was then calcu-lated after projecting the estimated from the DSM canopy height on the DTM (Figure 3b).
2D RGB imaging mosaics: Combining the oriented image set with the reconstructed DSM of the vineyard, a 2D orthomosaic is produced by a multi-image algorithm based on automatic visi-bility checking and texture blending that can compensate for dif-ferent orientations, scale and resolution of the images involved. The resulted orthomosaic from the collected aerial RGB images is shown in Figure 2a.
2D hyperspectral canopy greenness: Due to the movement and the vibrations of the UAV platform the raw hyperspectral data acquired from the push-broom sensor were highly distorted. In order to perform a rough geometric correction, every single scan line was aligned with the precedent, via a 1D transformation that minimized their intensity differences. In particular, each scanline is shifted (upwards and downwards) relatively to the precedent one for a range of different displacements by one pixel step at a time (e.g. from -20 to 20 pixels). At each discrete displacement a cost is computed as the sum of the intensities absolute differ-ence of the current scanline to the previous one. By a winner takes all (WTA) scheme the displacement with the minimum cost is chosen and applied to the selected scanline. The same pro-cedure is repeated for every consecutive scanline and a final 2D roughly undistorted hyperspectral mosaic is generated. All the above computations for estimating the required displacements are performed based a (narrow) color composite which resembles a standard RGB and the final estimated shifts are then applied to entire hypercube.
Moreover, in the same locations with the in-situ reflectance data the relationship with the aerial hyperspectral data were estimated.
(a) Correlating the 2D GRVI with the 3D canopy volume
(b) Correlating the 2D GRVI with the canopy greenness map from the hyperspectral data
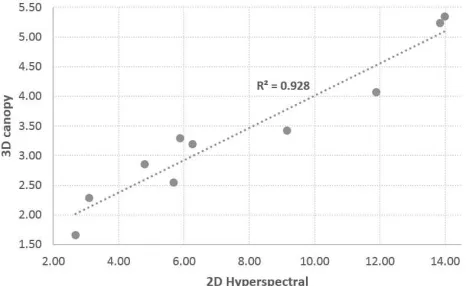
(c) Correlating the canopy greenness map from the hyperspectral data with the 3D canopy model
Figure 5: The relation between the estimated canopy levels be-tween the 2D RGB mosaic and (a) the 3D canopy (b) the hyper-spectral map.
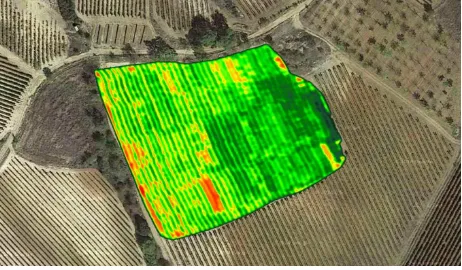
The high correlation rate (r2>94%) indicated the consistency of the acquired dataset [Karakizi et al., 2015]. The narrow NDVI was calculated from the hyperspectral data and through a fur-ther classification the different canopy greenness levels were esti-mated which can be associated with the vegetative canopy vigour, biomass, leaf chlorophyll content, canopy cover and structure. The resulted canopy greenness map is shown in Figure 4.
3. EXPERIMENTAL RESULTS AND EVALUATION
Aerial and in-situ data were collected during the veraison period at the Nemea study area. Aerial data were collected from a multi-copter with a low cost standard RGB camera (i.e., GoPro Hero3),
a push-broom hyperspectral sensor, a lightweight single board computer and a frame grabber Figure 1. The goal was to bench-mark the estimation of LAI from the acquired hyperspectral data, the RGB orthomosaic and the 3D canopy model against the in-situ LAI measurements.
The resulted orthomosaic from the collected aerial RGB images and the calculated GRVI index on the detected canopy are shown in Figure 2. The resulted DSM from the aerial dataset with tex-ture from the RGB orthomosaic and the calculated 3D canopy model after the estimation of the soil in-between the vine rows are shown in Figure 3. The estiamted canopy greenness map based on the calculation of a narrow NDVI from the UAV hyperspectral data are shown in Figure 4.
For the quantitative evaluation firstly the relation between the
es-(a) Correlating the calculated LAI (GT) with the 2D GRVI map from the aerial RGB orthomosaic
(b) Correlating the calculated LAI (GT) with the 3D canopy volume
(c) Correlating the calculated LAI (GT) with the canopy greenness map from the hyperspectral UAV data
timated canopy levels between the 2D RGB mosaic and (a) the 3D canopy (b) the hyperspectral map were performed in (Fig-ure 5). The correlation between the calculated GRVI (from the 2D RGB orthomosaic) and the canopy greenness from the hyper-spectral data were relative high and above 84%, while the one between the calculated GRVI and the 3D canopy was lower at approximately 79%. The highest relations (r2 >90%) were es-tablished between the estimations from the hyperspectral data and the 3D canopy model.
Regarding the relations against the ground truth (direct, in-situ LAI measurements) the experimental results followed a similar pattern Figure 6. The LAI estimation from the hyperspectral data and the 3D canopy model resulted in higher correlations rates (r2>80%), while the ones from the 2D RGB orthomosaic rela-tive lower (r2<73%).
The aforementioned results indicate that LAI was estimated more accurately from the hyperspectral data and 3D canopy model. It should be noted that for the hyperspectral data just a standard nar-row NDVI was employed, while more sophisticated indices may would have correlated better in terms of chlorophyll concentra-tions, etc. Both datasets seems to fail more in cases with lower LAI values over sparse, weak, unhealthy plants and canopy.
4. CONCLUSION AND FUTURE PERSPECTIVES
In this paper, LAI estimation from three different UAV-based imaging sources was validated against direct, in-situ LAI mea-surements. In particular, canopy levels were estimated fromi.e., (i)hyperspectral data, (ii) 2D RGB orthomosaics and(iii)3D crop surface models. The computed canopy levels have been used to establish relationships with the measured LAI (ground truth) from several vines in Nemea, Greece. The overall evalu-ation indicated that the estimated canopy levels were correlated (r2>73%) with the ground truth. Between the different observa-tions the hyperspectral and the 3D model established the highest relations. Moreover, as expected, the lowest correlations against the ground truth data were derived from the calculated greenness levels from the 2D RGB orthomosaics. The highest correlation rates were established for the hyperspectral and the 3D canopy levels. The experimental results and the evaluation indicated that the leaf area index in vineyards can be approximated from both hyperspectral sensors and 3D canopy models. For the later the accurate detection of canopy, soil and other materials in between the vine rows is required. Further validation in several vineyards, vine varieties and other crop types is required in order to con-clude on the optimal, efficient and cost-effective manner for LAI estimation from UAVs.
REFERENCES
Atzberger, C., Darvishzadeh, R., Immitzer, M., Schlerf, M., Skid-more, A. and le Maire, G., 2015. Comparative analysis of differ-ent retrieval methods for mapping grassland leaf area index using airborne imaging spectroscopy. International Journal of Applied Earth Observation and Geoinformation.
Bendig, J., Yu, K., Aasen, H., Bolten, A., Bennertz, S., Broscheit, J., Gnyp, M. L. and Bareth, G., 2015. Combining uav-based plant height from crop surface models, visible, and near infrared veg-etation indices for biomass monitoring in barley. International Journal of Applied Earth Observation and Geoinformation 39(0), pp. 79 – 87.
Dandois, J. P. and Ellis, E. C., 2013. High spatial resolution three-dimensional mapping of vegetation spectral dynamics using com-puter vision. Remote Sensing of Environment 136(0), pp. 259 – 276.
Duan, S.-B., Li, Z.-L., Wu, H., Tang, B.-H., Ma, L., Zhao, E. and Li, C., 2014. Inversion of the PROSAIL model to estimate leaf area index of maize, potato, and sunflower fields from unmanned aerial vehicle hyperspectral data. International Journal of Applied Earth Observation and Geoinformation 26(0), pp. 12 – 20.
Haboudane, D., Miller, J. R., Pattey, E., Zarco-Tejada, P. J. and Strachan, I. B., 2004. Hyperspectral vegetation indices and novel algorithms for predicting green LAI of crop canopies: Modeling and validation in the context of precision agriculture. Remote Sensing of Environment 90(3), pp. 337–352.
Kandylakis, Z., Karantzalos, K., Karakizi, C., Makris, G. and Georgopoulos, A., 2013. Evaluating Spectral Indices from WorldView-2 Satellite Data for Selective Harvesting in Vine-yards. In: 9th European Conference on Precision Agriculture.
Karakizi, C., Oikonomou, M. and Karantzalos, K., 2015. Spec-tral Discrimination and Reflectance Properties of Various Vine Varieties from Satellite, UAV and Proximate Sensors. In: The International Archives of the Photogrammetry, Remote Sensing and Spatial Information Sciences, Volume XL-7/W3, 36th Inter-national Symposium on Remote Sensing of Environment.
Liu, J., Pattey, E. and J´ego, G., 2012. Assessment of vegeta-tion indices for regional crop green LAI estimavegeta-tion from landsat images over multiple growing seasons. Remote Sensing of Envi-ronment 123(0), pp. 347–358.
Thenkabail, P. S., Smith, R. B. and Pauw, E. D., 2000. Hyper-spectral Vegetation Indices and Their Relationships with Agri-cultural Crop Characteristics. Remote Sensing of Environment 71(2), pp. 158 – 182.
Verger, A., Vigneau, N., Ch´eron, C., Gilliot, J.-M., Comar, A. and Baret, F., 2014. Green area index from an unmanned aerial system over wheat and rapeseed crops. Remote Sensing of Envi-ronment 152(0), pp. 654 – 664.