GEOMATICS FOR MAPPING OF GROUNDWATER POTENTIAL ZONES IN
NORTHERN PART OF THE UNITED ARAB EMIRATIS - SHARJAH CITY
R. AL-Ruzouq*, A. Shanableh and T. Merabtene
University of Sharjah, Departmrnt of Civil and Enviromental Engineering United Arba Emirtaes , Sharjah - [email protected]
KEY WORDS: Groundwater mapping, Photogrammetry, Digital Elevation Model, Image classification
ABSTRACT:
In United Arab Emirates (UAE) domestic water consumption has increased rapidly over the last decade. The increased demand for high-quality water, create an urgent need to evaluate the groundwater production of aquifers. The development of a reasonable model for groundwater potential is therefore crucial for future systematic developments, efficient management, and sustainable use of groundwater resources. The objective of this study is to map the groundwater potential zones in northern part of UAE and assess the contributing factors for exploration of potential groundwater resources.
Remote sensing data and geographic information system will be used to locate potential zones for groundwater. Various maps (i.e., base, soil, geological, Hydro-geological, Geomorphologic Map, structural, drainage, slope, land use/land cover and average annual rainfall map) will be prepared based on geospatial techniques. The groundwater availability of the basin will qualitatively classified into different classes based on its hydro-geo-morphological conditions. The land use/land cover map will be also prepared for the different seasons using a digital classification technique with a ground truth based on field investigation.
* Corresponding author. This is useful to know for communication with the appropriate person in cases with more than one author. 1. INTRODUCTION
1.1 Overview
Water is one of our most important natural resources. Without it, there would be no life on earth. Although there is plenty of water on earth, it is not always in the right place, at the right time and of the right quality. Groundwater is a form of water occupying all the voids within a geological stratum. Water bearing formation of the earth’s crust acts as conduits for transmission and as reservoirs for storing water. The occurrence of groundwater in a geological formation and the scope for its exploitation primarily depend on the formation porosity. In the presence of interconnected fractures, cracks, joints, crushed zones (such as faults zones or shear zones) or solution cavities, rainwater can easily percolate through them and contribute to groundwater.
The conventional methods used to prepare groundwater potential zones are mainly based on ground surveys. With the advent of remote sensing and Geographic Information System (GIS) technologies, the mapping of groundwater potential zones within each geological unit has become an easy procedure. The groundwater conditions vary significantly depending upon the slope, presence of fractures, surface water bodies, canals, irrigated fields etcetera. These factors can be interpreted or analysed in GIS using remote sensing data.
Geographic information system (GIS) can be used to store, process and display spatial information in the form of map or image that include attribute as database. A digital elevation model can be extracted based on field or photogrammetric technology and can be used to define boundary of valley, visualize the geomorphology of area, delineate the sub catchments, extract drainage pattern and obtain surface elevation. Moreover, terrain processing uses DTM to identify the surface drainage pattern. Once processed, the DTM and its
derivatives can be used for efficient watershed delineation and stream network generation where flow direction down to catchment processing can be completed.
This study aims to collect and process geospatial layers (Topography, geology and hydrology) needed for exploring underground water potential zones North-East area of the United Arab Emirates (UAE), Figure 1.
1.2 Literature Review
The conventional methods used to prepare groundwater potential zones are mainly based on: Ground surveys; Geophysical Methods such as resistivity, and ground penetrating radar; Probabilistic Models such as Logistic Regression Method; and modelling based on remote sensing, GIS and Geology. The conventional methods need a lot of work, consumes time and efforts. With the use of remote sensing and GIS technologies mapping of groundwater potential zones has become easier and less expensive compared to conventional methods. Satellite data provide quick and useful baseline information about various factors controlling directly or indirectly the occurrence and movement of groundwater such as geomorphology, soil types, land slope, land use/land cover, drainage patterns, and lineaments. In addition, geographical information system (GIS) provides an excellent framework for efficiently handling large and complex spatial data for natural resources management (Machiwal et al, 2011).
Several studies were carried out in the past two decades for identifying the groundwater potential zones using GIS and remote sensing data. (Nampak et al, 2014) exploit potential application of an evidential belief function (EBF) model for spatial prediction of groundwater productivity at Langat basin area, Malaysia using geographic information system (GIS) technique. About 125 groundwater yield data were collected from well locations. Subsequently, the groundwater yield was divided into high and low yields respectively, based on the groundwater classification standard recommended by Department of Mineral and Geosciences (JMG), Malaysia. A total of twelve groundwater conditioning factors that affect the storage of groundwater occurrences were derived from various data sources such as satellite based imagery, topographic maps and associated database. Those twelve groundwater conditioning factors are elevation, slope, curvature, stream power index (SPI), topographic wetness index, drainage density, lithology, lineament density, land use, normalized difference vegetation index (NDVI), soil and rainfall. Subsequently, the Dempster–Shafer theory of evidence model was applied to prepare the groundwater potential map. Finally, the result of groundwater potential map derived from belief map was validated using testing data.
(Moghaddam et al, 2013) produce groundwater spring potential map using a bivariate statistical model (frequency ratio) and geographical information system (GIS) in the Taleghan Watershed, Alborz Province, field surveys were done for identifying and springs inventory mapping. The effective factors on the groundwater spring such as: slope percent, slope aspect, altitude, topographic wetness index, stream power index, slope length, plan curvature, distance from rivers, distance from roads, distance from faults, lithology, land use, soil hydrology groups, and drainage density were derived from the spatial database. Using the above effective factors, groundwater spring potential mapping was calculated using bivariate statistical model, and the results were plotted in Arc GIS. The results of groundwater spring potential map may be helpful for planners and engineers in water resource management and land use planning.
(Gaur et al, 2011) developed a methodology for groundwater evaluation by the combined use of numerical model and spatial modeling using GIS. The developed methodology has been applied on the sub-basin of the Banganga River, India. Initially, the groundwater potential zones have been delineated by spatial modeling. Different thematic maps of the basin like geology, geomorphology, soil, drainage, slope factor and
landuse/landcover have been used to identify the groundwater potential zones.
(Vasanthavigar et al, 2011) identify groundwater potential zones in Thirumanimuttar basin with an integrated approach using Remote Sensing and geographical information system (GIS). Landsat TM 30 m resolution data and topographic maps has been used to generate thematic maps like geology, geomorphology, lineament and lineament density, drainage, drainage density, and slope map of the study area. A number of geomorphic units such as Denudational hills, structural hills, Bajadas, Colluvial plain, Pediplain, Deep Pediment and Alluvial plains have been observed. A composite groundwater potential map has been generated as very high, high, medium, low and very low based on the groundwater availability area. The upper, middle and downstream of the basins have been identified as potential zones for groundwater exploration. The regions of lineaments and intersecting lineaments proved for groundwater potential zones. The data generated was validated with field checks and observed to be in conformity with the same.
(Al Saud. M , 2010) Investigated the potential for groundwater storage in Wadi Aurnah Basin, in Saudi Arabia using remote sensing and geographic information system (GIS) techniques Satellite. Images with high spatial resolution were processed to recognize terrain elements controlling the subsurface rock behavior. Landsat 7 ETM+, ASTER and SRTM satellite images were processed .The influencing factors on groundwater storage were determined and digitally mapped as thematic layers. This included rainfall, lithology, rock fractures, slope, drainage and land cover/use. These factors were integrated in the GIS system (ArcView). A map was produced, indicating potential areas for groundwater storage. The generated map shows that 12–15% of Wadi Aurnah Basin has potential for groundwater storage, mainly in areas where intensive fracture systems exist.
(Dar. A. et al, 2010) combined remote sensing, evaluation of digital elevation models GIS and fieldwork techniques to study the groundwater conditions in Mamundiyar basin, Tamilnadu. Several digital image processing techniques, including standard color composites, intensity-hue-saturation (IHS) transformation and decorrelation stretch (DS) were applied to map rock types. Remote sensing data were interpreted to produce lithological and lineament maps. DEM was used for lineament and geomorphologic mapping. All thematic layers were integrated and analyzed in a GIS. The overall results demonstrate that the use of remote sensing and GIS provide potentially powerful tools to study groundwater resources and design a suitable exploration plan.
(Ganapuram et al, 2009) explore the groundwater availability for agriculture in the Musi basin. Remote sensing data and geographic information system were used to locate potential zones for groundwater in the Musi basin. Various maps (i.e., base, hydro-geomorphological, geological, structural, drainage, slope, land use/land cover and groundwater prospect zones) were prepared using the remote sensing data along with the existing maps. The groundwater availability of the basin is qualitatively classified into different classes (i.e., very good, good, moderate, poor and nil) based on its hydro-geomorphological conditions. The land use/land cover map was prepared for the Kharif season using a digital classification technique with the limited ground truth for mapping irrigated areas in the Musi basin. The alluvial plain in filled valley, flood plain and deeply buried pediplain were successfully delineated and shown as the prospective zones of groundwater.
the principal freshwater aquifers in the UAE, their distribution and the current use. The analysis and mapping have been made based on field investigation.
The Main objectives of this study is to use analytical hierarchy process (AHP) spatial model for prediction of groundwater potential zones, investigate the contributing factors of potential groundwater resources for the study area, Delineate the sub catchments areas and extract drainage pattern for the study area and create an integrated GIS and Remote sensing database for the Northern part of UAE.
Achieving mentioned objectives would require Minor objectives analysis of the remote sensing data set according to water bodies and geological features, Generate land use / land cover map through digital processing of remotely sensed data of Landsat images, processing of satellite images in the study area to produce , generate Ortho-photo image ( Image with same characteristics of maps, where it is distortion free image, has constant scale and can be used for actual measurement in GIS systems), generate Digital Elevation Model.(Digital Representation of land topography) and finally Developing 2.5D-GIS Model for the study area.
2. METHODOLOGY
This work consists of two parts; Part one deal with the collecting and preparation geospatial data using GIS and remote sensing. The layers include (soil, geology and geomorphology, the slope of the area, hydrology, drainage, lineament and the rainfall). Prepare the layers for predicting groundwater zones passes through many stages based on nature and type of the available data. Digitizing, scanning, geo-referencing, projection, reclassification interpolation and many other techniques will be involved.
Part two deals with the collecting and processing geospatial Data using GIS and remote sensing. The concept of data manipulation implies integrating all factors as layers in the GIS system after converting the existing data into electronic (digital) form. The obtained data discussed in the previous sections will be described according to their governance in relation to groundwater storage. This enables application of the systematic procedures and takes advantage of the GIS system. Thereafter, a unique map will result with a number of polygons indicating special characteristics for groundwater storage (e.g., high, moderate, etc.). However, not all these factors have the same effect on groundwater storage. For example, the rock fracture factor is much more effective than the drainage density factor, while the rainfall factor is more effective than all other factors. Also, some factors work negatively and positively in groundwater storage, like the slope factor, which has two different kinds of influence on groundwater recharge, thus it has minimal. For this reason, each factor will be given a specific weight of effect on groundwater storage. The weights in this study were determined according to the experienced judgment of the hydro-geologist based on field surveys and in-situ investigations and the field observations adopted by miscellany of obtained studies using remote sensing and GIS in assessing
2.1 Data preparation
Different factors have been considered in this study to map the potential areas for groundwater storage (rainfall, slope, geology, geomorphology, soil type and hydrogeology). Examples that
include the rainfall slope and geology are shown in the next paragraph.
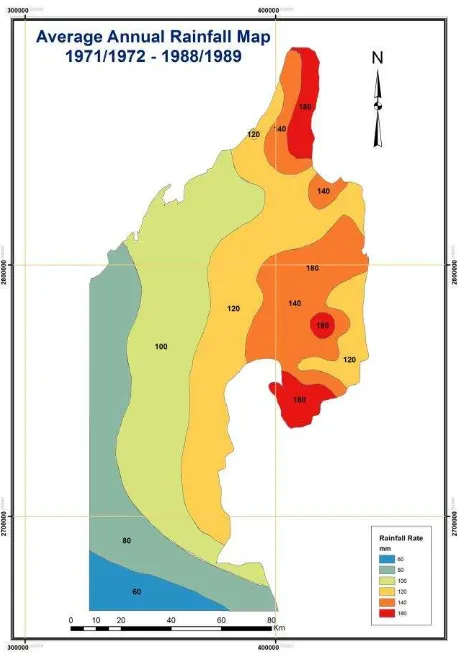
The average rainfall was calculated from 1971 to 1990 based on UAE University Atlas and classified into five classes to grade the rainfall according to the amount of water received for each area. The classes are <60, 60-80, 80-100, 100-140, 140-180 and shown in Figure 2.
Figure 2. Average rainfall map for the Northern part of UAE.
Slope is the measure of steepness or the degree of inclination of a feature relative to the horizontal plane. It can be derived from topographic and contour maps as well as digital elevation model (DEM). A 30 DEM (USGS Source) was used to derive the slope map for the study area and classified into five classes (0-1.52), (1.53-4.38), (4.39-8.56), (8.57-13.89), (13.90-48.33), Figure 3.
The types of rocks influence the amount of water transferred to the underground layers so it is important to have knowledge about the types of rocks and its behaviour. According to the geology map extracted from the UAE University Atlas the types are : Alluvium, Beach Deposits ,Calcareous ,sandstone ,Granite and granodiorate ,Limestone and marlis ,Limestone and marlis, Limestone chert volcaansic and metamorphic, Limestone marlis , and Wadi deposits as shown in Figure 4.
Figure 3. Slope map for the Northern part of UAE.
Figure 4. Geology map for the Northern part of UAE.
2.2 Data processing
The processing of the previous dataset starts by digitizing, merging and converting all the maps into raster maps. Each cell in the study area now has a value for each input criteria (rainfall, slope, geology, geomorphology, soil type and hydrogeology). To combine the derived datasets and create map that identifies the potential groundwater locations, a common measurement scale from 1 to 5 according to their effectiveness in the availability of groundwater, while the layers that will not affect the groundwater were given a restricted value. The common measurement scale is what determines how good a particular location for each cell for reserving groundwater. The value 1 indicates most probable locations. Figure 5 shows the reclassification for the rainfall map.
Figure 5. Reclassified rainfall map
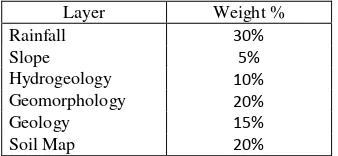
By overlaying all the layers together and by classifying all the layers from 1 to 5 a specific weight were given for each layer the value were adopted based on survey targeting expertise of several fields as well as literature review related to some gulf area.. (Al Saud, 2010). The Assumed weights are shown in Table 1.
Layer Weight %
Rainfall 30%
Slope 5%
Hydrogeology 10%
Geomorphology 20%
Geology 15%
Soil Map 20%
Note that Rainfall classification performed in the reversed order from the highest to the lowest value. Table 2 shows classification and assigned weight for each Layer.
Actual Value Classified Value
Table 2. Classification and assigned weight for each Layer.
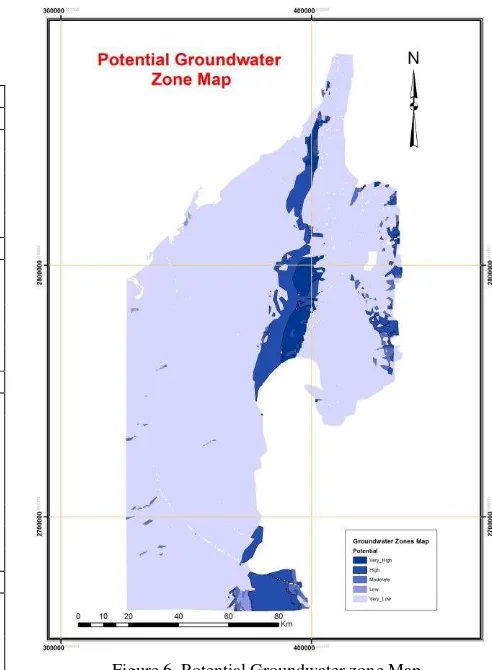
After combining all previous layers groundwater zone map, is re classified from 1 to 5 as shown in Table 3. Figure 6 shows
Table 1. Assumed weights of various Layers
Figure 6. Potential Groundwater zone Map
It has to be mentioned that the high zone class shown in the Figure 6 has the least slope which has a value of (1 out of 5). The geology layer that covers this area is (Alluvium) which has a value of (1 out of 5). The geomorphology layer that covers this area is (Al-bahada and Al-Palaya Plains) which has a value of (1 out of 5), The Hydrogeology layer that covers this area is (Conglomerate_And_Gravel) which has a value of (1 out of 5). The Soil Type layer that covers this area is (Torrifluvents) which has a value of (1 out of 5). In addition to the factors the weight of each factor and how its reflected to overall results appears in Figure 6.
influence on groundwater recharge, thus it was given the least level of effect. For this reason, each factor was given a specific weight of effect on groundwater storage. The weights in this study were determined according to literature review and expertise in various domains
It has to be mentioned that results were not tested and verified against available ground water aquifer data. Future work will focus in verifying and enhancement of the results by introducing more verified values for weights as well as exploring other various factors that may contribute towards changing potential ground water zones. Moreover, updating the reliability of digital maps has to be examined to ensure the quality and validity of final map. It necessary to mention that produced maps has to be improved and verified before adopting them for future work.
ACKNOWLEDGEMENTS
The authors would like to Acknowledge engineers; Seror Hadi, Alaa Karroum and Samah Ibayyan for their help and efforts of data processing and manipulation.
REFERENCES
Al Saud . M , 2010. Mapping potential areas for groundwater storage in Wadi Aurnah Basin, western Arabian Peninsula, using remote sensing and geographic information system techniques. Hydrogeology Journal . September 2010, Volume 18, Issue 6, pp 1481-1495
Dar. A, K. Sankar Mithas A. Dar . Remote sensing technology and geographic information system modeling: An integrated approach towards the mapping of groundwater potential zones in Hardrock terrain, Mamundiyar basin. Journal of Hydrology. Volume 394, Issues 3–4, 26 November 2010, Pages 285–295.
Dhabia W. M. Bakhit (1999). Environmental and Management Problems in The Hydrology Of The United Arab Emirates. Theses Submitted in Partial Fulfillment of the Requirements for the Degree of Doctor of Philosophy in the Department of Geological Sciences University of South Carolina.
Ganapurama S, G.T. Vijaya Kumara, I.V. Murali Krishnab, Ercan Kahyac, AND M. Cüneyd Demirel (2009). Mapping of groundwater potential zones in the Musi basin using remote sensing data and GIS. Advances in Engineering Software. Volume 40, Issue 7, July 2009, Pages 506–518
Gaura S, B.R. Chaharb, 1 and Didier Graillota (2011). Combined use of groundwater modeling and potential zone analysis for management of groundwater. International Journal of Applied Earth Observation and Geoinformation. Volume 13, Issue 1, February 2011, Pages 127–139
Machiwal, D., Jha, M. & Mal, B. (2011) Assessment of Groundwater Potential in a Semi-Arid Region of India Using Remote Sensing GIS and MCDM Techniques. Water Resources Management, 25:1359–1386.
Moghaddam. D, M. Rezaei, H. R. Pourghasemi & Z. S. Pourtaghie & B. Pradhan (2013). Groundwater spring potential mapping using bivariate statistical model and GIS in the Taleghan Watershed, Iran. Arabian Journal of Geosciences
Vasanthavigar M, Srinivasamoorthy, K Vijayaragavan, S Gopinath, S Sarma (2011). Groundwater Potential Zoning in Thirumanimuttar Sub-Basin Tamilnadu, India—A GIS and Remote Sensing Approach . Geo-spatial Information Science 14(1):17-26 Volume 14, Issue 1.