DOCUMENTATION, MULTI-SCALE AND MULTI-DIMENSIONAL REPRESENTATION
OF CULTURAL HERITAGE FOR THE POLICIES OF REDEVELOPMENT,
DEVELOPMENT AND REGENERATION
A. De Masi
ABC, Dept. of Architecture, Built Environment and Construction Engineering, Milan Polytechnic, II School of Architecture, Via Durando 10, 20158 Milan – [email protected] - [email protected]
Commission VI, WG VI/4
KEY WORDS: Smart Cultural Heritage, Reading Criteria for Cultural Heritage Documentation, Multi-scale Representations, 2D/3D digitization of Cultural Heritage, Open Source Smart System
ABSTRACT:
The paper describes reading criteria for the documentationfor important buildings in Milan, Italy, as a case study of the research on the integration of new technologies to obtain 3D multi-scale representation architectures. In addition, affords an overview of the actual optical 3D measurements sensors and techniques used for surveying, mapping, digital documentation and 3D modeling applications in the Cultural Heritage field. Today new opportunities for an integrated management of data are given by multi-resolution models, that can be employed for different scale of representation. The goal of multi-scale representations is to provide several representations where each representation is adapted to a different information density with several degrees of detail. The Digital Representation Platform, along with the 3D City Model, are meant to be particularly useful to heritage managers who are developing recording, documentation, and information management strategies appropriate to territories, sites and monuments. Digital Representation Platform and 3D City Model are central activities in a the decision-making process for heritage conservation management and several urban related problems. This research investigates the integration of the different level-of-detail of a 3D City Model into one consistent 4D data model with the creation of level-of-detail using algorithms from a GIS perspective. In particular, such project is based on open source smart systems, and conceptualizes a personalized and contextualized exploration of the Cultural Heritage through an experiential analysis of the territory.
1. INTRODUCTION
1.1 Objectives
The current thinking about urban intelligence and on the construction of smart cities is leading to a new concept of the future city, in which the relationship between contemporary reality and the historical city becomes an important factor in the re-thinking of urban “smartnes” through historical and artistic heritage within the virtual city of ICTs. Smart Cultural Heritage can be conceived as the identity of places through the implementation of smart technologies, knowledge and social inclusion, for total participation in the promotion of cultural heritage (Glaeser, 2011). The paper describes reading criteria for the documentationfor important buildings in Milan, Italy, as a case study of the research on the integration of new technologies to obtain 3D multi-scale representation architectures. Moreover affords an overview of the actual optical 3D measurements sensors and techniques used for surveying, mapping, digital documentation and 3D modeling applications in the Cultural Heritage (CH) field. Today new opportunities for an integrated management of data are given by multi-resolution models, that can be employed for different scale of representation. The goal of multi-scale representations is to provide several representations where each representation is adapted to a different information density with several degrees of detail. My goal is to propose a multi-scale 3D City Model (3DCM) production and use a method to handle all different kinds of level-of-detail (LoD) of a 3DCM and various heterogeneous LoDs of a complete urban city model. According to the international CityGML standard, a virtual 3DCM is a digital representation of urban space that describes geometrical, topological and appearance properties of its components with an explicit LoD. In general, a 3DCM serves as an integration
platform for multiple facets of an urban information space; it also represents visual features for continuous scaling, and evaluates the similarity between generalised models and original ones. The Digital Representation Platform (DRP) (De Masi, 2014), along with the 3DCM, are meant to be particularly useful to heritage managers who are developing recording, documentation, and information management strategies appropriate to territories, sites and monuments. The DRP is a complex multidimensional system of an architectural reality representation, capable of combining metric and dimensional qualities with sensitive-perceptive qualities. DRP and 3DCM are central activities in a the decision-making process for heritage conservation management and several urban related problems. This research investigates the integration of the different LoDs of a 3DCM into one consistent 4D data model with the creation of LoDs using algorithms from a GIS perspective. In addition this study proposes a research methodology for 5D data modelling that fully integrates 2D/3D space, time and scale aspects of a geo-information domain with mathematical theories on multidimensional modelling. The final theme will deal with the generation of LoD from a 4D hypercube in order to generate customised LoD. To the current methods of digitization of 2D/3D objects are introduced innovative strategies such as the extraction and automatic cataloging of information from digitized content, standardization of data bases belonging to the entire tourism industry, analysis and correlation of information through semantic engines and publication as Linked Open Data in adherence to the Europeana model (Vattano, 2014). In addition, the X3DOM framework is an experimental open-source framework and runtime developed by Fraunhofer IGD Visual Computing System Technologies (Chias & Abdad) that provides support in the currently on-going discussion in the Web3D and W3C communities on how HTML5 and declarative The International Archives of the Photogrammetry, Remote Sensing and Spatial Information Sciences, Volume XL-5/W7, 2015
3D content could be implemented. It is a framework that enables the integration of 3D content into Web pages without the need to forge new concepts as it relies on and utilises today’s standards. One of X3DOM’s main goals is to provide a live-interactive X3D scene in the HTML DOM that allows the developer to manipulate the scene’s 3D content by adding, removing and altering DOM elements. It also supports other HTML events such as the on-click event. Among the main problems that have emerged in this study I have to consider the alignment of current techniques to conventional codes of architectural representation and the organization the graphical documentation according to the building morphology. According to Falcidieno et al. (1998) the concept of shape encompasses instances of the object can be represented in a digital environment, independently from their use or size, considering that their geometrical nature is characterized by their spatial extension. Therefore, the digital models can be considered as the interface to various kinds of CH data. The possibility to combine records and geometric analysis about CH could also be used for developing new approaches for shape classification, interpretation and documentation. In addition, reasoning about the relationships between geometry and semantics and in a bidirectional analysis. The study from the methodological point of view has made use of the identification of levels of study (LS) differentiated, each of which is capable of identifying categories. With the integration of all the techniques used in this paper, a 3D model with a relevant rich database of information was obtained as an interface to share and visualize information with web-based tools. Here I report the results of the research on most significant architectural buildings in Milan and Venice, Italy.
2. MAIN BODY
2.1 Research Methodology
It was identified a methodology for reading that can return a survey aimed at evaluating changes induced by simultaneity through the decomposition of multi-scale representation of the parties examined by DRP. The realization of architectural sites multi-scale models was made possible by the geo-referencing process consisting in the insertion of local systems in less local systems. The research was articulated according to the DRP of the architectural and the urban landscape in order to improve current policies and standards. It is based by heritage information with integrated activities of recording, documentation, and information management to acquire knowledge, understand values and ensure long-term maintenance and conservation of heritage places. From a methodological perspective, the identification of LS has allowed me to identify categories of dimensional, constructive, formal values. For each category identified corresponds a method of appropriate documentation [photogrammetric survey methods, Building Information Managment (BIM), etc.] For space reason, in this paper only multidimensional and multiscale representations, photogrammetric survey methods and BIM will be reported.
2.2 Multidimensional Representation
Multi-Dimensional Representation is a hierarchically organised self-report instrument designed to assess distinct dimensions of identity of Milan, Italy. The dimensions assessed are: 1- Cultural and active identity. 2- Self-identification. 3- Cultural Engagement. 4- Traditions. 5- Intrinsic significance (Authenticity, Extent/Completeness, Integrity, Continuity of use/demonstration, Corpus of evidence/study). 6- Contextual
significance (Rarity, Representativeness /Uniqueness, Diversity, Physical context, Threat/fragility). 7- Associative significance (Historic interest and association, Aesthetic attributes). 8- Constitutive Representations. These were the steps followed for multi-dimensional representation: 1- Visual frameworks in the urban space. 2- Criteria of heritage significance and principles of evaluation of CH assets. 3- Study of current methods of 2D/3D digitization intended and Open Source for CH preservation. 4- Study of the relief procedures with integrated laser scanning and photogrammetry. About the relief of the elevated parts, scanning and relief stance optimization were considered. 5- Study of the relief integration methods applied to the plan and the elevated parts in order to define a one-3D system. This was to identify the invariant with respect to the scale of representation in the geometry of the object and then proceed to the geo-referencing. 6- Study of best practices for the realization of 3D models that are mapped to different nominal scales and with different levels of detail. 7- Study of scale changes in the individual models (site, architecture, details) with simplifications based on the selection and activation of geometric information from different nominal scales. 8- Accurate documentation of each cultural object, encouraging an integrated interdisciplinary approach. 9- Study of Open Source tools and software for CH fruition and conservation. The drawing should emphasize the multidimensional and multidisciplinary nature of the survey process which effectively provides a system for collecting, interpreting and storing quantitative and qualitative knowledge. With regard to the multidimensionality, it is worth recalling some basic concepts related to the so-called culture of space control. The geometric model, subject to a representation process, turns into a two-dimensional graphic model, that is a guaranteeing tool of the graphic model’s control mechanisms. The geometrical model reconstructed in a virtual form becomes a 3D digital model. Based to this approach, the multidimensional reality is reduced to its geometric essence.
2.3 Multiscale Representations by Data Cubes: Zoom Graphs and Multiscale Design Patterns
Multiscale visualizations are technique for facilitating the representation process because they change the visual representation to present the data at different levels of abstraction as the user pans and zooms. (Stolte et al.). Two types of abstraction are performed: 1- data abstraction for change the underlying data before mapping them to visual representations. 2- Visual abstraction for change the visual representation of data points to provide more information as the user zooms. DataSplash (Woodruff et al., 2001) and Pad++ (Bederson et al., 1996), focus on visual abstractions with support for data abstractions limited to simple filtering and the ability to add or switch data sources (Stolte et al.). My goal is to develop a system for describing and support multiple multiscale visualizations paths and both data and visual abstraction. Data cubes are a method for abstracting and summarizing relational databases. In addition, with Data cubes we can switch between different LoD. Data cubes provide a powerful mechanism for performing data abstraction. They provide summaries of the underlying data at different meaningful LoD and categorize information into two classes: dimensions and measures. This is achieved by building a lattice of data cubes to represent the data at different LoD according to a semantic hierarchy (Stolte et al.). Within a cube, the data is abstractly structured as an n-dimensional data cube. Each axis corresponds to a dimension in the data cube and consists of every possible value for that dimension (Stolte et al.). Each cell contains one value per measure of the data cube. If each dimension has a hierarchical The International Archives of the Photogrammetry, Remote Sensing and Spatial Information Sciences, Volume XL-5/W7, 2015
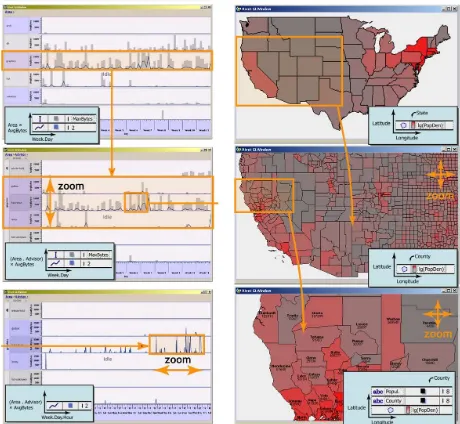
structure, then the data must be structured as a lattice of data cubes, where each cube is defined by the combination of a LoD for each dimension. Data abstraction in this model means choosing a meaningful summary of the data. (Stolte et al.). Specifying the LoD identifies the cube in the lattice, while the relevant dimensions identifies which projection of that cube is needed (Stolte et al.) (Figure 1). I present our system for describing multiscale visualizations that support multiscale visualizations as a graph, where each node corresponds to a particular set of data and visual abstractions. Each node can be described using a Polaris specification that identifies the representation and abstraction. In addition, it can be mapped to a unique projection of the data cube. Using the graphical notation I can describe and design these zoom graphs by nodes, the edges. (Figures 2). Today designing multiscale visualization is still a hard and challenging problem. In this study I present the following zooms: 1-Chart Stacks. 2-Thematic Maps. 3-Dependent Quantitative-3-Dependent Quantitative Scatterplots. 4- Matrices (Stolte et al.). The goal is to provide some guidance to others and to provide a formal way for exchanging design knowledge multiscale visualizations.
Figure 1. (a) The lattice of data cubes for a data base with three dimensions. (b) Several projections of the least detailed data
cube in the lattice. (Stolte et al.)
2.3.1 Vario-scale Geo-information in 3D City Models and Generation of Detailed Levels Starting from the Space-Scale 4D Hyper-cube
The multi-scale 3DCM implies a multilevel modeling and a multi-representation of the city model with different LoDs. The concepts of vario-scale and the smooth topological Generalized Area Partitioning (tGAP) structure represented by a space-scale partition (a 3D space-scale cube) were introduced by van Oosterom & Meijers. For 2D objects the resulting vario-scale representation is a 3D structure, while for 3D objects the result is a 4D structure (van Oosterom & Meijers, 2014). The vario-scale approach is an alternative for obtaining and maintaining geographic data sets at different scales. The principle of vario-scale is based on storing only the geometry of the most detailed layer and the additional objects that are created in a generalization process are stored by links to the original data (Suba, Meijers & van Oosterom, 2013). The principle of this structure is based on the creation of a tree structure. It starts with a planar partition at the most detailed level. The least important object is selected with the most compatible neighbour. The merging of objects is recorded in tGAP- tree structure. The tGAP structure can be seen as result of the generalization process and can be used efficiently to select a representation at any required LoD (van Oosterom & Meijers, 2014). The structure has very significant advantages over existing multiscale and multi-representation solutions. According Meijers et al., (2012) a vario-scale approach for 3D model offer the following possibility: 1- continuously zoom-in and out across LoD because the LODs are integrated in the 4D
Figure 2. From left, the Zoom Graph for the Chart Stacks Pattern, A series of screenshots of a multiscale visualization of
yeast microarray data (Stolte et al.)
data structure itself. 2- continuous representation of a city model not restricted to the arbitrary five fixed LODs. In fact, slicing the 4D data cube allows to obtain a 3DCM at any given LOD. The space-scale cube permits us to obtain an integrated 3DM, composed of both the dimensions of 2D space and 1D scale (van Oosterom & Meijers, 2011). From the 3D cube it is possible to extract a consistent 2D map at variable scale (van Oosterom & Meijers, 2011) (Figure 3). The generation of LoD from a 4D hypercube is specified as follows: 1- General (horizontal) slicing with a hyper-plane for the construction of a foundation for hyper-slicing in order to generate new levels of detail and their visualisation. 2- Integration of rules in slicing for a context-aware generation of levels of detail. 3- Assessment of continuous levels of detail.
Figure 3. Conceptual view of slicing a new intermediary LOD between a finer and coarser level in 4D (van Oosterom and
Meijers, 2011).
2.3.2 Generalisation of 3D City Models: Multiple Representations and Data Integration Strategy
In order to obtain multi-scale 3DCM at different LoDs, I have proposed to use a combination of following techniques: Extrusion, Generalization, Integration and Procedural modeling (LoDn). Generalization is the main technique used to derive coarser LoDs by removing unimportant details. The integration still cannot promise detailed models covering the whole city. Procedural modelling is a promising technique for geometry detailing with four different techniques applied in order to handle different initial models. With the generalisation methods, 3DCM in different LODs will be created automatically with multiple representations of the data structure, and different The International Archives of the Photogrammetry, Remote Sensing and Spatial Information Sciences, Volume XL-5/W7, 2015
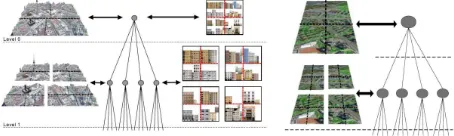
scales are integrated continuously. For 2D objects, tree structures are employed to represent the different map data in multi-scales (van Oosterom & Schenkelaars, 1995). BLG-tree is based on the Douglas-Peucker algorithm (Douglas & Peucker, 1973). Reactive-tree (van Oosterom, 1991) is based on R-tree and is used to represent the multiple geometric types, e.g. point, polyline and polygon in the node form. For 3DCM, based on R-tree, Coors (2003) proposed Progressive Tree to represent the hierarchical LODs of 3DCM. Compared with Rtree, P-tree has additional elements to store graphical information in this entry. Buchholz and Döllner (2005a) presented texturing atlas tree based on quadtree. Quadtree is created for all textures used by scene objects with texture atlases at different resolutions. Wen et al. (2009) also divided the 3DCM into regular tiles and generated a pyramid mode for multi-resolution virtual environment. The texture tiles are organised in quadtree structure where each texture is linked to a unique node in the tree with a coverage area. (Figure 4)
Figure 4. Structure of the texture-atlas tree (Buchholz & Döllner, 2005) and Structure of the texture quad-tree (Wen et
al., 2009).
2.3.3 3D City Model Methodology
With the proposed multiple representation structure for each LOD, the generalised 3DCM in different scales are integrated continuously. Then the dynamic visualisation strategies are discussed based on the multiple representation structures in different LODs. Finally, the generalisation results are evaluated by comparing the visual similarity between the original models and the generalised ones. First, the X3DOM based online visualisation framework is implemented by converting the 3DCM from CityGML into X3D files and updating the 3D scenes in the user browser using Asynchronous JavaScript and XML (AJAX). The multiple representation structures are created on each level to store the automatically generated generalisation results for dynamic visualisation (Biljecki et al, 2014). The input data of 3DCM in different format (KML/COLLADA, BIM) is converted into CityGML database and visualised using X3D. The geometry and texture definition in X3D are different from CityGML. In X3D specification, seven 3D geometry nodes are supported that are Box, Cone, Cylinder, Elevationgrid, Extrusion, Indexedfaceset, and Sphere. The surface in CityGML is composed by the polygons, and the Indexedfaceset in X3D is suitable to represent the set of polygons. According to the X3D specification, IndexedFaceSet node represents a 3D shape formed by constructing faces (polygons). (Biljecki, 2013). Besides the CityGML data, the 3DCM in KML/COLLADA format are also integrated in the proposed framework from LiDAR scanning and aerial photography. The advantages to the proposed integration framework are as follows: 1- CityGML supports both geometry and semantic information of the 3DCM for integrate data from different domains. 2- The framework provides a standard platform of 3DCM processing. 3- Such framework is extensible. Any data in the new format can be integrated into the framework by just creating the method to extract its geometry or semantic information.
2.4 Documentation, Processing and Data Integration of Cultural Heritage
The 3D digital construction and documentation of existing heritage buildings is a complex undertaking that typically involves a hybrid approach to visualization of heterogeneous datasets (El-Hakim et al. 2004; Remondino et al 2009). The digital 3D acquisition of objects and structures is generally performed by means of passive techniques (image-based methods) such as photogrammetry (Remondino, El-Hakim, 2006), active sensors (range-based methods) or an integration of active and passive techniques (Guidi et al., 2009). One type of documentation is the so-called direct survey, which involves measuring in direct contact objects. A second type is related to the use of indirect techniques that make use of, for example, total stations, Global Navigation Satellite System (GNSS) and 3D optical instruments, which offer several advantages over the direct acquisition techniques: (i) the time used to perform the survey is much shorter and the accuracy is higher; (ii) they do not require contact measurements avoiding possible damages to archaeological objects; (iii), a wide range of low cost sensors and processing algorithms have recently become available (Remondino, 2010). The introduction of digital systems for analysis and CH’s interpretation included: 1- a drawing as a complex and comprehensive system capable of combining metric and dimensional qualities with sensitive-perceptive qualities. 2- a drawing as a complex multidimensional system of an architectural reality representation. In addition, the interrelation of the concepts of dimensional representation to other aspects related to the culture of antiquity and conservation. The objective is to explore the relations between the elements of a given space-object. 2- the intentional evaluation of the data collected to establish criteria for segregation, distinction and order in the representation of the architecture. In the survey’s development, one can notice a dichotomy between the phase of data acquisition, increasingly dependent on the use of new “objective” 3D scanning technologies, and the ways in which the analysis is carried out in place of the studied object. The traditional approach, in this case, would consider the detection phase as complimentary of a preliminary study phase able to set the measurement possibilities. Detection and analysis would basically merge into one act. Most recent techniques have actually clearly separated the two moments. Data by the survey of the Milan monuments were computerized and compared with the models of the new configuration of some buildings. The analysis was conducted either through the integration of data by three-dimensional digital photogrammetry that with the creation of 3D models of the current state. These models are suitable for geometric comparison. This allowed a reflection on the performance offered by digital tools dedicated to photogrammetry.
2.5 The Geometrical Structure of the Forms that Presides Over the Creation of Architectural Models of the Past
The geometrical structure of the forms that presides over the creation of architectural models of the past is part of a comprehensive and proportionate system. The mathematical rule together with the geometrical order represented the base of any artistic expression, therefore the concept of beauty did not refer exclusively to the exterior aspect, but it was linked to a system of rules and well-defined harmonic ratios taken from the natural and pagan world. In recent years, studies were carried out on the geometric and modular analysis of designs of ancient and modern architectural projects identified graphical models that are fundamental for the graphical and architectural construction of the detailed works. In the nineteenth century The International Archives of the Photogrammetry, Remote Sensing and Spatial Information Sciences, Volume XL-5/W7, 2015
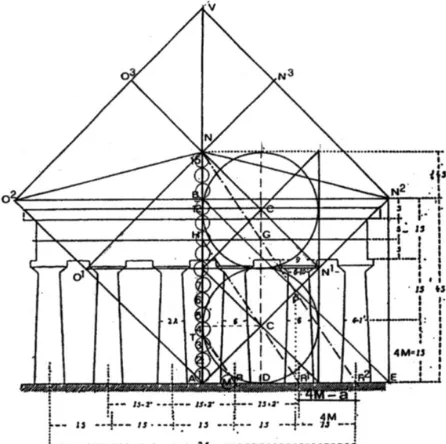
Francois-Auguste Choisy (1841-1909) carries out important studies on the modularity of classical architecture whereby it is interesting to mention the graphic model of the main facade of the temple of Neptune in Paestum (Argive Hera) as an expressive and rigorous tool to locate the architectural form of the real project. The study carried out directly on the original drawings by Choisy is synthetically reported.The geometric matrix applied to the original designs is made of three squares, AO1NN1 and AO2VN2 being overlapped and inclined of 45° with respect to the base and a third one AEN2B leaning against the base of the temple being as wide as the semi-diagonal of the great square AO2VN2. This structure results to be decisive for the construction of the architectural membering and image of the temple (Figure 5). The squares AO1NN1and AO2VN2, tilted and overlapping, are among their employees because the golden rectangle O1O2O3N and N1N2N3N, derived from the initial square AO1NN1 go to form the shape of the large square AO1NN1.The diagonals of the inclined squares AO1NN1, AO2VN2 and of the golden rectangles O1O2O3N e N1N2N3N respectively coincide with the line of the abacus sets O1N1, with the horizontal frame O2N2, with the axis of symmetry of the temple and the slope lines of the pediment. The remaining square AEN2B has the horizontal side of the frame coinciding with the middle of the temple frame BN2, while the vertical side divided into three equal parts determines 1/3 of the total width of the frame of the metopes and trabeation band, and the remaining 2/3 the height of the column up to the trabeation. The height of the temple AV is 15 times the radius of the base column, while the middle of the frame BN2 (where the third square is located) is 12 times the radius of the base column. Hence the width of the frame up to the trabeation is 4 times the radius, while the columns are equal to 8 times the same radius. The radius of the base of the column is the module governing the size of the image of the main facade of the temple. The building has a vertical record of 15 modules (AV) and one horizontal of 12 modules, the arrangement between the modules of the squares leads to determine the location of the centers of the columns. The projection of the vertex N passing through the point P (center of the diagonals of the third square) determines the position of the center R of the corner column from which the distances of the centers of the other two columns, R1 and R2, are positioned, each being distant 4 modules. Finally, the division of the side of the square AEN2B into 15 parts instead of the 12 above allows to find the radius of the column at the middle of its height and thus define the taper of the columns. The scholar Francois - Auguste Choisy however did not complete the research work to solve the corner of the temple and the displacement of triglyphs and metopes, as well as the accommodations between the distances of the columns. The most recent studies, in fact, have indeed confirmed the existence of five modules used for the construction of the image in all its parts to correct the optical distortion. This process can be understood as a methodology to value algorithmic.
2.6 Architectural Surveying as Reverse Engineering Process
Photogrammetry is cited, as it checks out the project’s feasibility through necessary topographic measures that will allow a stereophotogrammetric model generation. Here, the phase of data acquisition appears clearly distinct from the other. This approach is also suitable to the 3D scanning technology. The creation of three-dimensional representation of CH requires methodologies digitally acquire, interpret and describe the morphological features and visual appearance (Cowley, 2011). The analysis of architectural elements may be performed by
Figure 5. Paestum, Italy - Temple of Neptune. General form of the Temple on the design of Francois-Auguste Choisy. (De
Masi, A.)
geometrical construction that allows to know the shapes. In addition, digital surveying is considered as a cognitive action for analyse relations between shape, geometry and architectural sense. The survey represents the body of a theory-operation, through which we come to know the material elements of a CH (Docci & Maestri, 2009). It should emphasize the multidimensional and multidisciplinary nature of this process which effectively provides a system for collecting, interpreting and storing quantitative and qualitative knowledge. The surveying is indeed a reverse process in which, starting from an existing object, one rebuilds the process of its realization, by interpreting the idea of design, wich comes before its realization (Migliari et al., 2000). The idea of my research is to organise the documentation and to link it to a semantically structured 3D model. This model is defined by geometry information hierarchically classified. Semantically-annotated 3D models are used as medium to propagate/distributc semantic layers directly to iconographic sources (De Luca). The relation between 3D models and 2D images is created by means of procedures for the spatial referencing of images (De Luca). By aligning images to the 3D mode, the 3D mode contour is automatically projected on the 2D image with the goal of superposing a semantic layer on the original iconography (De Luca). At the functional level, this method allows positioning iconographic sources on a reality-based 3D representation ofthe related building. (De Luca)
2.6.1 Geometrical Shape of Architectural Elements
According to De Luca et al. (2006) I proposed a method, founded on the analysis of invariant and morphological specificities, for the 3D reconstruction of architectural elements starting from relevant profiles. It can be extracted from a semantic segmentation of the building morphology. In fact, the complexity of shapes was influenced by the methods of geometrical control. The interpretation and the knowledge of the shape is organised according to two levels of description: geometry and semantics. In particular will be necessary the definition of techniques of geometric modelling and the identification of the relationships that can establish between the parts. The geometric description is based on tbe relations among The International Archives of the Photogrammetry, Remote Sensing and Spatial Information Sciences, Volume XL-5/W7, 2015
generic nodes describing tbe construction of tbe element from tbe definition of its geometrical atoms to tbe complete generation of its surfaces (De Luca) (Figure 6). The semantic description level is defined by a structure of concepts organized around the geometrical description. (De Luca). The potentialities of the recent dense image matcbing approacbes (Hirscbmueller, 2008; Furukawa and Ponce, 2010) bave sbown very promising results and renewed attention for image-based modelling as an inexpensive and practical solution for the 3D documentation of heritage artefacts (De Luca).
Figure 6. 3D modelling based on the interpretation of geometrical nature of architectural elements, Primitive adjusted
on the point cloud (De Luca, L.)
Is important to explore ways to insert architectural semantics within the surveying procedure for allow an immediate reading of dimensional parameters. In addiition, it's necessary to investigate solutions for the shape segmentation but also the issues related to semantic annotation. (De Luca). I considered three phases from the analysis: a first phase consists of isolating concepts and associating to them parts ofthe shape; the second one allows establishing a graph of relations between these concepts according to an analysis purpose; the last one allows associating various geometric representations to the same morphological entity (De Luca). The first experimcnts on structuring heterogeneous data around the description of the morphology, did emerge a parallel issue conceming the possibility of visually explain the relationship between the 3D representation of a building and its conceptual description by means of graphs of concepts (Valentino Losciale et al., 2012). The construction of the graph starts with an automatic analysis of the 3D representation aimed to extract dimensional, hierarchical and topological attributes that can structure nodes and relationships representing the architectural composition (De Luca). Bilateral links between the 3D representation and the conceptual graph determine the displacement of the obsetvation point into the 3D scene by selecting a node of the description graph and vice-versa (De Luca).
2.7 Photogrammetric Survey Methods: Structure-from-Motion’ photogrammetry
This study present an emerging, low-cost photogrammetric method termed “Structure-from-Motion” (SfM) for obtaining high-resolution datasets at a range of scales. In addition, this metods is used for topographic reconstruction and application in remote areas. It allow, unlike the traditional photogrammetric methods, the camera pose and scene geometry simultaneously. This approach has been popularised through a range of cloud-processing engines, most notably Microsoft® Photosynth™
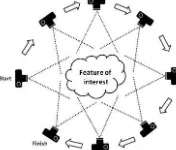
(Microsoft®, 2010), which uses SfM approaches documented in Snavely (2008) and Snavely et al. (2008) (Westoby et al., 2012). The development of this application allows to maintain both a high level of automation that precision. These tools are increasingly being used to integrate data produced by terrestrial laser scanner (LST). The homogeneity of the data produced by laser instrumentation and techniques SFM allows to work the same amount of information within the 3D workspace. This is done using a highly redundant bundle adjustment based on matching features in multiple overlapping offset images (Westoby et al., 2012). A comprehensive outline of the methods is used to create high-resolution digital elevation models (DEMs) from extensive photo sets and is compared with a similar model obtained using terrestrial laser scanning. This intercomparison reveals that decimetre-scale vertical accuracy can be achieved using SfMeven for sites with complex topography and a range of land-covers. (Westoby et al., 2012). SfM operates under the same basic tenets as stereoscopic photogrammetry, namely that 3D structure can be resolved from a series of overlapping, offset images (Westoby et al., 2012). (Figure 7). Geometry of the scene, camera positions and orientation are solved automatically and simultaneously using a highly redundant, iterative bundle adjustment procedure, based on a database of features extracted from a set of multiple overlapping images. The features are tracked from image to image, enabling initial estimates of camera positions and object coordinates which are then refined iteratively using non-linear least-squares minimisation. (Westoby et al., 2012). The 3D point clouds are generated in a relative “image-space” coordinate system, which must be aligned to a real-world, ‘object-space’ co-ordinate system. (Westoby et al., 2012). In most cases, the transformation of SfM image-space coordinates to an absolute coordinate system can be achieved using a 3D similarity transform based on a small number of known ground-control points (GCPs) with known object-space coordinates. (Westoby et al., 2012) (Figure 8). The aim of this study is to provide an introduction to SfM and a to describe a workflow that uses the available application bundle SFMToolkit3 to process the photographs and produce the initial point cloud. In additions, I documented the current state of the buildings in Milan by two different software: Photoscan of Agisoft and 123D Catch of Autodesk. In both cases, have been used set with a variable number of images (40 to 80 photogram) related to the entire facade of the buildings analyzed. By recognizing manual homologous points between images and the topographic survey, the models have been scaled and oriented respect the common reference system. The consecutive images show the values of deviation detected during the comparison between the geometric patterns produced by the two applications SfM and the reference model. The procedure of orientation of the photogram included the use of a number of points of support able to satisfy all the unknowns of the collinearity equations. The test was conducted using PhotoModeler Scanner EOS. Within the application they have entered the coordinates of the points of support, appropriately digitized and converted directly into DXF format. Using the manual recognition of the homologous points in the images I proceeded to orientate photogram (room resectioning).
Figure 7. Structure-from-Motion. (Westoby et al., 2012 The International Archives of the Photogrammetry, Remote Sensing and Spatial Information Sciences, Volume XL-5/W7, 2015
Figure 8. Building for offices (1949) in Milan, Italy (architect P. Lingeri). Image position around the building. Course of Architectural Drawing, Milan Polytechnic (De Masi, A.)
This method has helped to solve the internal and external parameters of the camera, thus restoring the condition of collinearity between the points of the object, the points of the image and the original position of the camera. The same time it was decided to digitize tcontour line; curves have been arranged spatially at a distance of 5 cm from each other. In addition the entire wireframe model was roto-translated into common reference system. The points belonging to the contour lines have been further used in the production of a triangular polygonal surface model. This is automatically obtained by applying the appropriate algorithms of triangulation. The next step was based on automatically generating of the point cloud dense (Dense Surface Modeler) from the pair of photograms. (Figure 9)
Figure 9. Building for offices (1949) in Milan, Italy (architect P. Lingeri). Reconstructed CH by Smooth Shaded Triangular Mesh and Vertex Painted Medium Quality Triangular Mesh.
Course of Architectural Drawing, Milan Polytechnic (De Masi, A.)
2.7.1 Image acquisition, keypoint extraction and 3D scene reconstruction
The key problem that SfM addresses is the determination of the 3D location of matching features in multiple photographs, taken from different angles (Westoby et al., 2012). The initial processing step in the solution of this problem is the identification of features in individual images which may be used for image correspondence (Westoby et al., 2012). A solution to this is the Scale Invariant Feature Transform (SIFT)
object recognition system. This is implemented in SFMToolkit3 that identifies features in each image that are invariant to the image scaling and rotation and invariant to changes in illumination conditions and 3D camera viewpoint (Lowe, 2004). Keypoints, dependent on image texture and resolution, are automatically identified over all scales and locations in each image, followed by the creation of a feature descriptor (Lowe, 2004). Density, sharpness, and resolution of the photoset determine the quality of the output point cloud data. Decreasing the distance between the camera will enhance the spatial density and resolution of the final point cloud. (Westoby et al., 2012). In addition, particular focus should be given to the choice of acquisition point and imagery combined from multiple platforms. Particular attention should be taken to maximise overlap by adopting short camera baselines and obtaining as uniform coverage of the feature or landscape of interest as possible (Westoby et al., 2012). Moreover, providing different levels of detail in different areas of the scene. Following keypoint identification and descriptor assignment, the sparse bundle adjustment system Bundler (Snavely et al., 2008) is used to estimate camera pose and extract a low-density or ‘sparse’ point cloud (Westoby et al., 2012). Tracks comprising a minimum of two keypoints and three images are used for point-cloud reconstruction, with those which fail to meet these criteria being automatically discarded (Snavely et al., 2006). Finally, triangulation is used to estimate the 3D point positions and incrementally reconstruct scene geometry, fixed into a relative coordinate system. (Snavely et al., 2006). The bundle adjustment package used in Bundler produces sparse point-clouds (Lourakis and Argyros, 2009). An enhanced density point-cloud can be derived by implementing the Clustering View for Multi-view Stereo (CMVS) (Furukawa and Ponce, 2007 and Furukawa et al., 2010) and Patch-based Multi-view Stereo (PMVS2) algorithms (Furukawa and Ponce, 2007).
2.7.2 Post-processing and Digital Elevation Model Generation
Transformation from a relative to absolute co-ordinate system is achieved through manual identification of GCPs in the point cloud and the computation of an appropriate transformation. (Westoby et al., 2012). The 3D point clouds generated using SfM may be extremely dense, potentially incorporating upwards of 103 points per m2. Direct interpolation of the raw point cloud into a typically coarser resolution terrain model represents a considerable computational task (Westoby et al., 2012). To improve data-handling and provide a first-order bare-earth elevation model, here we decimate the raw point cloud using a gridding procedure developed by Rychkov et al. (2012). This approach, originally designed to explore TLS point clouds, decomposes the point cloud into a regular grid, for which parameters of the local elevation distribution are extracted. (Westoby et al., 2012).This simple, but computationally efficient procedure allows easy extraction of terrain models based, for example on the local minimum grid elevation, while retaining information on the sub-grid elevation complexity for later analysis. (Westoby et al., 2012). SfM and point-cloud decimation potentially offer a powerful tool for analysis.
2.8 Building Information Modelling and Heritage Documentation
Building Information Modelling (BIM) is a tool for the representation, production, and management of the built environment. BIM software combines multi-dimensional visualization with comprehensive, parametric databases to facilitate collaborative design and facility management among The International Archives of the Photogrammetry, Remote Sensing and Spatial Information Sciences, Volume XL-5/W7, 2015
project partners (Russell & Elger, 2008). Proponents argue that the advent of BIM marks a radical transformation for the management of architectural information from conception through to building obsolescence (Eastman et al., 2008). The adoption of BIM for existing buildings/CH allow to move beyond rote 3D visualization through the incorporation of multifunctional, intelligent and multi-representational data (Arayici, 2008). The research focuses on automated data processing that leverages 3D point cloud data for the generation of a building. This is a novel and important area of technical research that employs the concept of an inventory model and identifies the BIM as a data hub for documentation is not fully explored. The inventory model captures both the past and present condition of an existing CH condition and recognition of BIM as a technology that addresses the growing demand for a multi-disciplinary knowledge base. This is essential to the management of life-cycle processes, development of the growing inventory of CH sites, identify the complex relationships between tangible and intangible heritage and monitor building performance parameters in urban cluster.
2.8.1 Multi-scale Heterogeneous Datasets and Time-based Representation of Historical Documents
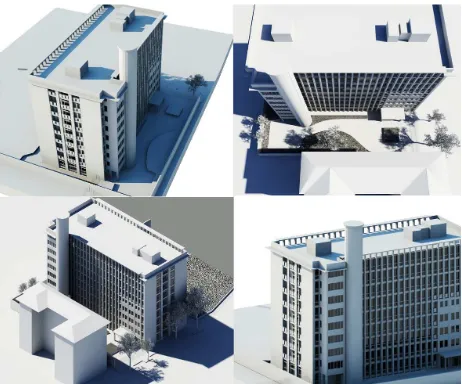
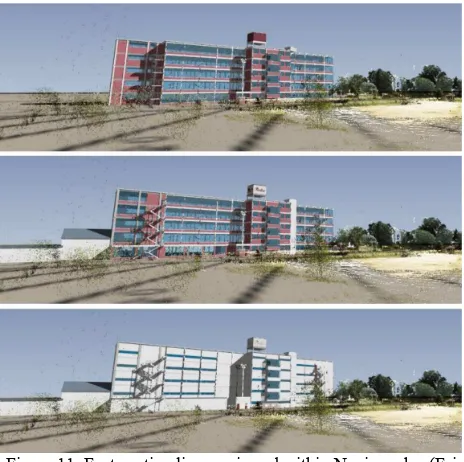
For Milan, Italy, I identified two separate scales: 1- Topographic Scale (Services Models). 2- Building Scale (Building Information Models). Topographic Scale is essential for obtain digital model of the terrain and to provide a valuable timeline of development of the town plan. I supplemented the study with a Digital Elevation Model (DEM) of the Milan, Italy and with my terrestrial laser scanning (TLS) registered through a global positioning system (GPS). The information were assembled in AutoCAD Civil 3D. In order to verify the accuracy of the model, considering the diversity of datasets, I cut a series of transverse and longitudinal sections through the current and digitized historical topographies, and compared them (Fai et al.) (Figure 10). Regarding the Building Scale, my approach to modelling the Milan CH is filtered through multiple data sets collected from laser scans, photographs and on-site inspections. As mentioned above, the existing workflows for leveraging point cloud data towards BIM is still in its infancy. In order to bring all of the pieces together into a single model, I adapted the functions of Navisworks, a robust project management tool that is able to integrate the diverse software required for the project. (Fai et al.). It creates a 3D environment that allows first person navigation, provides an presentation tool for prospective clients and retains the BIM of the objects that comprise the Model. This allows the viewer to examine the model at both micro and macro scales with no loss of fidelity or data. In addition, the software allows us to incorporate intangible heritage such as historical images and texts, multi-language story telling, and music (Fai et al.). Finally the Model can be viewed trans-temporally by employing the timeline function of the project management software. (Figure 11)
2.8.2 Future work
According to Pauwels et.al, 2008 I proposed an expanded approach to BIM through the development of Architectural Information Modelling (AIM). AIM facilitates the inclusion of "theoretical and historical" information in conjunction with “construction-minded, components based building information” (Fai et al.). Pauwels and others (Arayici 2008; Penttilä et al 2005; 2007) have to refine the language of BIM for foster parametric relationships between qualitative and quantitative data. I propose an extension of this logic to the integration of
Figure 10. Comparison of the terrain models in rendered 3D and graph form (Fai et al.)
Figure 11. Factory timeline as viewed within Navisworks. (Fai et al.)
documentation related to tangible and intangible heritage. (Fai et al.). The Model brings together heterogeneous data sets and data types into a single digital object that allows access to, and ongoing verification of, the individual assets that comprise the whole (Fai et al.). This includes data related to building type, construction, and performance, as well as material typically associated with intangible heritage such as storytelling and music. (Fai et al.). The most significant contribution of this technology to the field of heritage documentation is the ability to reveal time-based parametric relationships between tangible and intangible heritage assets. This has led us to speculate on an expanded role for BIM in heritage documentation. (Fai et al.)
3. Result and Conclusion
The paper describes reading criteria for the documentationfor important buildings in Milan, Italy, as a case study of the research on the integration of new technologies to obtain 3D multi-scale representation architectures. In addition, affords an overview of the actual optical 3D measurements sensors and techniques used for surveying, mapping, digital documentation and 3D modeling applications in the CH field. Today new opportunities for an integrated management of data are given by multi-resolution models, that can be employed for different scale of representation. The goal of multi-scale representations is to provide several representations where each representation is adapted to a different information density with several degrees of detail. Designing effective multiscale visualizations is still a challenging task. In this study I presented patterns that describe multiscale visualizations and encapsulate the changes The International Archives of the Photogrammetry, Remote Sensing and Spatial Information Sciences, Volume XL-5/W7, 2015
in abstraction.The Digital Representation Platform, along with the 3DCM, are meant to be particularly useful to heritage managers who are developing recording, documentation, and information management strategies appropriate to territories, sites and monuments. DRP and 3DCM are central activities in a the decision-making process for heritage conservation management and several urban related problems. This research investigates the integration of the different LoDs of a 3DCM into one consistent 4D data model with the creation of LoDs using algorithms from a GIS perspective. In particular, such project is based on open source smart systems, and conceptualizes a personalized and contextualized exploration of the CH through an experiential analysis of the territory. The analysis of architectural elements may be performed by geometrical construction that allows to know the shapes. In addition, digital surveying is considered as a cognitive action for analyse relations between shape, geometry and architectural sense.The study have shown that the knowledge is favored by comprehension and analysis of the geometrical shape of architectural elements. The research can be improved by connecting the iconographic collection to the building and by semantically annotating the morphology of buildings non only as a whole, but also in terms of their parts and subparts, their attributes and relations (De Luca). The rescarch focuses on methods and models integrated aiming to show innovative representation systems for the digital documentation. The approach is characterized by the integration of the architectural modelling with the analysis of the heritage documentation and the graphic representations. The research has led us to the following observations on the possible future for BIM in the field of heritage documentation and conservation: 1- a tool for the integration of cultural, and economic criteria in the management of heritage buildings. 2-functionality at multiple scales by integrating the documentation of both tangible and intangible heritage. 3. a web based resource related to materials and methods of construction.
REFERENCES
Arayici, Y. 2008. Towards Building Information Modelling for Existing Structures, Structural Survey, 26.3, pp. 210-222. Bederson, B. Hollan, J. Perlin, K. Meyer, J. Bacon, D. and Furnas G. 1996. Pad++: A Zoomable Graphical Sketchpad for Exploring Alternate Interface Physics. In J. of Visual Languages and Computing, 7, pp. 3-31.
Bederson, B. Meyer, J. and Good L. 2000. Jazz: An Extensible Zoomable User Interface Graphics Toolkit in Java. In Proc. UIST, 2(2), pp.171-180.
Chias, P. & Abdad, T. Open Source Tools, Landscape and Cartography: Studies on the Cultural Heritage at a Territorial Scale”, Intech, pp. 278- 294.
Biljecki, F. Ledoux, H. and Stoter, J. 2014. Redefining the level of detail for 3D models. GIM Int. 2014, 28, 21–23.
Buchholz, H. and Döllner, J. 2005. View-dependent rendering of multiresolution texture-atlases, IEEE Visualization. VIS 05, pp. 215- 222, 23-28.
Coors, V. 2003. 3D-GIS in networking environments, Computers, Environment and Urban Systems”, Volume 27, Issue 4, Pages 345-357.
Cowley, D. C. 2011. Remote Sensing for Archaeological Heritage Management. EAC Occasional Paper no. 5/Occasional Publication ofthe Aerial Archaeology Research Group no. 3, 307 pages.
De Masi, A. 2014. Advanced 3d Recording Techniques and Reality–based Modeling of Multi-scale for Digital Preservation of Cultural Heritage and Sites. In Proceedings of 3rd International Conference Heritage 2014. Barcelos, Portugal.
De Masi, A. 2011. Architectural Model and Complex Geometries. In the International Journal of the Image. Common Ground, Volume 1, Number 3, pp.163-173.
De Luca, L. 3D Modelling and Semantic Enrichment in Cultural Heritage.
De Luca L., Véron P. and Florenzano M. 2006. Reverse engineering of architectural buildings based on a hybrid modeling approach. Computers & Graphics, vol. 30, no. 2, pp. 160-176. Elsevier.
Docci, M. & Maestri, D. 2009. Manuale di rilevamento architettonico e urbano: Bari: Laterza.
Douglas, D., Peucker, T., 1973. Algorithms for the Reduction of the Number of Points Required to Represent a Digitized Line or its Caricature, The Canadian Cartographer, Vol.10, No.2, December 1973, pp.112-122
Eastman, C., Teicholz, P., Sacks, R., Liston, K. 2008. BIM Handbook: A Guide to Building Information Modelling. Hobken, NJ, John Wiley & Sons.
El-Hakim, S. Beraldin, J. Picard, M. Godin, G. 2004. Detailed 3d reconstruction of large-scale heritage sites with integrated techniques. IEEE Comput Graph Appl 24(3):21–29.
Falcidieno, B. & Spagnuolo, M. Shape-abstraction paradigm for modelling geometry and semantic. In Proceedings of the International conference on computer graphics. Los Alamitos, CA: IEEE Computer Society Press.
Fai, S. Graham, K. Duckworth, T. Wood, N. Attar. R. Building Information Mpdelling and Heritage Documentation.
Furukawa, Y., Curless, B., Seitz, M. and Szeliski, R. 2010. Clustering view for multi-view stereo. In Proceedings, IEEE Conference on Computer Vision and Pattern Recognition (CVPR), 13–18 June, San Francisco, USA, pp. 1434–1441. Furukawa, Y. & Ponce, J. 2007. Accurate, dense, and robust multi-view stereopsis. In Proceedings, IEEE Conference on Computer Vision and Pattern Recognition (CVPR), 17–22 June, Minneapolis, USA, pp. 1–8.
Fua, Y. Ward, M. and Rundensteiner E. 2000. Structure-based Brushes: A Mechanism for Navigating Hierarchically Organized Data and Information Spaces. In IEEE Trans. on Visualization and Computer Graphics.
Gamma, E. Helm, R. Johnson, R. and Vlissides, J. 1995. Design Patterns: Elements of Reusable Object-Oriented Software. Reading, MA: Addison-Wesley.
Glaeser, E. 2011. Triumph of the City: How Our Greatest Invention Makes Us Richer, Smarter, Greener, Healthier, and Happier, London: Pinguin Press.
Guidi, G. Remondino, F. Russo, M. Menna, F. Rizzi, A. Ercoli, S. 2009. A multi-resolution methodology for the 3D modelling of large and complex archaeological areas. Int. J. Architect. Comput. 2009, 7, 40-55.ICOMOS Charter for Interpretation and Presentation of Cultural Heritage Sites (www.enamecharter.org) Professionals in the Use of Information Technologies.
Lowe, D. 2004. Distinctive image features from scale-invariant keypoints. In International Journal of Computer Vision 60, 91– 110.
Lourakis, M.I.A. & Argyros, A.A. 2009. SBA: a software package for generic sparse bundle adjustment. ACM Transactions on Mathematical Software 36, 1–30.
Migliari R., Docci M., 2000. Geometria e Architettura. Gangemi, Rome.
Penttilä, H., Rajala, M., Freese, S. 2007. Building Information Modelling of Modern Historic Buildings, Predicting the Future, 25th eCAADe Conference Proceedings 2007, 607-613.
Penttilä, H. 2005. The State of the Art of Finnish Building Product Modelling Methodology, Learning from the Past a Foundation for the Future, Special publication of papers presented at the CAAD futures 2005, Vienna, 225-240. Wen, J. Wu, Y. and Wang, F. 2009. An Approach for The International Archives of the Photogrammetry, Remote Sensing and Spatial Information Sciences, Volume XL-5/W7, 2015
Navigation in 3D Models on Mobile Devices”, In: Stilla U, Rottensteiner F, Paparoditis N (Eds) CMRT09. IAPRS, Vol. XXXVIII, Part 3/W4 - Paris, France, 3-4 September, 2009. Westoby, M.J. Brasington, J. Glasser, N.F. Hambrey, M.J. Reynolds, J.M. 2012. Structure-from-Motion photogrammetry: A low-cost, effective tool for geoscience applications. In Geomorphology 179- 300–314.
Woodruff, A. Olston, C. Aiken, A. Chu, M. Ercegovac, V. Lin, M. Spalding, M. and Stonebraker M. 2001. DataSplash: A Direct Manipulation Environment for Programming Semantic Zoom Visualizations of Tabular Data. J. of Visual Languages and Computing, Special Issue on Visual Languages for End-user and Domain-specific Programming, 12(5), October 2001, pp. 551-571.
Remondino, F. El-Hakim, Girardi, S. Rizzi, S. Benedetti, A. Gonzo, S. 2009. 3D Virtual Reconstruction and Visualization of Complex Architectures - The 3D-ARCH Project. In Proceedings of ISPRS International Workshop 3D-ARCH 2009 “3D Virtual Reconstruction and Visualization of Complex Architectures”, Trento, Italy, 25–28 February 2009; Volume 38, Part 5/W10. Remondino, F. El-Hakim, S. 2006. Image-based 3d modelling: a review. The Photogrammetric Record 21(115):269–291. Remondino, F. Rizzi, A. Agugiaro, G. Girardi, S. De Amicis, R. Magliocchetti, D. Girardi, G. Baratti, G. 2010. Geomatics and Geoinformatics for Digital 3D Documentation, Fruition and Valorization of Cultural Heritage. In Proceedings of EUROMED 2010 Workshop “Museum Futures: Emerging Technological and Social Paradigms”, Lemessos, Cyprus, 8–13 November 2010.
Rundensteiner, E. Ward, M. Yang, J. and Doshi P. 2002. XmdvTool: Visual Interactive Data Exploration and Trend Discovery of High-dimensional Data Sets. In Proc. ACM SIGMOD 2002.
Russell, P. Elger, D., 2008. The Meaning of BIM, Architecture in Computro, Proceedings of the 26th eCAADe Conference, Antwerpen, September 2008, 531-536.
Stolte, C. Tang, D. and Hanrahan. P. Multiscale Visualization Using Data Cubes. Stanford University.
Suba, R. Meijers, M. and van Oosterom, P. 2013. 2D vario-scale representations based on real 3D structure”. In 16th ICA Generalisation Workshop, 2013, Dresden, Germany.
van Oosterom, P. & Meijers, M. 2014. Vario-scale data structures supporting smooth zoom and progressive transfer of 2D and 3D data. In International Journal of Geographical Information Science, 2014 Vol. 28, No. 3, 455–478 http://dx.doi.org/10.1080/13658816.2013.809724.
Snavely, N., 2008. Scene reconstruction and visualization from Internet photo collections, unpublished PhD thesis, University of Washington, USA.
Snavely, N., Seitz, S.N., Szeliski, R., 2008. Modeling the world from internet photo collections. In International Journal of Computer Vision 80, 189–210.
Snavely, N., Seitz, S.N. and Szeliski, R. 2006. Photo Tourism: Exploring Image Collections in 3D. ACM Transactions on Graphics, New York, pp. 1–12.
van Oosterom P. . & Meijers, M. 2011. Towards a true vario-scale nstructure supporting smooth-zoom. In Proceedings of 14th Workshop of the ICA commission on Generalisation and Multiple Representation & the ISPRS Commission II/2 Working Group on Multiscale Representation of Spatial Data, 2011, p. 19.
van Oosterom, P. and Schenkelaars, V. 1995. The development of an interactive multi-scale GIS”. In International Journal of Geographical Information Systems, 1995 pp. 489-507.
UNESCO Charter on the Preservation of the Digital Heritage, 2003.
Valentino Losciale L., Lombardo J., De Luca L. 2012. New
semantic media and 3D architectural models representation. Proceedings of IEEE VSMM 2012 - 18th Intemational Conference on Virtual Systems and Multimedia. Milan, ltaly, 2012.
Vattano, S. 2014. Smart Technology for smart regeneration of cultural heritage: Italian smart cities in comparison. In MWF2014: Museums and the Web Florence [Online]. Available: http://mwf2014.museumsandtheweb.com.