NON-TRIVIAL FEATURE DERIVATION FOR INTENSIFYING FEATURE
DETECTION USING LIDAR DATASETS THROUGH ALLOMETRIC
AGGREGATION DATA ANALYSIS APPLYING DIFFUSED
HIERARCHICAL
CLUSTERING
FOR DISCRIMINATING AGRICULTURAL LAND COVER IN
PORTIONS OF NORTHERN MINDANAO, PHILIPPINES
Ricardo G. Villar a, Jigg L. Pelayo a,*, Ray Mari N. Mozo b, James B. Salig Jr. b, and Jojemar Bantugan b
a,b Phil-LiDAR 2.B.11, College of Forestry and Environmental Science, Central Mindanao University,
Sayre Highway, Musuan, Maramag, Bukidnon, Philippines (jiggzportal, rgvforests)@gmail.com
Commission VIII, WG VIII/8
KEY WORDS: Image classification, OBIA, LiDAR, Allometric relations, Non-trivial feature derivations, Euclidean transformation
ABSTRACT:
Leaning on the derived results conducted by Central Mindanao University Phil-LiDAR 2.B.11 Image Processing Component, the paper attempts to provides the application of the Light Detection and Ranging (LiDAR) derived products in arriving quality Land- cover classification considering the theoretical approach of data analysis principles to minimize the common problems in image classification. These are misclassification of objects and the non-distinguishable interpretation of pixelated features that results to confusion of class objects due to their closely-related spectral resemblance, unbalance saturation of RGB information is a challenged at the same time. Only low density LiDAR point cloud data is exploited in the research denotes as 2 pts/m2 of accuracy which bring
forth essential derived information such as textures and matrices (number of returns, intensity textures, nDSM, etc.) in the intention of pursuing the conditions for selection characteristic. A novel approach that takes gain of the idea of object-based image analysis and the principle of allometric relation of two or more observables which are aggregated for each acquisition of datasets for establishing a proportionality function for data-partioning. In separating two or more data sets in distinct regions in a feature space of distributions, non-trivial computations for fitting distribution were employed to formulate the ideal hyperplane. Achieving the distribution computations, allometric relations were evaluated and match with the necessary rotation, scaling and transformation techniques to find applicable border conditions. Thus, a customized hybrid feature was developed and embedded in every object class feature to be used as classifier with employed hierarchical clustering strategy for cross-examining and filtering features. This features are boost using machine learning algorithms as trainable sets of information for a more competent feature detection. The product classification in this investigation was compared to a classification based on conventional object-oriented approach promoting straight-forward functionalities of the software eCognition. A compelling rise of efficiency in the overall accuracy (74.4% to 93.4%) and kappa index of agreement (70.5% to 91.7%) is noticeable based on the initial process. Nevertheless, having low-dense LiDAR dataset could be enough in generating exponential increase of performance in accuracy.
1. INTRODUCTION
God provides the human brain an innate capability in interpreting various forms of information. At the same time, because of our complex capability - the human brain can store, retrieve swiftly patterns and missing dots in a feature, and could do efficiently learning process. We are able to breakdown object features based in visualization by considering the properties of shape, colour, texture and other visually determinable parameters. Now, if this capability could be replicated and be exploited into an expert rule-based system for enhancing digital image interpretation – it would further thrust the level of feature extraction and detection. Many computer-aided classification methods have been developed since the early stages of remote sensing application in 1970 (Curran, 1985). But imitating this interpretation process confronts a dreadful task of converting through computer-guided image analysis because this would associate advance interpretation rules as well as complex pattern recognition not to mention the factor concerning the handling of complex datasets and its limitations.
Currently in the remote sensing industry, Light Detection and Ranging also known as LiDAR creates a huge attention fairly
based on its capability and product’s produce. Airborne digital scanners has revolutionized the quality of remotely sense information considering its notable high accuracy and geometric resolution. This Laser data supplies precise amount of height information that cannot be found in single optical images. LiDAR works through collecting reflectance actively via microwave wavelengths and ranging techniques respectively. LiDAR in addition with spectral imagery could provide rich amount of data for particular requirement and can contribute as ancillary data.
The ever-growing amount of information acquired by remote sensing technologies requires increasingly sophisticated methods for its analysis (Machala, 2014). Significant development has been observed in the field of remote sensing concerning expert oriented rule-based classification approach. Even so with this improvement, a lot of problem concerning misclassification of objects and distinguishing pixelated features cause by the closely related spectral resemblance still arises.
distance. Object-based classification is specialized at delineating or grouping meaningful objects from any form of remotely sense layers (either imagery or derived LiDAR features) which composed of several pixel. In the object base image analysis (OBIA), there are two significant processing factors that made it famous; segmentation and classification scheme. Segmentation is the step concerning image analysis where in it the image breaks into pieces, which serve as building blocks for further analysis and there is a choice of several algorithms to do this (eCognition Reference Book, 2014). Research suggested that image segmentation provides more objective delineation and extracting more information, incrementing the consistency of the resulting product in a much lower cost as well as reducing consumed time. Though relying heavily in segmentation does not necessarily capture the meaningful objects or the feature of interest visually. It is vital to take account the flow of the classification scheme coupled with scientific data analysis in garnering the position and shape of real objects. Extracted features from the resulting classification undergoes thorough examination considering its consistency and accuracy, then can be subject to further enhancement.
An unlikely concept to use for image classification was employed for this research, Allometric Aggregation Data Analysis which adopts plotting strategy of training data’s for finding out novelty features including parameters that will discriminate features. Complemented with Support Vector Machine, a machine learning algorithm that at the moment is gaining attention in remote sensing - will further thrust the image classification results and increased the accuracy exponentially. One of the important asset of AADA is generalizing well from limited quantity of training data. This limited well given data can be use further as training set for SVM in enhance classification results. The need for repeating classifier training is an added advantage at the same time.
As a major challenge in image and feature recognition considering computer vision, is determining the distance between images. Euclidean distance is the most commonly utilized in distance measures or data analysis all because of its simplicity among all image metrics. The process of utilizing the idea of Euclidean distance and customizing its principle is an added value for the research in deriving efficient and fast results. The research elaborates the functional used of the principle by improving powerful machine learning algorithms through simple straight forward embedding strategy.
The added approach has become consistent in improving our classification through this following reasons: basically minimized sampling numbers unlike from the usual machine learning algorithms, trimming down computing time of the process, and garnering efficient classification result even with low dense LiDAR dataset. Allometric aggregation and Euclidean norm transformation works hand in hand in resolving various complexity in the feature samples, datasets and the classification scheme itself. The fitting of these principles is rather ideal and not perfect in nature, some constrains are still out of reach – thus finding work rounds is still essential. The thought of examining the cloud of data in the feature space with unknown distribution could be rigorous. Because of the unestablished heuristics in selecting the sets of features that includes boundary parameters; trial and error approach is empirical.
2. PROPOSED METHODOLOGY AND MATERIALS
2.1 Study Area
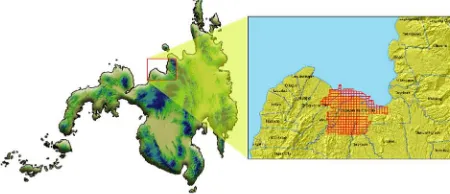
The area of interest is part of the LiDAR datasets for Central Mindanao University’s Phil-LiDAR 2 Project situated at the Province of Misamis Oriental, Philippines. The covered research area is 273.76 sq. km (27,376 ha) of land consisting a large of portion of the city of Cagayan de Oro and small part of the municipality of Opol. Based on the secondary data, 35% of the study site is forest and the rest is mainly agricultural and urban. Training and validation samples were gathered from the area of interest after being subject to data analysis. The classification process will soon be applied to three other municipalities namely Laguindingan, Gitagum, and Libertad to counter check whether the process is giving an increase in satisfactory result.
2.2 Datasets and Pre-processing
The study utilizes the following remotely sense data: Orthophoto for RGB Information and LiDAR dataset with average point density of 2 pts/m2. LiDAR derived features like matrices (DSM,
DTM, nDSM, returns etc.) were develop from the LiDAR dataset to further enhance the classification result.
Images were captured on the study site acquired on August 2013 – Orthophoto with spatial resolution of 0.5 x 0.5 meter for better distinguishing of vegetation, infrastructure and terrain features. The whole stretch of the study area based on laid out orthophotos is divided into a 1 km x 1 km tile which should relate to the parallel laser files. All the exploited data in the research were positioned using the spatial reference of WGS 1984 UTM zone Figure 1. Study site situated between the portions of Cagayan
de Oro and Opol, Misamis Oriental, Philippines.
51 North. Datasets including imagery used in the research was delivered by the Phil-LiDAR DREAM Program, personified by the University of Philippines Diliman - Training Center for Applied Geodesy and Photogrammetry. Raw LiDAR dataset underwent first level filtering stages from this institution which attest both translational and rotational correction of the data. The imagery was ortho-rectified prior to the applied specification performed by DREAM personnel.
Extracting quality LiDAR metrics and textures from the datasets were generated through Lastools. Lastools is a third party software that performs on multi-core batch-scripted LiDAR processing. Filtering noise like smoke, birds and power lines from the dataset is essential for any elevation interference that would affect the classification. Implementing parameters in Lastools is observed during the course of the process, separate standardized examination of the dataset which is basically divided in to two individual approach as pre-requisite before generating LiDAR derived features.
2.2.1 Pre-processing of Dataset: The image processing team conducted a series of LAS datasets and orthophoto pre-processing analysis to come up with refined technique of limiting the amount of error produce by this products in order to derived quality lidar information such number of returns, DTM’s, DSM’s, Intensity, nDSM and etc. Orthophotos with parallel derivatives will be working hand-and-hand to classify various levels of agricultural land cover with specified high value crops and tree species. This are the discovered issues and concerns regarding the dataset:
1. Orthophoto color fluctuation per tile. 2. Seems, Gaps and Pits/holes in the dataset.
3. Shifts in LAS and orthophoto (misalignment: either vertical or horizontal).
4. Misclassification of raw LAS file data that creates change in elevation with in objects.
2.2.2 Quality Checking of Dataset: LiDAR systems have been widely adopted for the acquisition of dense and accurate topographic data over extended areas. Although the utilization of this technology has increased in different applications, the development of standard methodologies for the quality assurance of LiDAR systems and quality control of the derived data has not followed the same trend. Standard quality assurance of a sophisticated dataset such as LiDAR information is vital pre-requisite in conducting pre-processing activity.
Cross examining via tedious quality assurance activity of the dataset is employed throughout the process for insuring the integrity of the datasets. Factors considered for quality checking are: (1) Checking Horizontal and Vertical shifts (and its values) with respect to LAS data and Orthophoto; (2) Checking color difference among adjacent orthophotos due to differences in exposure and other atmospheric conditions during actual image acquisition; (3) Checking misclassification of objects features in raw LAS data; and (4) Checking each tile whether it has multiple user data fields that tends to create a holes in the derivatives.
2.3 Segmentation Scheme and and Class Hierarchy pattern
The process of sub-diving and defining large homogenous visual figure (either photo or landscape) into identifiable objects is called Segmentation. eCognition Developer has the power to execute such process efficiently. High elevated objects which is assigned as two meters above, were segregated using contrast split segmentation algorithm via normalized digital surface
model (nDSM) layer which is 1 meter in spatial resolution. The algorithm evaluates the optimal threshold separately for each image object in the domain. Initially, it executes a chessboard segmentation of variable scale and then performs the split on each square, in case the pixel level is selected in the domain (User Guide eCognition Developer, 2014). Step size was set to 1 pixels and chessboard tile size is specified to 100,000 meters. Afterwards, applying remove objects algorithm for the small holes in the canopy and for the tiny objects that is considered high elevated. Every hole inside a canopy (any objects above 2 meters with holes) that has 25 pixels below will be filled and every high elevated object that is 30 pixels below will be removed to the high elevated class. By experience, these setting are close to ideal in terms of the dataset we are handling and for capturing the desired target. Some morphological operation were added to make the high elevated objects (canopy, building, etc.) cartographically pleasing.
To properly identify the complex variation of terrain, multi-resolution segmentation algorithm was utilized. Multi-multi-resolution segmentation works on calculating the given threshold set by the expert and partitioning the elected set of pixel into meaningful objects. Since high elevated features was identified then finding the detailed variation of elevation with regards to the middle and low elevation shall be done after. Applying very fine scale parameter which is 5 pixel; have the shape as 0.1 and the compactness of 0.2 – to properly capture the ideal formation of the terrain. Underlying this algorithm, layer weights favoured nDSM over the RGB information for the purpose of properly discriminating the change of elevation accordingly. The medium elevation ranges from 0.15 meter to 2 meter and surface level objects is 0.15 meter below.
After identifying both medium and low elevated objects, both features are merge separately and re-segment each one to create much coarser segmentation for extracting and capturing samples. The Inheritance type of class hierarchy was then utilized to further enhance the classification structure in parallel with the concept of allometric aggregation data analysis.
Inherited hierarchical clustering of classes is emphasized in the research to maximized filtering and separating effectiveness of every individual features. In this diffused clustered inherited approach of class, users could add multiple customized arithmetic features or image layer with thresholds paramount for discriminating individual features. What is amazing is it limits the assigning of multiple algorithms in the processing tree, thus your rule-set could be shorter but still be effective. Snapshot of segmentation dividing the whole image into three general classes - namely high elevated, medium elevated, surface level objects including the employed hierarchical scheme which are shown in Figure 3.
2.4 Allometric Aggregation Data Analysis
now” to the “there and then”. The research sees the necessity of scaling the data for it must be fractal. Thus a number of interesting connotations can be plotted or drawn. Scaling is the changes in body proportion often accompany changes in body size. The allometric scale is based upon the spread of data. If the dataset samples are tightly pack, it takes advantage of the power scale of less than one but greater than zero. Now given the data is cluttered, utilized the power scale of more than or equal to the value of one. Basically, the term scaling denotes a power-law relation between two variables X and Y.
X=AYα (1)
X signifies the portion being measured in relationship with the
size of a certain organism. Y is measure of size used for basis of comparison. The value A is the initial growth index and α as scaling exponent, which is proportional change in X per unit Y. The research captures only the concept of such relations for examining features and evaluating it through data analysis. Commonly, this kind of relation interrelates two properties of a given object or organism one of which is always base in size. But then, allometric relation is expanded to include measures of time series. We do not calculate the auto-correlation function. Instead, correlation within the data is determined by grouping the data into aggregates of two and more of the original data points and calculating the mean and variance at each level of aggregation (Sturmberg et al., 2013). Determining something remarkable using this aggregation concept, we generate a sample data points from a normal distribution from the extracted customize features and layers. Testing all the data points we obtain a boundary. It is evident that the logarithm of the standard deviation (σz) increases
linearly with the logarithm of the average, thus we have
logσz= αlogŹ + logA (2)
And comparing the two equations we obtain X = σz, Y =Ź, the
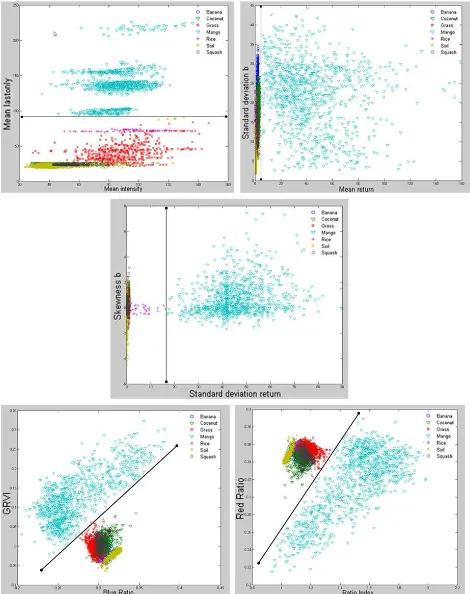
power-law index α is the slope of the line segment that can be drawn through the points on the graph and A = 1 for these computer generated data (Martin, 2013). From the evaluated data points, we established a working feature by feature combination to separate one feature sample to the other. The concept is not to split up every class in a cloud of samples individually – it would be very difficult finding correlated features to separate object class all because of the closely related spatial patterns and the
distinguishable spectral resemblance in terms of RGB information. Rather, find features (hybrid or not) that will discriminate one specific object to all other. Snippets of the one versus all class separation are viewed in Figure 4 with its corresponding separating layer features. The figure below shows the separating factor for mango against mixed features like banana, coconut, grass, rice and squash.
The approach of allometric aggregation as what is noted above works in scaling. Formulating a normalized customized arithmetic feature to make scaling possible through this define equation called Mean RGB radial.
Figure 3. General Segmentation breakdown and utilization of Inheritance type class hierarchy
([Mean r]2+[Mean g]2+[Mean b]2)0.5 (3)
This hybrid normalized feature could now be a complement to our RGB information. This could generate further coefficient for the imagery.
[Mean r]/[Mean RGB radial] (4)
[Mean g]/[Mean RGB radial] (5)
[Mean b]/[Mean RGB radial] (6)
Our extensive computation and examining the existing formulas brought forth another set of customized arithmetic features. This would be the difference between the systems of representation of colors.
((3*[Mean r]2)0.5/[Mean RGB radial])*(([Mean g]-[Mean
b])2)0.5 (7)
((3*[Mean g]2)0.5/[Mean RGB radial])*(([Mean r]-[Mean
b])2)0.5 (8)
((3*[Mean b]2)0.5/[Mean RGB radial])*(([Mean r]-[Mean
g])2)0.5 (9)
((3*[Mean r]2)0.5/[Mean RGB Radial])*(([G coefficient]-[B
coefficient])2)0.5 (10)
((3*[Mean g]2)0.5/[Mean RGB Radial])*(([R coefficient]-[B
coefficient])2)0.5 (11)
((3*[Mean b]2)0.5/[Mean RGB Radial])*(([R coefficient]-[G
coefficient])2)0.5 (12)
Note that this formulated equation is not tested on all sorts of datasets. Thus, there are no feasible claims that this equation would work to various imagery. The research faces fluctuating and ever changing illumination of orthophoto as-well-as low-dense LiDAR dataset. The study is on the verge of finding ideal and applicable derived equation through data analysis in the concept of allometric aggregation.
In better understanding Allometric Aggregation Data Analysis (AADA), comparison based on the application with SVM in finding optimal hyper plane is essential. Support vector machine works in cascading set of data and distinguishing different types of these data by adding one dimensional vectors. Increasing more of this one dimensional vector could create a good separating function for two classes only.
General step in AADA is plotting the data and finding out which features have good correlation. Extracting the allometric relationship among those features that has good correlation should be next. Execute any necessary repetition until you get the best allometric relations to find the separating feature – hybrid feature in that case, which is able to separate not just one but as many classes as possible.
In SVM, for example having seven classes to separate you shall need at least forty nine separating features with corresponding individual parameters. In other hand, AADA allows to reduce the number of separating features to a minimum of seven, same value as the number of classes. Often times, it would take the same number of hybrid features as the number of distinct classes or even less. The difficulty of finding the number of separating
features in SVM is diverted into the number of repetition in finding the best allometric relationship – the process is recursive.
Looking to the drawback of the concept of AADA, solving for the separating function is a precondition each time. Alternatively, it can be done by employing fitting function which is semi-automatic.
The best usage of AADA is when you apply it alongside with SVM. Reducing the number of repetition by taking some of the function based on the results garnered by SVM. In other words, AADA is most effective when it is complemented with SVM. But the thing anyone wouldn’t want about SVM is that it will be force to gather tons of sampling data with normalized population frequency to get the most feasible separating function. Now this is avoidable using AADA, because the concept only needs to get ample amount of samples just enough to define a prototype for each defining class.
2.5 Euclidean Norm Distance Transformation
Tackling the advantage of AADA working alongside with SVM in terms of added parameter customization for each class feature through inherited hierarchal clustering, a separate effective strategy is slightly added in the research for the machine learning operation to detect small perturbation in the dataset. A major challenge in image and feature recognition considering computer vision is determining the distance between images. Considerable efforts have been made in defining image distance that provide intuitively reasonable results. However, from the image and feature recognition point of view, many existing image distance suffer from some of the following disadvantages: (1) Difficulty in combining metric with those powerful image recognition techniques such as SVM, PCA, etc. (2) Computational measure is complicated (3) Processing time are difficult to predict, most of time – it takes long time.
Euclidean distance is the most commonly utilized all because of its simplicity among all image metrics. Let x, y be the two M by
N images, noting that x = (x1, x2,…, xMN), y = (y1, y2,…, yMN), where you have xkN+l, ykN+l are the gray levels at location (k,l). Thus, the Euclidean distance dE (x,y) is given by
( , ) = ( − )
However, such distance measure’s suffers from high sensitivity even to small deformation. Euclidean distance gives counter intuitive result. Spatial relationships between pixels are basically common in images. The traditional Euclidean distance is only a summation of the pixel-wise intensity differences, and consequently small deformation may result in a large Euclidean distance (Wang et al., 2000).
This research takes advantage of the idea of normalization and scaling of classes, and detection of changes in terms of imagery information through the principle of feature-space Euclidean norm transformation. Applying this idea to feature/image recognition, such properties are possessed by the said concept: Relative insensitivity in small changes or deformation in images, and can be embedded in most machine learning or feature recognition techniques.
Although image metrics may be utilized for image recognition in a direct matching (nearest neighbor) algorithm, a key issue of an image distance is whether it can be embedded in other powerful image/feature recognition algorithm. One of the important
capability of this process is that it can easily embed in most existing machine learning algorithms like Radial basis function (RBF) in SVM which depends only on the Euclidean distance.
ℎ( ) = ∝ exp{− || − || }
Also called Eigenfaces method in human face recognition literatures, Principal component is one of those successful and mainly utilized classification technique. Basically it works in computing the eigenspace spanned by the leading eigenvectors which is a least square problem that involve Euclidean distance only.
K Nearest Neighbor algorithm is very basic common approach for implementing the recommendation system. KNN works in finding the most similar k number users as nearest neighbors to a given user, and predict ratings of the user for a given instance according to the information of the selected neighbors. This algorithm has a lot of variation and one of its key points is finding how to calculate distance of each user. Basically, the implementation of this process could go either by Euclidean distance, Mahalanobis Distance, Minkowski Distance or cosine similarity maybe an option.
In these algorithm, one often needs to compute for the Euclidean distance of images, i.e. ( – )TG( – ), for all pairs of images.
So, considering a large dataset this evaluation is extensive. However, these computation can be greatly simplified by introducing a linear transformation. Embedding in these technique is straightforward, instead of utilizing the traditional Euclidean distance in the algorithm use the computed Euclidean distance.
2.6 Classification through Multi-level Inherited Hierarchal Clustering of Contained Feature Objects
By utilizing the equations as customized arithmetic features for feasible separating function in the different classes concerning the distribution in the feature space, an expert based rule-set is created in eCognition developer. The classification scheme being presented in the research is based on inherited class hierarchal system where filters are found in every parent and child classes. Snapshots of hierarchal filters in class are found in Figure 5.
With membership function, the rule based development to form multidimensional dependencies is very clear and an adaptation is easily discriminated.
However, if one combines one-dimensional membership functions, the form of the resulting multi-dimensional membership function is restricted and often does not match to the necessary class description closely enough.
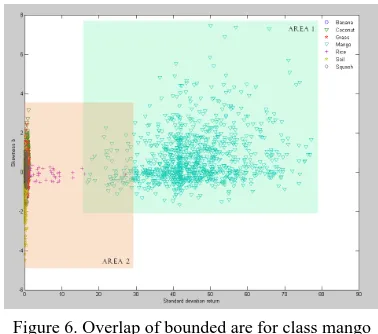
The above figure shows (figure 6), the factual distribution of class mango and other mixed class. To simplify the separation of class, the idea of one versus all (class) is applied in the research. But notice that there is an actual overlap of classes. Moreover, the membership functions describing the class “Mango” creates an overlap with the membership function describing the class “Rice” which is group together with the mixed classes. The area defined of these overlaps in the feature space increases with its number of dimension. When using two features to describe the class mango and the other classes, the areas defined by the range of one dimensional membership functions produce an enormous overlap. This overlap can be reduced if multi-dimensional membership function are directly designed.
Considering object-oriented approach, inheritance is when an object or class is based on another object or class, using the same implementation (inheriting from an object or class) specifying implementation to maintain the same behaviour (realizing an interface or inheriting behaviour). The relationships of objects or classes through inheritance give rise to a hierarchy. Thus the mechanism limits the probability of deviation when focusing in extracting specific features. When working alongside with machine learning operation like SVM, KNN, etc., this improves the restricting factor of each unique feature based from the derived training samples assuring increase in confidence level with regards to the overall result.
(14)
Figure 6. Overlap of bounded are for class mango versus mixed class.
Membership function is limiting the contained parameter of a specified layer feature, attesting the boundary values which conforms to the left border and right border as the minimum and maximum value to filter. In membership function, expression is editable – thus user could do customized version of a membership function depending on the necessity. For maximizing the capacity of membership function, list of logical operators are available via default and customizable at the same.
3. RESULTS AND DISCUSSION
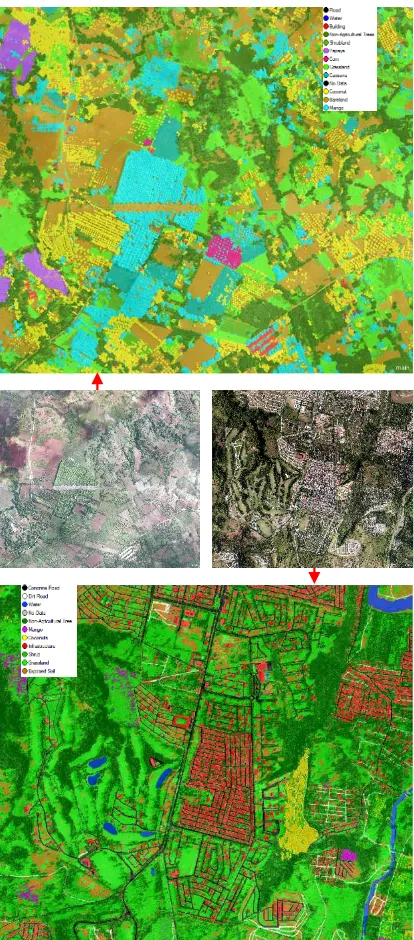
This sections aims to evaluate the feasibility and effectiveness of the detection technique. The research site specified at Figure 2 is divided into 4 classification scene due to its large extent. Results were generated in two different classification algorithms – Inherited Hierarchal decision tree using the concept of AADA and SVM classification complemented with AADA (alongside with Euclidean distance in images) concept. The resulting classification has fifteen class subjected to the allometric relations data analysis and further learned in SVM for optimal feature detection through image Euclidean distance transformation. In the first trial run, overall classification based on the samples of this classification is 93.4%. To counter check the performance of the rule-set scheme, we apply the model classification which was learned from the agricultural district of Cagayan de Oro and Opol in to different (adjacent) municipality namely; Laguindingan, Gitagum, and Libertad. Impressively, the analyzed AADA samples which is learned in SVM - complemented with the capability of Euclidian image distance garnered exponential results, overall accuracy made it up to 97% which can be seen in Table 1.
Figure 7. Classification result for the Original test site
Figure 8. Classification result from two separate municipalities (Libertad and Gitagum) with contrasting
illumination (having cloud shaded portions).
Table 1. Garnered statistics from different classification approach considering different test sites
Figure 9. Error Matrix based on TTA Mask (Laguindingan, Gitagum, and Libertad)
4. CONCLUSION AND RECOMMENDATIONS
We have exhibit the power of object-oriented analysis in image classification morphing the concept of Allometric relationship of features with a bit complementation of Euclidean norm distance transformation considering machine learning algorithm that is SVM in optimizing further its result. eCognition become the key in initiating segmentation, second level filtering and executing the classification. Our data analysis concentrates in finding ideal features and optimizing key equation from learned samples which is executed through Matlab and Microsoft Excel. Some generated equation is to boost the performance of machine learning algorithms. We have achieved 93% satisfactory rate from the first trial run having to use only pure AADA concept. The accuracy of the work become exponentially rising when unique sets of samples is added regarding the distribution of features. The learned AADA samples amplified in SVM became a much better optimized classifier yielding outstanding accuracy. But like all other optimized results being produced, the chance of causing the model to over-fit is still present. That is why checking this result to other adjacent location, in this case adjacent municipality - where learned parameters are the same including super features or equations in parallel with the original test site. Applying the rule-set model in the three other portions of Misamis Oriental, still yields with a satisfying results. The overall accuracy of the three subset scenes produced not less than 91% which is very gratifying in terms of the confidence level. This is to note that even in the different scene, considering our dataset, still resulted to satisfactory accuracy.
ACKNOWLEDGEMENT
We bring the Glory of our Lord Jesus Christ in everything we do – in Him all the honor and success is made possible. The research study is a product of the “Project 2.B.11: LIDAR Data Processing and Validation by HEIs for Detailed Resources Assessment in Mindanao: Selected Sites in Northern Mindanao (Region X)” which is personified by the Central Mindanao University.
All of this won’t be even possible without the support of our financial advocate – Department of Science and Technology (DOST) and the Philippine Council for Industry, Energy and Emerging Technology Research and Development of the Department of Science and Technology (PCIEERD-DOST) as the urgent monitoring agency of the said project. We very much appreciate the support of investing such technologies that will shape and thrust the future of the Philippines.
6. REFERENCES
Blaschke T., 2010. Object Based Image Analysis for Remote Sensing. ISPRS Journal of Photogrammetry & Remote Sensing, 65: pp. 2-16, http://dx.doi.org/10.1016/ j.isprsjprs.2009.06.004.
Bengio, Y., Paiement, J-Y., Vincent, P., Delalleau, O., Roux, N.L., Ouimet, M., 2003. Out-of-Sample Extensions for LLE, Isomap, MDS, Eigenmaps, and Spectral Clustering. Neural Information Processing System Conference. http://papers.nips.cc/paper/2461-out-of-sample-extensions-for-lle-isomap-mds-eigenmaps-and-spectral-clustering.pdf
Chiu, W.Y. and Couloigner, I., 2004. Evaluation of Incorporating Texture into Wetland Mapping from Multi-Spectral Images, http://las.physik.uni-oldenburg.de/eProceedings/vol03_3/03_3_chiu1.pdf.
Coffey, W. T., Kalmykov, Y. P., 2006. Fractals, Diffusion, and Relaxation in Disordered Complex Systems. Part B. –pp. 28-33.
Drake, J. B., Dubayah R. O., Clark, D. B., 2002. Estimation of Tropical Forest Structural Characteristics Using Large-Foot Print Lidar, Remote Sensing Environment, 79, pp. 305-319.
Green, B., 2002. Canny Edge Detection Tutorial, http://www.pages.drexel.edu/~weg22/can_tut.html
Hall-Beyer, M., 2006. The GLCM Tutorial Home Page, http://www.fp.ucalgary.ca/mhallbey/texture_calculations.htm.
Jakomulska, A., Clarke, K.C., 2001. Variogram-Derived Measures of Textural Image Classification, http://www.geog.ucsb.edu/~kclarke/Papers/Jakamulska.pdf.
Japitana, M., Candare, R. J., 2014. Optimization of the SVM Regularization Parameter C in Matlab for Developing Rulesets in eCognition.
Jensen, J.R., 2000. Remote Sensing of the Environment: An Earth
Resource Perspectiv, UpperSaddle River, NJ: Prentice Hall.
Jensen, J.R., 2005. Introductory Digital Image Processing, 3rd ed., Upper Saddle River, NJ: Prentice Hall.
Jovovic, M., 2015. Stochastic Resonance Synergetic – Quantum Information Theory for Multidimensional Scaling. Journal of Quantum Information Science.
Jia, Y., 2015. Object-based Land Cover Classification with Orthophoto and LIDAR Data. Master of Science Thesis in Geoinformatics, School of Architecture and the Built Environment Royal Institute of Technology (KTH).
Navulur, K., 2007. Multispectral Image Analysis Using the Object-Oriented Paradigm; CRC Press – Taylor & Francis Group.
Skirvin, S.M. et al., 2000. An Accuracy Assessment of 1997 Landsat Thematic Mapper, Derived Land Cover for the Upper
San Pedro Watershed (US/Mexico),
http://www.epa.gov/esd/land-sci/pdf/037leb01.pdf.
Sturmberg, J. P., Martin, C. M., 2013. Handbook of Systems and Complexity in Health.
Tiede, D., Hoffmann, C., Willhauck, G., 2012. Fully integrated workflow for combining object-based image analysis and LiDAR point cloud metrics for feature extraction and classification improvement.
Trimble Definiens A.G. (Ed.) (2014) - E-Cognition 9 Reference
Book. Trimble, Munich.
Verbyla, D., How to Lie with an Error Matrix, http://nrm.salrm.uaf.edu/~dverbyla/online/errormatrix.html.
Wang, L., Zhang, Y., Feng, J., 2005. On the Euclidean Distance of Images. IEEE Transactions on Pattern Analysis and Machine
Intelligence (Volume: 27, Issue: 8)