RECOGNITION OF DRAINAGE TUNNELS DURING GLACIER LAKE OUTBURST
EVENTS FROM TERRESTRIAL IMAGE SEQUENCES
E. Schwalbe, *, R. Koschitzki, H.-G. Maas
Institute of Photogrammetry and Remote Sensing, Technische Universität Dresden, 01069 Dresden, Germany (ellen.schwalbe, robert.koschitzki, hans-gerd.maas)@tu-dresden.de
Commission VIII, WG VIII/6
KEY WORDS: Time-lapse, image sequences, glacier lake outburst floods, feature tracking, glacier movement
ABSTRACT:
In recent years, many glaciers all over the world have been distinctly retreating and thinning. One of the consequences of this is the increase of so called glacier lake outburst flood events (GLOFs). The mechanisms ruling such GLOF events are still not yet fully understood by glaciologists. Thus, there is a demand for data and measurements that can help to understand and model the phenomena. Thereby, a main issue is to obtain information about the location and formation of subglacial channels through which some lakes, dammed by a glacier, start to drain. The paper will show how photogrammetric image sequence analysis can be used to collect such data.
For the purpose of detecting a subglacial tunnel, a camera has been installed in a pilot study to observe the area of the Colonia Glacier (Northern Patagonian Ice Field) where it dams the Lake Cachet II. To verify the hypothesis, that the course of the subglacial tunnel is indicated by irregular surface motion patterns during its collapse, the camera acquired image sequences of the glacier surface during several GLOF events. Applying tracking techniques to these image sequences, surface feature motion trajectories could be obtained for a dense raster of glacier points. Since only a single camera has been used for image sequence acquisition, depth information is required to scale the trajectories. Thus, for scaling and georeferencing of the measurements a GPS-supported photogrammetric network has been measured.
The obtained motion fields of the Colonia Glacier deliver information about the glacier’s behaviour before during and after a GLOF event. If the daily vertical glacier motion of the glacier is integrated over a period of several days and projected into a satellite image, the location and shape of the drainage channel underneath the glacier becomes visible. The high temporal resolution of the motion fields may also allows for an analysis of the tunnels dynamic in comparison to the changing water level of the lake.
* Corresponding author
1. INTRODUCTION
Glacier lake outburst flood events (GLOFs) occur when lakes that have been dammed by a glacier spontaneously start to drain through a subglacial channel underneath the glacier due to their outweighing hydrostatic pressure. In a short period of time, the lake water drains under the glacier and causes floods in downstream valleys. In many cases the latter become hazardous for people and their property. Because of the glacier movement, the tunnel will soon collapse, and the glacier lake refills, thus starting a new GLOF cycle. Further information about outburst events of ice-dammed lakes is given in Blachut & Ballantyne (1976) and Tweed & Russell (1999).
Due to global warming the frequency of glacier lake outburst flood events (GLOFs) increased during the past years and thus the scientific interest in these phenomena intensified (Dussaillant et al., 2010). While one issue of research in the
Terrestrial photogrammetric image sequence measurements (also referred to as time-lapse measurements) may be well suited to support both types of investigation. Since the first use
of automated time-lapse cameras for glaciological purposes (e.g. by Krimmel & Rasmussen, 1986) the technique has been further developed and proven to be a valuable tool for the investigation of near terminus areas of outlet glaciers (Maas et. al., 2006; Ahn & Box, 2010). Furthermore, photogrammetric image sequence analysis techniques were also successfully applied to serve as a virtual gauge within the framework of an early warning system for GLOF events (Mulsow et. al., 2013) or to investigate ice-dam collapses (Lenzano et. al., 2014). The presented work is a follow-up on earlier work on a photogrammetric GLOF early warning system. Starting in 2010, several permanent cameras have been installed east of the glacier dammed lake Cachet II in Chile to collect data about the lake water level and the ice dam during a GLOF event. While a stereo camera system and a NIR camera observed the opposite shoreline of the lake to measure water level changes (Koschitzki et. al., 2014) another time-lapse camera was installed with a view to the glacier dam in order to obtain information about the glacier’s behaviour during a GLOF event. In the present paper we focus on the glacier observing camera. The intention of the presented pilot study was to verify that vertical motion patterns of the glacier surface, derived from monoscopic image sequences, are a suitable database to localise a subglacial channel and to investigate the formation of the channel during a GLOF event.
2. DATA ACQUISITION
This chapter first introduces Colonia Glacier and Lake Cachet II, which are the area of investigation for this study. Second, the applied instruments and the measurement setup will be described.
2.1 Measuring Area
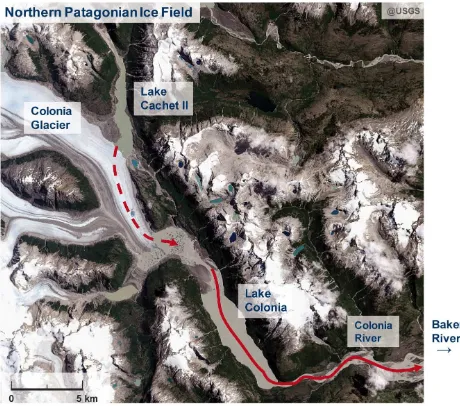
The Colonia Glacier is an outlet glacier in the Northern Patagonian Ice Field in Chile. It is located at the east side of the ice field and dams the glacier lake Cachet II (see Figure 1). The lake has a length of 8 km, a width of 1 km and a maximal depth of 100 m close to the glacier. The water volume amounts approximately 200,000,000 m3. The glacier’s terminus is about 6-7 km away from the lake. In 2008 the Cachet II drained for the first time through a subglacial channel of the Colonia Glacier causing a flood in the valleys of Colonia River and Baker River (Casassa et. al., 2009). The red arrows in Figure 1 show the path of the outrunning lake water. Since then GLOF events occurred at Cachet II one to three times per year.
Figure 1. Area of investigation. (Source: Landsat 8 OLI (L1T):18.01.14)
2.2 Instruments and Measurement Setup
To observe the ice dam of Lake Cachet II a Canon 1000D sheltered by a weatherproof housing and equipped with an external timer and a solar panel supported energy supply was firmly installed on a metal tripod (Figure 2, left). The camera was recording image sequences during several years and captured GLOF events in January 2010, February 2013 and February 2014. In 2010 the camera ran with a recording interval of 24 hours and was equipped with a 28 mm lens. This setup was changed to a recording interval of 20 minutes and a 20 mm lens in 2013.
The local topographical conditions would have impeded the setup of a stereo time-lapse system. Thus, for the present pilot study a monoscopic system was preferred. The scheme in Figure 3 shows the measurement configuration. The field of
view of the time-lapse camera contained most parts of the glacier where it had contact with the lake water as well as some solid rock in the foreground and parts of the mountains in the background. Due to wind effects and temperature changes camera motion cannot be avoided completely during the recording of an image sequence. In order to determine correction values for camera movement, fix targets were installed in front of the camera. Figure 2 (right) shows measurement images of the time-lapse camera before and after the drainage of the lake.
Figure 2. Measurement images: filled lake (top), empty lake after GLOF event (bottom).
Because of the use of a single measurement camera, an image block of 20 images was recorded additionally in order to scale and georeference the measurement values. For the definition of the geodetic datum the positions of the cameras and a tachymeter base line have been measured via GNSS. From both points of the baseline angle measurements have been conducted and height control points on the opposite mountain range were determined via spatial intersection.
Figure 3. Measurement setup
3. METHOD
The workflow of measuring vertical glacier motion from image sequences consists of three main steps: First, displacement vectors of features of the glacier surface have to be determined for image pairs. Second, the influence of camera motion has to be measured and compensated, and finally the image based measurements need to be scaled and thus transformed from image into object space.
3.1 Tracking
To obtain spatially high resolution measurements of the glacier area where a sub glacial channel might develop, a dense raster of points is defined within this region of interest in the first image of the image sequence. The rugged glacier surface allows for an area based feature tracking. Thus, for each of the raster points a rectangular patch was defined and displacement vectors were calculated using a least squares matching technique.
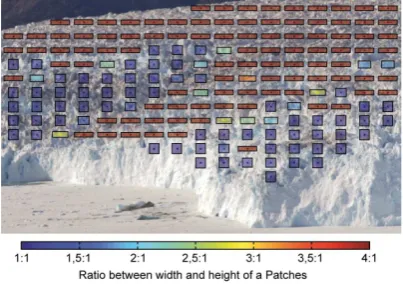
Because of the oblique viewing angle of the camera the application of rectangular patches is advisable to avoid excessive depth differences within a patch. If depth values are available for each pixel (see chapter 3.3) the ratio between patch width and height can be calculated individually for each point. With the constraints, that a certain limit of depth difference should not be exceeded for a patch on the one hand, but that the patch should contain a certain amount of pixels on the other hand, an optimal patch shape can be derived for each feature point to be tracked (Figure 4).
Figure 4. Patch shape definition depending on depth differences within a patch
With a temporal resolution of up to 20 minutes of the image sequences and 15 hours of daylight it would have been possible to obtain up to 45 displacement measurements per day for each glacier point. However, for the present study displacement vectors were only calculated for image pairs recorded with a time interval of 24 h. In these image pairs the feature tracking is most reliable because of the similar position of shadows and similar illumination due to the same position of the sun. Nevertheless, advantage was taken from the higher temporal resolution of the image sequences in terms of redundancy. Hence, the tracking could be made more robust by taking e.g. five subsequent images of the image sequence, pairing each of them with its 24 h partner and calculating the displacement vectors. The redundant vectors allow for outlier detection and averaging.
For the detection of a sub glacial channel, the motion behaviour of the glacier at a certain position is of interest (Eulerian approach) rather than the continuous tracking of a certain glacier feature (Lagrangian approach). Hence, a resulting trajectory for a glacier point is composed of discrete vertical displacement vectors that are derived from subsequent image pairs but have their origin in the same image coordinate. An advantageous side effect of the approach is that features cannot be lost and thus the tracking will not be aborted. This is especially important for long term observations. At Lake Cachet II, the vertical glacier motion caused by a GLOF event may last up to one month.
Figure 5 exemplarily shows the tracked vertical motion pattern of the glacier surface within 24 h at the beginning of the lakes drainage for a subset of the measurement image.
Figure 5. Vertical glacier displacement vectors in image space.
3.2 Camera motion compensation
The resulting trajectories for the measured glacier surface points are still influenced by the effects of camera motion. These effects can be determined by tracking static points. Usually it is a good choice to use signalized targets for this purpose. They can be designed to have high contrast and can be installed in a way that they will not be influenced by moving shadows. Thus, their application increases the accuracy and reliability of the tracking results.
In our case the topographic conditions at the measurement site did merely allow for the installation of three targets with an inappropriate distribution within the image. Therefore, we did not only rely on the signalized targets but mainly on a dense raster of natural points, that was defined on the bedrock in the image foreground as well as on the mountains in the image background. Because of the chosen 24 hour tracking time interval the tracking of the natural fix points was not much influenced by shadow movements and illumination differences. However, there still is a higher error rate for the tracking of natural points in comparison to signalized points. This has to be compensated by the high redundancy of the natural points and robust estimation techniques.
The effects of camera motion between two images were modelled by the 6 parameters of an affine transformation. For this purpose a displacement vector was determined for each point of the raster of static points. Start and end coordinates of each vector can then be introduced to the equations of the affine The International Archives of the Photogrammetry, Remote Sensing and Spatial Information Sciences, Volume XLI-B8, 2016
transformation. Each vector provides two equations, i.e. three static points would be sufficient to solve the equations and calculate the transformation parameter. In fact, up to 350 displacement vectors could be measured for each image pair (compare Figure 6 top). Hence, to take advantage of the highly over-determined system of equations on the one hand and to deal with the high rate of outliers on the one hand, the RANSAC (Random Sample Consensus) algorithm (Fischler & Bolles, 1981) was applied to robustly estimate the affine parameters. Figure 6 exemplarily shows the measured camera motion vectors (red) and the modelled camera motion (green vectors) as well as the resulting residuals (yellow vectors) for a subset (blue rectangle) of two subsequent images.
Applying the affine transformation to each feature point on the glacier surface, a correction value can be determined for each of the measured glacier motion vectors.
Figure 6. Modelling camera motion using natural static points. Measured camera motion (red vectors), modelled camera
motion (green vectors), residuals (yellow vectors)
3.3 Scaling and Georeferencing
The corrected glacier motion vectors are now to be transformed from image into object space. For this purpose depth information is required for each individual measurement point as well as the orientation of the time-lapse camera. This information was obtained by processing the recorded image block (also containing an image of the time-lapse camera) via bundle block adjustment. To compensate for the rather poor intersection geometry of the network, the positions of the cameras as well as their calibration values were introduced as
fix values. The photogrammetic network was stabilized by several height control points that could be measured on the opposite mountain range.
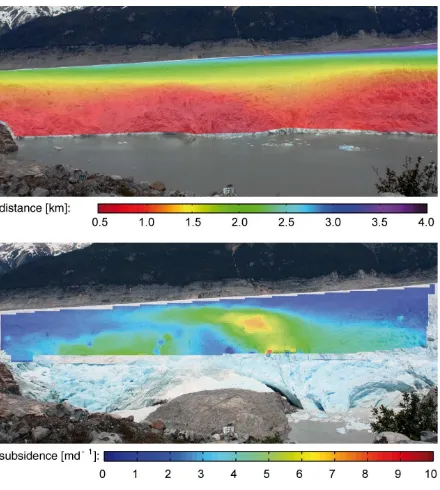
Besides the orientation parameter of the time-lapse camera, numerous object points on the glacier surface were obtained as a result from the bundle block adjustment. To determine the individual distance to the glacier surface for each pixel of the time lapse images (Figure 7, top), the glacier object points were triangulated and the image rays were intersected with the resulting TIN. The vertical components of the glacier motion vectors could then be scaled by the individual distance values (see Figure 7, bottom).
During the scaling procedure the main flow direction of the glacier as well as the tilt angle of the time-lapse camera has been considered (for further information see (Schwalbe, 2013)). However, due to the monoscopic approach the vertical component of glacier motion (mainly indicating glacier surface subsidence) can only be clearly distinguished from the horizontal component (mainly indicating glacier flow) if the horizontal glacier motion does not deviate from the main flow direction. It cannot be excluded that such deviations occur during a GLOF event but it can be assumed that horizontal motion deviations are small in comparison to the vertical motion. The mean flow velocity of the Colonia Glacier within the measuring area was determined with 0.8 md-1 along the centerline of the ice stream and 0.15 md-1 close to the ice dam. Thus, with regard to a qualitative analysis of the data, the horizontal motion deviations affecting the vertical component are negligible. An exact quantitative determination of the glacier surface subsidence would require a stereo time-lapse system.
The result of the georeferencing and scaling process are daily vertical motion fields of the glacier surface for the whole observation period. Furthermore, the spatial position of each scaled motion vector is known.
Figure 7. Distance between camera and glacier surface (top). Scaled subsidence of the glacier surface (bottom). The International Archives of the Photogrammetry, Remote Sensing and Spatial Information Sciences, Volume XLI-B8, 2016
4. RESULTS
This chapter describes three products that can be derived from the calculated motion vector fields. These results may form the data base for further glaciological analyses.
4.1 Daily subsidence rates
The vertical motion fields of the Colonia Glacier deliver information about the glacier’s behaviour before, during and after a GLOF event. In the present case, the temporal resolution of the motion fields is 24 hours.
The chart in Figure 8 (top) shows the measured lake water level during a GLOF event in 2010 (from Mulsow et. al., 2015). Below, the daily subsidence of the glacier is exemplarily depicted for four specific dates. The accordant measurement image is in each case overlaid by the colour coded vertical motion values. Thus, the formation of the subglacial drainage system can be documented during the whole GLOF cycle with high temporal resolution. Furthermore the results allow for an analysis of the tunnel dynamics in comparison to the changing water level of the lake.
Depending on the temporal progress of a GLOF event and the requirements of the glaciological analysis, the temporal resolution can be adapted. The method holds the potential to reduce the motion field time intervals to hours or even several minutes.
Figure 8. Daily subsidence rates
4.2 Visualisation of a subglacial channel
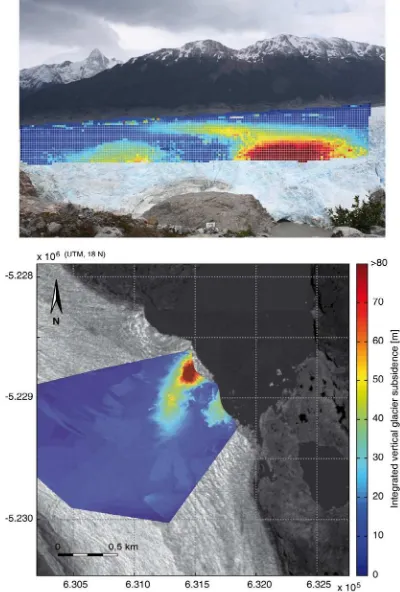
If the daily vertical motion of the glacier is integrated over a whole GLOF period (several days) and projected into a satellite image, the location and shape of the drainage channel can be visualised.
Figure 9 shows the glacier surface subsidence integrated over 35 days during the GLOF period in January 2010 (Jan. 4th – Feb. 10th) as a colour coded overlay of the measurement image (top) and as a projection into a satellite image (below). Within the cameras field of view, two tunnel entrances become clearly visible. The main tunnel is located northwest of a rocky hill on the bottom of the lake. Its propagation into the glacier can be measured up to one kilometre behind the tunnel entrance.
Figure 9. Visualisation of the subglacial channel in January 2010, as projection into a sequence image (top) and a satellite
image (bottom). (Source: GeoEye: 01.12.2011)
4.3 Annual Variations
Furthermore, the collected image sequence data allow for a comparison of different GLOF events. Location and dimension of the subglacial channels which had been formed during the three recorded GLOF events (2010, 2013 and 2014) were determined as described above. In comparison to the 2010 GLOF (Figure 9), the main tunnel entrance occurred closer to the northern shoreline of the lake in 2013, whereas in 2014 it was again located at a similar position as in 2010. In 2013 and 2014 the channel propagated not as narrow into the ice as in 2010.
The motion data show a wider area of subsidence to the west of the tunnel entrances (Figure 10).
Figure 10. Location of the tunnel entrances during the GLOF events in 2013 and 2014. (Source: GeoEye: 01.12.2011)
5. CONCLUSIONS
In this pilot study we present the successful localisation and change detection of subglacial channels during GLOF events via a terrestrial monoscopic image sequence analysis approach. For the example of Lake Cachet II, daily subsidence patterns were measured during three GLOF events. By integrating the vertical motion over several days, the location, shape and propagation direction of a subglacial tunnel could be visualised. Thereby, the three GLOF events in 2010, 2013 and 2014 showed a different behaviour of the tunnel and different positions for the tunnel entrance. The results may be a valuable base for further glaciological analyses and interpretations.
If the focus lies on the detection, visualization and a qualitative analysis of the formation of a subglacial channel, the monoscopic method is sufficient and practical. For an exact quantitative determination of the glacier surface subsidence, a stereo time-lapse system would be necessary.
With remote sensing approaches like SAR interferometry, glacier surface heights can be measured with high accuracy, but the methods are limited regarding to their temporal resolution. For the purpose of glacier dam observation, terrestrial photogrammetric techniques can be flexibly adapted to the measuring object and provide measurements at a very high spatio-temporal resolution, but are only applicable for accessible regions. Thus, a combination of both observation types would be desirable regarding measurement validation and to make the most of the methods complementary strengths.
In general the study shows that motion data of glacier surfaces obtained from terrestrial photogrammetric image sequence measurements can be used to indirectly draw conclusions about events occurring within or under a glacier.
6. ACKNOWLEDGEMENTS
We gratefully acknowledge the financial support by the DFG as well as the funding by the support program “support the best” of the Technische Universität Dresden. Furthermore, we would like to thank Gino Casassa for the cooperation in the project velocities from time-lapse photos: technique development and first results from Extreme Ice Survey (EIS) in Greenland. In:
Journal of Glaciology, 56(198), pp. 723-734.
Blachut, S. P.,Ballantyne, C. K., 1976. Ice-Dammed Lakes: A Critical Review of their Nature and Behaviour. Hamilton, ON: Department of Geography, McMaster University. Discussion Paper 6.
Clague, J. J.,Evans, S. E., 1994. Formation and failure of natural dams in the Canadian Cordillera. Geological Survey of
CanadaBulletin 464, 35 pages.
Dussaillant, A., Benito, G., Buytaert, W., Carling, P., Meier, C., Espinoza, F., 2010. Repeated glacial-lake outburst floods in Patagonia: an increasing hazard? In: Natural hazards, 54(2), pp.
469-481.
Fischer, M. A., Bolles, R. C., 1981. Random sample consensus: a paradigm for model fitting with applications to image analysis and automated cartography. In: Communications of the ACM,
24(6), pp. 381–395.
Huggel, C., Haeberli, W., Kääb, A., Bieri, D., and Richardson, S., 2004. An assessment procedure for glacial hazards in the Swiss Alps. In: Canadian Geotechnical Journal, 41(6), pp.
1068–1083.
Koschitzki, R., Schwalbe, E., Maas, H.-G., 2014. An autonomous image based approach for detecting glacial lake outburst floods. In: International Archives of Photogrammetry,
Remote Sensing and Spatial Information Sciences, 40(5), pp.
337-342.
Lenzano, M. G., Lannutti, E., Toth, C., Lenzano, L., Lovecchio, A. 2014. Assessment of ice-dam collapse by time-lapse photos at the Perito Moreno glacier, Argentina. In: International Archives of Photogrammetry, Remote Sensing and Spatial
Information Sciences, 40(1), pp. 211-216.
Mulsow, C., Koschitzki, R., Maas, H.-G., 2015. Photogrammetric monitoring of glacier margin lakes. In:
Geomatics, Natural Hazards and Risk, 6(5-7), pp. 600-613.
Krimmel, R. M., Rasmussen, L. A., 1986. Using sequential photography to estimate ice velocity at the terminus of Columbia Glacier, Alaska. In: Annals of Glaciology, 8, pp.
117-123.
Maas, H.-G., Dietrich, D., Schwalbe, E., Bäßler, M., Westfeld, P., 2006. Analysis of the motion behaviour of Jakobshavn Isbræ glacier in Greenland by monocular image sequence analysis. In:
International Archives of Photogrammetry, Remote Sensing and
Spatial Information Sciences, 36(5), pp. 179-183.
Schwalbe, E., 2013. Entwicklung von Verfahren zur Bestimmung räumlich-zeitlich hochaufgelöster Bewegungs-vektorfelder an Gletschern aus monoskopischen Bildsequenzen.
Technische Universität Dresden, Dissertation.
Tweed, F. S., Russell, A. J., 1999. Controls on the formation and sudden drainage of glacier-impounded lakes: implications for jökulhlaup characteristics. In: Progress in Physical
Geography, 23(1), pp. 79–110.