Design a filter to detect and remove vegetation from Ultra-cam-
x aerial images’ point cloud to
produce automatically digital elevation model
H. Enayati a , M. Veissy a*, F. Rahimpour b
a
MSc degree of photogrammetry, K.N. Toosi University of Technology, Tehran, Iran- ([email protected])
b
MSc degree of photogrammetry, K.N.Toosi University of Technology, Tehran, Iran- ([email protected])
c
MSc degree of RS&GIS, Faculty of Environment, Islamic Azad University of Science and Research, Tehran, Iran- ([email protected])
Commission VI, WG VI/4
KEY WORDS: Ultra-cam-x, point clouds, vegetation detection, filtering, DEM generation
ABSTRACT:
Digital elevation model is one of the most important spatial information for displaying bare earth. Because of existing objects on the ground, manual editing is unavoidable. Aerial images’ point clouds produced by advanced matching methods are good resources for generating DEM. In this paper, the purpose is design a filter for detect and eliminate vegetation from point clouds. For this purpose, point clouds’ texture is used for finding vegetation. Texture of point clouds is segmented by Otsu method. In the next step, segmented image is added to raster of elevation and vegetation elevation is detected. Results is showing that point clouds’ texture is a good data for filtering vegetation and generating DEM automatically.
* Corresponding author
1. INTRUDUCTION
DEM is one of important products of digital Photogramm- etry which is used for many application. Such as modeling landscape elevation, slope, and aspect characteristics for hydrologic, environmental, and urban/suburban applications (Rober, Jensen, Steven, Schill, & Schuckman, 2002). Methods for creating DEMs include situ measurement using surveying instruments (including the global positioning system), photogrammetric techniques based on stereoscopic aerial photography, interferometric synthetic aperture radar(IFSAR), and active light detection and ranging(lidar) technology(Jensen, 2000). Each method has strengths and weaknesses and produces DEM with varied accuracy(Rober et al., 2002).
Recently, with the advances in digital cameras, Aerial images have high spatial and radiometric resolutions. In addition, development in matching techniques is caused to produce dense point clouds from these images. High precision of these products to display anything on the ground and having texture information are some advantages of them; that can be used for producing DEM automatically, But point clouds is contained information of ground surface such as vegetation, buildings, etc.
To produce DEM from point clouds, these objects must be eliminated. Many studies have been presented to discover and remove objects from the point clouds. In general, the operation of removing non-ground points is called filtering. Various types of filtering methods have been proposed. Based on the filter strategies, these algorithms can be grouped into four major categories (Liu, 2008; Meng, Currit, & Zhao, 2010): interpolation-based (Axelsson, 2000; C. Chen, Li, Li, & Dai, 2013; Evans & Hudak, 2007; Kraus & Pfeifer, 1998; Mongus & Zˇalik, 2012), slope-based(Sithole, 2001; Vosselman, 2000), morphological-based(Q. Chen, Gong, Baldocchi, & Xie, 2007;
Y. Li, 2013; Pingel, Clarke, & McBride, 2013; K. Zhang et al., 2003) : and segmentation/cluster-based filters (Filin, 2002; Sithole & Vosselman, 2005; J. Zhang & Lin, 2013). Feng et al.(2009) combined slope based method and region growing for filtering urban areas in lidar data. Li et al.(2011)used morphological filter for DEM generation. In this study, the morphological opening operation is used on the basis of fake scan lines. polat et al.(2015) used Triangular Irregular Network(TIN) algorithm for filtering raw LiDAR data of an urban area for five different decimation rates and then used interpolation techniques for dem generation. Sithole and vosselman(2005) concluded that segment-based classification allows the use of more context information and therefore is able to preserve discontinuities in the bare- earth surface. It also faces no difficulties in removing very large buildings. Sithole and vosselman(2004) compared performance of eight filters for extract bare-earth points from point clouds and finally concluded that filters which estimate local surfaces are found to perform best .In addition, they expressed that using additional data like aerial photographs can support the classification. Also these additional information on a scene, if incorporated in filter strategies, potentially could provide a much better understanding of a scene and thereby improve filter performances.
Because of high radiometric and spatial resolution, texture information in aerial images’ point clouds is a reliable data for filtering. In the following, we design a segment-based filter used RGB information ,which is extracted of point clouds directly, for detecting vegetation from point clouds.
This paper is structured as follows: material and methodology is described in Section 2. Experimental results is discussed in Section 3 and in section 4, the conclusions are drawn with respect to the objectives set out.
The International Archives of the Photogrammetry, Remote Sensing and Spatial Information Sciences, Volume XL-1/W5, 2015 International Conference on Sensors & Models in Remote Sensing & Photogrammetry, 23–25 Nov 2015, Kish Island, Iran
This contribution has been peer-reviewed.
2. MATERIAL AND METHODOLOGY
2.1 data set and study area
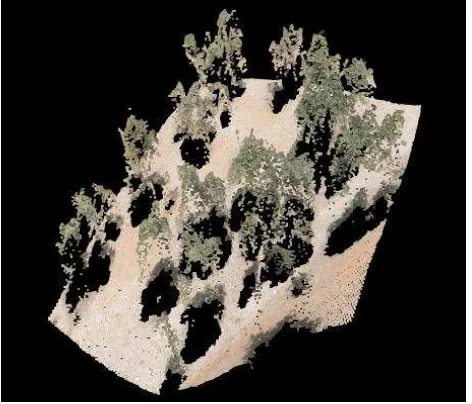
The study site is selected from around of Yasouj in Iran. It is contained of sparse vegetation in hilly area. Point clouds is extracted of ultra-cam-x aerial images. Because of good spatial resolution (6 micron) and good radiometric resolution of this images, advanced matching techniques are able to extract point clouds with a good quality. Space of points which is extracted is 20 cm and every point has various characters like spatial characters(X,Y,Z) and texture characters(RGB).In figure 1 view of sample data is shown.
Figure 1: point clouds extracted from aerial images.
2.2 Methodology
DEM generation using aerial images’ point clouds can be simplified only by filtering non-ground points out of point clouds to obtain only the ground points.
As mentioned in last section, Many filtering methods have been proposed that almost all of them noted use of additional information along with the difference in height, can lead to design a filter with better performance(Sithole & Vosselman, 2004). In this study, property of image texture was used for filter design. In figure2 diagram of procedure is shown.
According to this diagram two general steps is needed for obtaining bare earth. The first step is preprocessing of point clouds included Separation RGB layer from other layers and Remove outliers/blunders and the second step is filtering of processed point clouds contained Vegetation detection by RGB segmentation and Delete vegetation points by segmented image and elevation. In continues all of steps in diagram, is explained.
Fig2. diagram of point clouds filtering process
Aerial images’ point clouds:The first step of this diagram is preparing point clouds data.
Separation RGB layer from other layers:Point clouds included positioning (x,y,z) and radiometric information(RGB) together. For using radiometric information discretion of RGB layer from other layers is needed. Therefore an RGB image based on texture of point clouds is built. In this image each pixel is equal to texture of each point and simultaneously raster file from corresponding height of these textures are built.
Remove outliers/blunders: In aerial images’ point clouds, there are some outliers, including outliers above the ground surface and that below the ground surface. They are points that normally do not belong to the landscape. Outliers above the ground surfaces will be eliminated by the filtering, while outliers below the ground surface need to be removed first. In order to remove outliers, median filter is applied to raster of height. Median filter is used for removing blunders and also is used for integration objects. This caused to preparing data for filtering.
Vegetation detection by RGB segmentation: In this step by using texture image of point clouds ,separated in last step, segmentation for detection of vegetation is done. For this purpose, Otsu method is applied. Otsu segmentation algorithm is based on the assumption that an image compose of target and background, which have different gray level and the target is at higher gray level(Otsu,1979). Threshold k is chosen to segment the image into two classes: the background and vegetation. segmented image, shows vegetation
Aerial images’ point clouds
Separation RGB layer from other layers
Remove outliers/blunders
Vegetation detection by RGB segmentation
Delete vegetation points by segmented imageand
elevation Preprocessing
filtering
Bare earth
The International Archives of the Photogrammetry, Remote Sensing and Spatial Information Sciences, Volume XL-1/W5, 2015 International Conference on Sensors & Models in Remote Sensing & Photogrammetry, 23–25 Nov 2015, Kish Island, Iran
This contribution has been peer-reviewed.
location that class of vegetation is included with shadows in some areas.
Delete vegetation points by segmented image and elevation: this step is required to separate vegetation from shadows. Therefore, the condition of difference in elevation between shadow and vegetation is applied. On the other hands, if difference of elevation be more than 1 meter that will be vegetation. For this purpose, Raster of elevation is compared to segmented image and vegetation points is deleted.
3. EXPERIMENTAL RESULTS
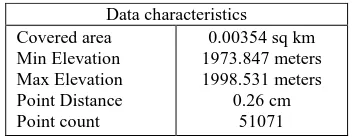
Proposed method implemented in hilly area with sparse vegetation. Point clouds of this area generated by Inpho Match-T software. Match-Table 1 shows characteristics of studied area.
Table 1. characteristics of studied area
Then point clouds imported in MATLAB. Figure(3) shows loaded point clouds in red bound.
Figure 3. point clouds in red bound.
Segmentation operation done for vegetation detection in red bound which is obtained by point clouds texture. at which Otsu threshold considered 0.66. In here binary segmented image created in 2 class consist of vegetation with black and ground with white color. Figure 4 shows an image after segmentation.
Figure 4. (a) image before segmentation and (b) image after segmentation.
After segmentation, segmented image is placed on the point clouds. Figure 5 shows result of this operation.
Figure5: merged segmented image on point cloud
As seen in this figure blue color shows vegetation and red color shows background.
In final step, elevation of blue part is compared together because of separating shadows from vegetation. For this purpose, the condition of 1 m differences is applied. At lest, pieces of point clouds that knows as vegetation is deleted. Figure 6 shows final result.
Figure 6: vegetation filtering from point clouds Data characteristics
Covered area Min Elevation Max Elevation Point Distance Point count
0.00354 sq km 1973.847 meters 1998.531 meters
0.26 cm 51071
(a) (b)
The International Archives of the Photogrammetry, Remote Sensing and Spatial Information Sciences, Volume XL-1/W5, 2015 International Conference on Sensors & Models in Remote Sensing & Photogrammetry, 23–25 Nov 2015, Kish Island, Iran
This contribution has been peer-reviewed.
4. CONCLUSION
In this paper we design a filter for vegetation detection and deleting them from point clouds based on textures. Point clouds texture is extracted and segmentation method is used for finding vegetation areas. segmented image of texture and elevation together created a filter for vegetation detection. This filter can be used for generating digital elevation model automatically in sparse vegetation areas. experiments shows that design elevation based filters along with texture information has better performance than using elevation alone. because of high resolution texture of points in aerial images’ point clouds, designing filters based on texture segmentation have beter results. Future works will be devoted to developing texture segmentation methods for another objects and investigating suitable methods for filling filtered areas.
5. REFERENCES
Axelsson, P. (2000). DEM generation from laser scanner data using adaptive TIN models. International Archive Photogrammetry& Remote Sensing. Spatial Information. Science, 33, 111–118.
Chen, C., Li, Y., Li, W., & Dai, H. (2013). A multiresolution hierarchical classification algorithm for filtering airborne LiDAR data. ISPRS J. Photogrammetry& Remote Sensing, 82, 1–9.
Chen, Q., Gong, P., Baldocchi, D., & Xie, G. (2007). Filtering airborne laser scanning data with morphological methods. Photogrammetry& Engineering& Remote Sensing, 73(2), 175–185.
Evans, J. S., & Hudak, A. T. (2007). A multiscale curvature algorithm for classifying discrete return LiDAR in forested environments. IEEE Transaction. Geoscience& RemoteSensing, 45(4), 1029–1038. Feng, Y., Ji-xian, Z., & Li, Z. (2009). Urban DEM Generation
from Airborne Lidar Data. Urban Remote Sensing Joint Event.
Filin, S. (2002). Surface clustering from airborne laser scanning data. Int. Archive Photogrammetry& Remote Sensing. Spatial Information& Science, 34(Part 3A), 119-124. Jensen, J. R. (2000). Remote Sensing of the Environment: An Earth Resource Perspective. Paper presented at the Inc, Prentice-Hall, Upper Saddle River, New Jersey. Kraus, K., & Pfeifer, N. (1998). Determination of terrain
models in wooded areas with airborne laser scanner data. ISPRS J. Photogrammetry& Remote Sensing, 53 (4), 193–203.
Li, P., Wang, H., & Liu, Z. (2011). A Morphological LiDAR Point Cloud Filtering Method Based on Fake Scan Lines. IEEE Transaction Geoscience& Remote Sensing.
Li, Y. (2013). Filtering airborne LiDAR data by improved morphological method based on multi-gradient analysis. International Archive Photogrammetry& Remote Sensing. Spatial Information Science, 40(Part 5/W1), 191–194. critical issues Remote Sens, 2(3), 833–860.
Mongus, D., & Zˇalik, B. (2012). Parameter-free ground filtering of LiDAR data for automatic DTM
generation. ISPRS J. Photogrammetry& Remote Sensing, 67, 1–12.
Otsu, N. (1979). Threshold selection algorithm from gray- level histograms. IEEE Transaction System Man Cybernet,62-66.
Pingel, T. J., Clarke, K. C., & McBride, W. A. (2013). An improved simple morphological filter for the terrain classification of airborne LIDAR data. ISPRS J. Photogrammetry& Remote Sensing, 77, 21–30. Polat, N., Uysal, M., & Toprak, A. S. (2015). An investigation
of DEM generation process based on LiDAR data filtering, decimation, and interpolation methods for an urban area. Measurement, 75, 50–56.
Rober, G. T., Jensen, J. R., Steven, S. R., Schill, S. R., & Schuckman, K. (2002). Creation of Digital Terrain Models Using an Adaptive Lidar Vegetation Point Removal Process. Photogrammetric Engineering & Remote Sensing, 68, 1307-1315.
Sithole, G. (2001). Filtering of laser altimetry data using a slope adaptive ilter. Int. Archive. Photogrammetry&Remote Sensing. Spatial Inf. Science, 34(Part 3/W4), 203– 210.
Sithole, G., & Vosselman, G. (2004). Experimental comparison of filter algorithms for bare-Earth extraction from airborne laser scanning point clouds. ISPRS Journal of Photogrammetry & Remote Sensing, 59, 85– 101. Sithole, G., & Vosselman, G. (2005). Filtering of airborne laser
scanner data based on segmented point clouds. Int. Archive. Photogrammetry& Remote Sensing. Spatial Information & Science, 36(Part 3), 66–71.
Vosselman, G. (2000). Slope based filtering of laser altimetry data. Int. Arch. Photogr.,Remote Sens. Spatial Inf. Sci, 33(Part B3/2), 935–942.
Zhang, J., & Lin, X. (2013). Filtering airborne LiDAR data by embedding smoothness constrained segmentation in progressive TIN densification. ISPRS J. Photogrammetry& Remote Sensing, 81, 44–59. Zhang, K., Chen, S. C., Whitman, D., Shyu, M. L., Yan, J., &
Zhang, C. (2003). A progressive morphological filter for removing nonground measurements from airborne LiDAR data. IEEE Transaction Geoscience& Remote Sensing, 41(4), 872–882.
The International Archives of the Photogrammetry, Remote Sensing and Spatial Information Sciences, Volume XL-1/W5, 2015 International Conference on Sensors & Models in Remote Sensing & Photogrammetry, 23–25 Nov 2015, Kish Island, Iran
This contribution has been peer-reviewed.