A NOVEL CRITERION FOR EARTHQUAKE RISK ASSESSMENT, THE CASE OF
BUSHEHR CATASTROPHE IN APRIL 9, 2013
M. A. Nezammahalleha,*, M. Yamania, A. Talebib, Z. Pourhosseinic, S. K. Alavipanahd
a
Dept. of Physical Geography, Geography Faculty, University of Tehran, Tehran, Iran
(mnezammahalleh, myamani)@ut.ac.ir
b
Geophysics Institute, University of Tehran, Tehran, Iran
[email protected]
c
Dept. of Geography, Islamic Azad University, Shahreray Branch
[email protected]
d
Department of Remote Sensing and GIS, University of Tehran, Tehran, Iran
[email protected]
KEYWORDS: Earthquake, Seismic Record, Risk Assessment, Date Frequency
ABSTRACT:
Human population growth and consequent spatial distribution of human society requires application of new technologies for safety issues. Risk assessment is necessary to mitigate harmful consequences of possible devastating earthquakes on the human societies. A novel method is presented in this study to be applied as a criterion for the assessment. The criterion has been used to make a seismic zonation of Bushehr Province before the catastrophic earthquake of April 9, 2013, happened in the area. The objective of this study is to explore the factors effective in seismic zonation. Fault locations and seismic records have been used as the material. Four criteria of distance to faults, distance to seismic points, interpolation of earthquake magnitudes, and interpolation of the earthquake dates have been analyzed using a methodology to classify the province in terms of earthquake susceptibility. The results indicate that the devised method of date frequency interpolation have been able to find accurately the areas prone to strong earthquakes. This is concluded that the criterion can be recommended for use in multi-layers analysis of site selection studies.
1. INTRODUCTION
Assessment of earthquake risk is a cautious measure for reduction in damages of seismic catastrophic events. There are plenty of scientific evidence about the earthquake risk assessment (Zolfaghari, 2009; Hashemi et al., 2013; Wang and Zhang, 2013), evaluation of possible damages and their management (Grasso and Maugeri, 2009), seismic zonation and effects on settlements (Guo Liu, 2012; Turk, 2012), and also lots of reports on life and financial causalities of the earthquakes throughout the world (Alcantara-Ayala, 2002; Wang and Zhang, 2013; Turk, 2012; Grasso and Maugeri, 2009). Happening of a strong earthquake can incontrovertibly have enormous damages (Turk, 2012; Grasso and Maugeri, 2009). It is now impossible, with the available equipment and knowledge, to prevent the occurrence of an earthquake and we just are able to reduce or eliminate the damages by making resistant structures (Zolfaghari, 2009; Grasso and Maugeri, 2009), a suitable site selection and planning (Tarhan and Deniz, 2013), and also by assessment of risk areas and vulnerabilities (Zolfaghari, 2009; Hashemi et al., 2013; Akhoondzadeh and Saradjian, 2012) for precautious measures. The earthquake risk assessment is an essential attempt in reduction of earthquake hazardous effects. The results of the assessment can be applied in regional planning, emergency efforts after events, and also in management decision making for organizations such as insurance (Zolfaghari, 2009) for mitigation in adverse effects on
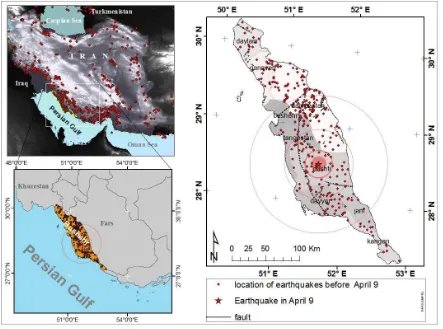
human societies and the environment. This research has carried out a seismic risk assessment for province of Bushehr after the earthquake of April 9, 2013. The earthquake with a magnitude of 6.4 (Ms) happened in Dashti County and left behind 37 people dead and 170 people injured. It also had damages, as reported, to buildings, historical sites, transportation networks, industrial constructs, bridges, and networks of gas, water, and telecommunication (IIEES Report, 2013). The earthquake can be attributed to activity of a right-lateral strike slip fault but it has not strongly been attributed to any certain fault in the area (Figure 1).
The goal of the study as a motive is application of recent information technologies for a safe and sustainable living on the earth. In the future, as human population rise, it can lead to more spatial distribution of the population, e.g., urban sprawl and sustainable development problems (Tarhan and Deniz, 2013), and this requires more processing of spatial safety issues (Ghahroudi Tali and Nezammahalleh, 2013; Tarhan and Deniz, 2013).
The objective of the research is to explore which of the four criteria of interpolation of earthquake date frequency, earthquake magnitude interpolation, distance to the faults, and distance to the points of earthquakes can be effective in seismic zonation by GIS capabilities.
International Archives of the Photogrammetry, Remote Sensing and Spatial Information Sciences, Volume XL-1/W3, 2013 SMPR 2013, 5 – 8 October 2013, Tehran, Iran
Figure 1: The figure illustrates position of the study area. The upper left map represents distribution of the earthquakes with magnitude greater than 5 Ms from 1973 to 2013 in physical terrain of Iran. The lower left map shows the location of Bushehr Province. The right map is an illustration of Bushehr Province as the study area and the exact location of the devastating earthquake
of April 9 in the center of the concentric circles and also the location of all recorded earthquakes happened before 1973 in the area.
2. MATERIAL AND METHODS
In the research we have assessed seismic risk by four criteria that could have detected the possible risk zones of this catastrophe. As the material, past earthquake events happened in Bushehr Province have been searched from USGS EQ Archive for the period from 1973, as the beginning of instrumental records, to the last event before the record of the catastrophic event in the province. The earthquake point data of the archive have earthquake attributes of depth, magnitude, date and time, and latitude and longitude coordinates. The faults data also have been obtained from the geology maps.
A new criterion has been devised in the study for seismic assessment based on date frequency in a given area. We have hypothesized that as the most frequency of seismic records occurs in a given zone more recently, there is the possibility that a strong earthquake happen in that zone. In other words, the more the recent seismic records are in an area, the more is the possibility of a strong earthquake among them. To test the hypothesis, text format dates of seismic data from USGS have been converted into numerical values by DATEVALUE Function in Microsoft Excel based on 1900 date system so that a difference of one day between dates of two records of earthquake is represented as a difference of one number
between the numerical values. Thus, the greater are the numerical values the newer are the seismic records. The values have been imported into ArcGIS and interpolated by Ordinary Kringing (OK) of Geostatistical Analyst Extension, with good quality in cross-validation and semivariogram. The mean standardized error prediction was close to 0 (0.0086) for the interpolation. In the interpolated map, the areas with greater pixel values are represented as the areas with more recent seismic records. As a result, greater values will be in the zones where the frequency of old seismic records is low and the frequency of recent seismic records is high. On the contrary, the zones with low pixel value have either the least number of recent records or the low density of total records. On the zones with intermediate pixel value, the occurrence of earthquake has either an equal temporal distribution or records with intermediate date. The seismic records have also been interpolated based on their magnitude by OK, with low mean standardized prediction error (0.0033). As a result, the zones with greater pixel values have earthquake with higher magnitude. The third factor was distance to fault on the premise that the areas near to the faults have more possibility of earthquake risk than those distant from the faults. The fourth factor is distance to the point of recorded earthquakes with the result that the areas in the vicinity to these recorded points have more earthquake possibility. The four criteria have been International Archives of the Photogrammetry, Remote Sensing and Spatial Information Sciences, Volume XL-1/W3, 2013
SMPR 2013, 5 – 8 October 2013, Tehran, Iran
classified in ten classes by ArcGIS Spatial Analyst based on Quantile method. Unless we first define a dataset in a given border, we may receive some different results if we do not have
all the data in the defined border with a same classification method for all layers. (Figure 2)
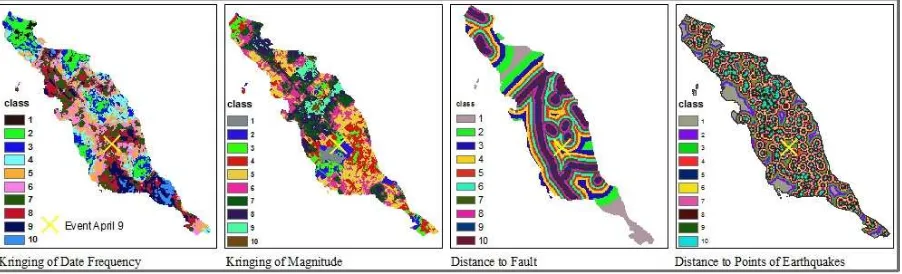
Figure 2: This is an illustration of the four criteria. White areas show higher pixel values and the dark portions represent the lower pixel values by their own units of measurement.
3. RESULTS AND DISCUSSION
The results indicate how the earthquake records before the earthquake April 9, 2013, and the fault location could detect the classes with higher risk values. The higher are the classes the more is the risk of earthquake event so that class 10 represents the highest possibility of a pixel for earthquake and class 1 represents the lowest possibility for all layers. The event is positioned in one class category for each of the four criteria. The earthquake of April 9 happened in Class 3 with low risk based on magnitude values, i.e. it was in an interpolated pixel value of 3.98 ms in magnitude. Thus, the magnitude cannot solely be a criterion to show earthquake prone areas. This may be as the result of the fact that in the classes with relatively high magnitude earthquakes the required energy for a strong earthquake is released previously. Thus, a strong earthquake may occur in interpolated classes where magnitude of happened earthquakes was not very high. According to the results of this study the criterion of Distance to fault that usually is used in many studies about multi-criteria analysis for site selection purposes cannot be an important factor to estimate the susceptible areas of earthquake based on. In that, the strong earthquake in Dashty County of Bushehr Province in April 9,
2013, just occurred in Class 5 of the criterion of distance to faults, i.e., it was in a distance of 13.6 Km to the nearest fault. In other words, the criterion of distance to fault might not have been as important as it was considered as a variable in previous studies of multi-layers site selection (Ghahroudi, et al., 2012). However, the fault lines as the origins for much of the seismicity are very important in seismic zonation and the exact place at which an earthquake already occurred may be influenced by many other factors. The devastating earthquake of Bushehr happened in Class 6 based on distance to the recorded points. This means that distance of all points of an area to the points at which an earthquake previously happened can be recommended as a criterion to estimate the areas susceptible to strong earthquakes, i.e., it was in a distance of about 4.8 Km to the nearest points of previous earthquakes. The catastrophic earthquake of April 9 interestingly happened in Class 8 based on the Date Frequency Criterion. This means that strong earthquakes may just happen in areas in which there are the most recent earthquakes of a period. It has interpolated value of 36341 that is equal to Jun 1999 in a period from 1973 to 2013. Class 8 for the event indicates that recent earthquakes regardless of their magnitude or any other factor have been concentrated in the proximity of Dashty County just before the strong hazardous earthquake with magnitude of 6.4 Ms happened. (Figure 3)
Figure 3: The four criteria are classified in 10 classes by Quantile Classification Method. The yellow cross mark is the location of the earthquake event in each of the four maps.
International Archives of the Photogrammetry, Remote Sensing and Spatial Information Sciences, Volume XL-1/W3, 2013 SMPR 2013, 5 – 8 October 2013, Tehran, Iran
4. CONCLUSION AND FUTURE WORK
This can be argued that those three factors could not be a criterion for the risk assessment but the frequency in dates of recorded earthquakes could have detected the zone in which the catastrophe just happened. In other words, before the earthquake it was possible to find the risk areas by the most recent dates of seismic records. It can be concluded that the date frequency of seismic records can be used as a parameter in seismic risk assessment studies and that it can be used as a criterion for Multi-criteria analyses. The study demonstrated that the criterion of distance to fault frequently applied in previous studies may not be a good criterion. These results can also be used for weighting procedures in Fuzzy multi layer studies. This can be suggested to use the criterion for other previous strong earthquakes to strengthen its ability for seismic zonation.
REFERENCES
Akhoondzadeh, M.; Saradjian, M. R., (2012) Fusion of multi precursors earthquake parameters to estimate the date, magnitude and affected area of the forthcoming powerful earthquakes, XXII ISPRS Congress, Melbourne Australia, 1-6 Alcantara-Ayala, I., (2002) Geomorphology, natural hazards, vulnerability and prevention of natural disasters in developing countries, Geomorphology 47, 107-124
Ghahroudi Tali, M.; Nezammahalleh, M. A., (2013) Urban flooding management using the natural drainage system case study: Tehran, Capital of Iran, Floods: From Risk To Opportunity, IAHS Publ. 357, 174-180
Ghahroudi Tali, M., Sadough, S. H., Nezammahalleh, M. A., Nezammahalleh, S. K., (2012) Multi-criteria evaluation to select sites for ecotourism facilities: a case study Miankaleh Peninsula, Anatolia 23, 373-394
Grasso, S.; Maugeri, M., (2009) the road map for seismic risk analysis in a Mediterranean city, Soil Dynamics and Earthquake Engineering 29, 1034-1045
Guo Liu, J.; Mason, P.J.; Yu, E.; Wu, M.C.; Tang, C.; Huang, R.; Liu, H., (2012) GIS Modelling of earthquake damage zones using satellite remote sensing and DEM data, Geomorphology 139-140, 518-535
Hashemi, M.; Alesheikh, A.A.; Zolfaghari, M.R., (2013) A Spatio-temporal model for probabilistic seismic hazard zonation of Tehran, Computer and Geosciences 58, 8-18
IIEES, (2013) The primary report of 6.3 Richter Earthquake of 20/01/92 in Dashty County of Bushehr Province (in Farsi) Tarhan, C.; Deniz, D., (2013) sustainable urban planning and risk assessment of earthquake hazards in Turkey, 25th urban data management symposium, United Kingdom
Turk, T.; Gumusay, U.; Tatar, O., (2012) Creating infrastructure for seismic microzonation by Geographical Information Systems (GIS): A case study in north Anatolian Fault Zone (NAFZ), Computer and Geosciences 43, 167-176
Wang, Z.Z.; Zhang, Z., (2013) seismic damage classification and risk assessment of mountain tunnels with a validation for the 2008 Wenchuan earthquake, Soil Dynamics and Earthquake Engineering 45, 45-55
Zolfaghari, M.R., (2009) Use of raster-based data layers to model spatial variation of seismotectonic data in probabilistic seismic hazard assessment, Computer and Geoscience 35, 1460-1469
ACKNOWLEDGEMENT
The financial support of University of Tehran is greatly appreciated. The authors would like to acknowledge Mr Hassan Nezammahalleh for formatting the manuscript with Latex. International Archives of the Photogrammetry, Remote Sensing and Spatial Information Sciences, Volume XL-1/W3, 2013
SMPR 2013, 5 – 8 October 2013, Tehran, Iran