ADAPTIVE EDGE DETECTION USING ADJUSTED ANT COLONY OPTIMIZATION
M. Davoodianidaliki a, *, A. Abedini b , M. Shankayi a
a
Dept. of Geomatics Engineering, Faculty of engineering, University of Tehran
N. Kargar St. Jalale al e Ahmad St., Tehran: 14395515, Iran- (mdavoodian, mshankayi)@ut.ac.ir
b
Faculty of Aerospace Engineering and Geodesy, Institute of Geodesy, University of Stuttgart, Stuttgart D-70174, Germany , abbas.abedini@gis.uni-stuttgart.de
KEY WORDS: Edge Detection, Image Processing, Ant Colony Optimization, Artificial Intelligence
ABSTRACT:
Edges contain important information in image and edge detection can be considered a low level process in image processing. Among different methods developed for this purpose traditional methods are simple and rather efficient. In Swarm Intelligent methods developed in last decade, ACO is more capable in this process. This paper uses traditional edge detection operators such as Sobel and Canny as input to ACO and turns overall process adaptive to application. Magnitude matrix or edge image can be used for initial pheromone and ant distribution. Image size reduction is proposed as an efficient smoothing method. A few parameters such as area and diameter of travelled path by ants are converted into rules in pheromone update process. All rules are normalized and final value is acquired by averaging.
* Corresponding author.
1. INTRODUCTION
Edges show relative sudden changes in image and usually contain important information. That's why various methods are developed for this purpose. (Oskoei and Hu, 2010) classify them in 10 categories from classical methods to contextual methods.
Common traditional edge extraction algorithms such as Canny use a constant window that can be mixed with some smoothing filters. They need high quality values for their parameters in order to reach extraction efficiency. Despite simplicity, low computational cost and the fact that these parameters are known in high degree of quality based on experiences during last years, but they are still dependent to lightening conditions, noise etc. Lack of any of these dependencies could result in fail of these methods. In addition, using a constant parameter all over the image can result as discontinuity in edges ant this discontinuity in edges is one of the most important weaknesses in such algorithms. Some methods try to extract special edges by applying transformations such as Hough transform (which fall under line edge detectors category) but all edges don’t meet required conditions. Due to lack of information, using hybrid techniques usually leads the process to fail.
Ant Colony Optimization (ACO) is a heuristic search method that operates based on ant colony and is being used for discontinuous problems. During recent years this method is especially developed for edge extraction purposes (Agarwal, 2012). In order to reach suitable solution, it's necessary to specify initial ant positions and their movement type as well as their operation condition. So far, acceptable results are obtained but due to this fact that the basic ant colony algorithm is used and considering potential that this algorithm possess there is room for improvement.
Also (Koschan and Abidi, 2005) review edge classification which is a high level process and a connector to further processes such as segmentation. Using this classification itself requires hybrid techniques in which edge detection is no longer
a pre-processing but part of a hybrid main process to achieve best result using all means. In this case contextual methods which usually combine with Neural Network or fuzzy are applied (Yu and Chang, 2006).
This paper proposes an adjusted ACO algorithm in which initial conditions are especially acquired using traditional edge detection techniques. Next section describes proposed method in a few subsections and then experimental section try to execute these methods and evaluate them by a few means containing comparison with similar previous algorithms. And finally a conclusion is provided.
2. METHODOLOGY
Since proposed method consists of a few different parts, each component is described separately.
2.1 Traditional edge detectors
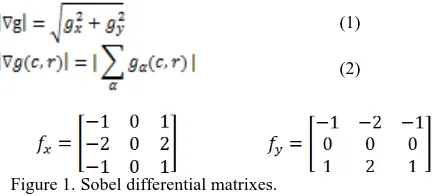
Classic edge detectors such as Sobel and Prewith compute an estimation of gradient in pixels using simple filters (Figure 1) and search for local maxima. Gradient magnitude estimation is acquired using (1) or (2). To reduce sensitivity to noise, average through overall image is applied.
(1)
(2)
Figure 1.Sobel differential matrixes.
But Gaussian based algorithm introduced in 80th such as Canny(Canny, 1986) had more robust results. Canny showed
International Archives of the Photogrammetry, Remote Sensing and Spatial Information Sciences, Volume XL-1/W3, 2013 SMPR 2013, 5 – 8 October 2013, Tehran, Iran
that for a 1D step edges, the derived optimal filter can be approximated by the first derivative of a Gaussian function and since it's separable and can be decomposed into 2 1D function, for 2D image, it can be applied on rows and columns consecutively. There is also a method to combine outputs of different scales called feature synthesis (Basu, 2002).
There is no need to further investigate these methods since the output to be used for ant algorithm in next step is gradient magnitude matrix. Even if final result of edge image might be used for initial distribution, there is just a simple step of threshold exertion that transform magnitude matrix into edge image.
2.2 Ant Colony Optimization
ACO has inspired from foraging behavior of some ant species and is a developing version of first ant colony optimization algorithms such as ant system (Dorigo et al., 1996) more than a decade ago. Ants deposit pheromone (a type of chemical) on the ground in order to communicate between the members of their community which also increases the probability that the other ants will follow the same path (Dorigo et al., 2006). ACO consists of 3 main components of initial ants' distribution, Node transition rules and pheromone updating rule. Following paragraphs describe every step taken to achieve a better result.
2.2.1 Initial pheromone value and ants' distribution: Normally initial pheromone values for every possible node are the same but it's possible to use some basic information to assign initial values. It makes sense when looked at as a stage which is just part of a more sophisticated process to achieve high level image processing and input is not necessarily just raw data.
Gradient magnitude matrix reviewed in previous section is what
makes a perfect initial pheromone matrix since it’s a simple
assessment of possibility of being on edge for every pixel. Number of ants that algorithm greatly depend on them can be determined based on magnitude image. The value is influenced by ratio of number of pixels with gradient value of more than 0.1 to total number of pixels in image. The constant 0.1 is decided in a way that almost every possible edge is considered that it usually includes noises as well.
Ants are not initially distributed through whole image randomly but they are divided into two groups. First one is distributed through the magnitude image pixels that are possible edges. Others will be distributed to other parts of image. In this way, chance of ants moving randomly is supressed. A few other ants play the role of recognizing all possible pixels of being an edge despite not being on magnitude matrix available. As its basic property, ACO tends to achieve a single best route and if there is more than one, it recognizes just one of them. Since edges are not a single solution, this method automatically solves the problem. Initial ant distribution can also be endpoints of edge image acquired using traditional methods such the one used by (Verma et al., 2010). Different states are considered in experimental section.
If image size is large enough that when size is reduced it still is meaningful then getting magnitude matrix and initial edge image on little image will give better results since reducing size is the same as a low-pass filter while it can reduce noise tremendously. Despite the simplicity of idea, result is not the same as usage of smoothing filters that in experiments are displayed.
2.2.2 Transition Rules: Due to its nature, ACO can be easily fused with Fuzzy without altering process, especially replacing rule, can be performed through a fuzzy reasoning influence of pheromone and heuristic information in selection process. A few options are provided by (Agarwal, 2012) to compute heuristic information such as equation 4. In which I is a function that gives an estimation of neighbour pixel relations and can be any of equations 5-8 or similar ones. x is gray value.
(4) dynamic neighbourhood in which ant can escape death based on a 50% chance once by increasing neighbourhood pixels from 8 to 12 (Figure 2).
ant
Figure 2.Increasing neighborhood once for each ant to 12 pixels.
2.2.3 Pheromone update rule: There are two update processes in each generation of ants. When every ant meets its end, according to attributes of the path it has gone, pheromone value of the travelled path is updated. Also when all ants of one generation die, pheromone is evaporated. dies, radius of travelled path can be considered.
Ratio of area bounded by travelled path to length of it is important as well. This one is especially considered to reduce the value of those path in which ant has moved beside edge by continuously shifting to sides of it (Figure 3).
International Archives of the Photogrammetry, Remote Sensing and Spatial Information Sciences, Volume XL-1/W3, 2013 SMPR 2013, 5 – 8 October 2013, Tehran, Iran
Figure 3.Ant (blue pixels) doesn't always move on edges but shift between sides.
This area is computed by polynomial fitting and pixel to line distance computation. Depending on the smoothness of edge, area value can be 1 for smoothest, 2 or 3 for noisy edges. Instead of equation 9, another equation can be considered such as (10) in which Lk is Euclidian distance and Sk is total number of pixels travelled by kth ant. This equation is not suitable for ants that have travelled on semi-circle path.
(10)
To decide the final update value, all mentioned factors and their values are transformed into one unit and a simple average operator is applied to acquire final update value.
3. EXPERIMENTS
This section execute proposed method and tries to evaluate its efficiency through comparison with previous algorithms and visually. Main image used is MATLAB cameraman (Figure 4).
Figure 4.MATLAB cameraman image used for experiments and evaluation process.
To determine which magnitude matrix is suitable for initial pheromone, Figure 5 displays results of Canny and Sobel.
Figure 5.Magnitude matrix of Sobel (left) and Canny (right) to be used for initial pheromone value.
At first glance and as it has been proved during years, Canny gives a very stable and full overview of pixel magnitude values. But that's without considering the application it's going to be
used. As stated by (Koschan and Abidi, 2005) orientation and occlusion edges that are boundaries between object and background are more important. Now in Figure 4, considering the man and camera are objects and all other stuff is just part of background then Sobel result is more valuable since it doesn't give any additional edges.
The same applies to initial ant distribution by the difference that since a group of ants are distributed totally random, it's better to distribute other group on pixels with higher chance of being edge. Also as mentioned in previous section, ants can be stationed on endpoints to gain a higher chance of removing discontinuity.
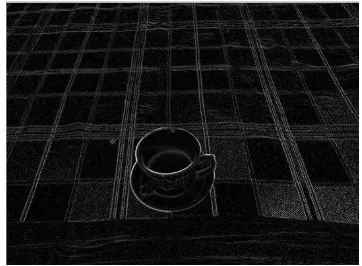
Regarding reduction size matter, it can be displayed on an image in which background itself contains a pattern full of edges (Figure 6, 7).
Figure 6.An image that its background pattern is full of edges (Original resolution 1600*1200).
Figure 7.Canny magnitude matrix of Figure 6 that shows high values for background.
If we apply a simple dimension reduction on this image, magnitude matrix will be a lot more reliable due to noise reduction. Smoothing filters don't possess the same effect (Figure 8).
Figure 8.Left: Canny magnitude matrix of image with reduced size to one forth (240*320). Right: Canny magnitude matrix of smoothed image (filter size 5*5).
Figure 9 shows final result using canny magnitude matrix as initial pheromone and Canny final edge result used as initial distribution.
International Archives of the Photogrammetry, Remote Sensing and Spatial Information Sciences, Volume XL-1/W3, 2013 SMPR 2013, 5 – 8 October 2013, Tehran, Iran
Figure 9.Left: Edge image computed by ACO using Canny magnitude and edge matrixes as initial pheromone and distribution matrixes. Right: Edge image computed using Canny operator.
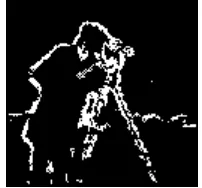
But to see difference between usual ACO and adjusted ACO, Figure 10 displays edge image extracted using ACO proposed by .(Tian et al., 2008)
Figure 10.Edge extracted using ACO proposed by (Tian et al., 2008)
As expected, using Canny or any other traditional edge detector as input to ACO will give better results and especially it can remove discontinuities in final result. Also due to the fact that result is dependent on input which itself can differ based on application, overall process can be considered adaptable.
4. CONCLUSIONS
Edges in image contain important information and edge detection plays an important role in image processing. Due to this importance, over decades lots of techniques are developed for this purpose. ACO is a heuristic search method under Swarm Intelligent category developed in last decade and is suitable especially for discrete problems. This paper proposes usage of traditional edge detectors for initial pheromone and distribution matrixes that previously were equal and random. So adaptivity is provided by a variety of inputs dependant on application. Image size reduction is introduced as a really effective method to noise reduction compared to previous method of image smoothness. Death escape opportunity is provided randomly for some ants to increase the edge length. In pheromone update process, a few parameters such as diameter and area of travelled path are converted into rules and rules are normalized to compute the final update value through averaging. Results are compared to previous ACO algorithm by applying on the same image and also they are more reliable.
5. REFRENCES
Agarwal, S., 2012. A Review Paper Of Edge Detection Using Ant Colony Optimization. International Journal of Latest Research in Science and Technology 1, 120–123.
Basu, M., 2002. Gaussian-based edge-detection methods-a survey. Systems, Man, and Cybernetics, Part C:
Applications and Reviews, IEEE Transactions on 32, 252–260.
Canny, J., 1986. A computational approach to edge detection. IEEE transactions on pattern analysis and machine intelligence 8, 679–98.
Dorigo, M., Birattari, M., St, T., 2006. Ant Colony Optimization.
Dorigo, M., Maniezzo, V., Colorni, a, 1996. Ant system: optimization by a colony of cooperating agents. IEEE transactions on systems, man, and cybernetics. Part B,
Cybernetics : a publication of the IEEE Systems, Man,
and Cybernetics Society 26, 29–41.
Koschan, a., Abidi, M., 2005. Detection and classification of edges in color images. IEEE Signal Processing Magazine 22, 64–73.
Oskoei, M.A., Hu, H., 2010. A survey on edge detection methods. Technical Report: CES-506. University of Essex, Colchester.
Tian, J., Yu, W., Xie, S., 2008. An Ant Colony Optimization Algorithm For Image Edge Detection, in: IEEE Congress on Evolutionary Computation (CEC). pp. 751–756.
Verma, O.P., Hanmandlu, M., Sultania, A.K., 2010. A Novel Fuzzy Ant System for Edge Detection. 2010 IEEE/ACIS 9th International Conference on Computer and
Information Science 228–233.
Yu, Y.-H., Chang, C.-C., 2006. A new edge detection approach based on image context analysis. Image and Vision Computing 24, 1090–1102.
International Archives of the Photogrammetry, Remote Sensing and Spatial Information Sciences, Volume XL-1/W3, 2013 SMPR 2013, 5 – 8 October 2013, Tehran, Iran