AUTOMATIC MATCH BETWEEN DELIMITATION LINE AND REAL
TERRAIN BASED ON LEAST-COST PATH ANALYSIS
Feng Changqiang a, Jiang Nan a, Zhang Xiaonan a, M a Jian a a
Geospatial Information Institute, Information Engineering University, NO.62, KeXueDaDao Road, New and High-Tech Development Zone, ZhengZhou, HeNan Prov., China 450002. luckystar1682006@126.co m
KEY WORDS : Automation, M odel, Delimitation, M atch, M odule Builder, Least-Cost Path Analysis
ABS TRACT:
Nowadays, during the international negotiation on separating dispute areas, manual adjusting is lonely applied to the match between delimitation line and real terrain, which not only consumes much time and great labor force, but also cannot ensure high precision. Concerning that, the paper mainly explores automatic match between them and study its general solution based on Least -Cost Path Analysis. First, under the guidelines of delimitation laws, the cost layer is acquired through special disposals of delimitation line and terrain features line. Second, a new delimitation line gets constructed with the help of Least-Cost Path Analysis. Third, the whole automatic match model is built via M odule Builder in order to share and reuse it. Finally, the result of automatic match is analyzed from many different aspects, including delimitation laws, two-sided benefits and so on. Consequently, a conclusion is made that the method of automatic match is feasible and effective.
1. Introduction
From 1940 to 1990, there appear about 130 boundary conflicts in the world (M artha Finnemore, 1996; Zhao, 2008), which are important factors influencing international peace and stability. As history proves, the wars cannot resolve these problems thoroughly . Instead, negotiations become an effective way to deal with territory disputes (Cao, 2011). Therefore, it is urgent to strengthen the study on theories and techniques of delimitation. Internationally , natural terrain is preferentially considered during separating dispute territories (M ilitary Training Dept, 1993), such as main ridges and valleys, which can partition two districts and stop the attack effectively . But, at present, computer-aided delimitation nearly does not consider natural terrain unless manual adjusting is introduced. However, the latter has many disadvantages. As a result, it is very important and impendent that relevant study on automatic match between delimitation line and real terrain should be enhanced.
The automatic match mentioned above is to search for a series of terrain features lines near old delimitation line, then join them into one curve to replace the old on the premise of meeting some restrictions, such as minimizing the changes of respective vested benefits like area, resource and so on. What’s most important is that, only when the changes caused by new delimitation line reach minimum as soon as possible, can the match result be accepted by both sides of territory disputes. Although delimitation negotiation involves many factors, such as area, resource, People, religion and so on, the Least-Cost Path Analysis can take different kinds of information into account at the same time. Concerning that, the article mainly studies how to fulfill the automatic match via Least -Cost Path Analysis. Thus, it is better to deploy study on the latter.
2. LEAS T-COS T PATH ANALYS IS
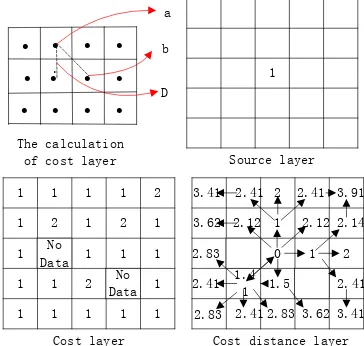
The Least-Cost Path Analysis is to calculate the accumulated cost of all the pass-by cells from source to each cell (or from each cell to source), and to select a path to be the best one which is of the least accumulated cost under a certain circumstances. The analysis not only depends on source and destination layer, but also requires cost distance layer as well as relevant direction layer. The latter two layers can be generated through cost distance analysis. Both source layer and cost layer are demanded in cost distance analysis. The value of each cell in cost layer shows its traffic cost. The cost distance analysis is to determine related cost from source to each cell (or from each cell to source) according to the least accumulated traffic cost. Obviously, the key of cost distance analysis is to accumulate traffic cost. The accumulated cost of each cell consists of two parts. One is the accumulated cost of previous cell. The other is the traffic cost of its own. The first formula shows how to compute related accumulated cost.
accum_cost_b=accum_cost_a+((cost_a+cost_b)/2)*D (1)
where accum_cost_a, accum_cost_b = accumulated cost cost_a, cost_b = traffic cost
D = distance from ―a‖ to ―b‖
figure shows detailed analysis. The upper left exhibits the theory of cost distance analysis. The bottom right is the result of analysis. The left is relevant basic data.
Due to the fact that cost distance analysis calculates the least accumulated cost originating from source, a certain cell may have several superior ones, which results in more than one path. In this case, only the least-cost path is selected to be the best one. Additionally, if there exist cells whose values are ―No-Data‖ in cost layer, the analysis will keep away from them (Song and Niu, 2008). After cost distance analysis, corresponding direction layer can also be created, where each cell records the superior one in its least accumulated cost path. Concerning that, all of the least cost paths from source to each cell can be built.
3. S TUDY ON AUTOMATIC MATCH
As we all know, all kinds of benefits in delimitation are related to location, such as minerals, water, biological varieties and so on. As for the old delimitation line and the new one, the closer to each other they are and more similar they are in shape, the smaller the change of two-side vested benefits caused by the new one will be. Therefore, location and similarity (Jiang, Chu and Guo, 2009) are important indexes to estimate match result.
After study, it is obvious that there exist difficulties and uncertainties in quantifying above-mentioned indexes and making it clear that how can they evaluate the result of automatic match consistently. From another point of view, as the second, the third formula and the second figure show, there exists a fact that, the smaller the sum and difference of areas of all the right polygons and left ones composed of new delimitation line and the old one, the closer to each other two curves get. M eanwhile, they will also get higher similarity. Ideally, if their sum and difference reach zero in the meantime, two curves are overlapping, and their similarity reaches highest.
= + =∑ +∑ (2)
=| |=|∑ ∑ | (3) <max( , )< (4)
Where =total area of all the surrounded polygons , =total area of all the left or right polygons
Figure 2. Areas surrounded by new and old delimitation line
O X
Figure 3. Calculation of polygon via differential extremum principle
In reality, the area of each polygon surrounded by terrain features lines and old delimitation line does not vary gradually. Consequently, it is excessively difficult for them to reach minimum at the same time, no matter which terrain features lines the new delimitation line is made of. As the forth formula shows, when the sum gets minimal, the difference will become smaller, which makes sure that the change of two-side vested benefits is limited to a smaller extent. In other words, to a certain degree, the key of match is to minimize the sum. In the third figure, each zone surrounded by terrain features lines and the old delimitation line can be marked as ―Sj‖. As differential extremum principle shows, the line ―BC‖ can be divided into infinite segments with an infinitesimal value ― ‖. Finally, the area of can be expressed by the fifth formula. Additionally, there is no need to compute the real value of each area, and what is most important is to search for all the terrain features lines leaving ―ST‖ minimized. Thereby, as the fifth and the sixth formula show, if the same ― ‖ is applied to partition all the polygons, the area of each ―Sj‖ is proportional to the sum of each ― ‖. Further, whether the new delimitation line is good or bad can be judged by the total sum of all the ― ‖ from every polygon. In one word, what is most important in automatic match is to calculate perpendicular distance from each grid on terrain features lines to the old delimitation line.
In ArcGIS, the perpendicular distance from each grid to given curve can be got via Euclidean Distance Analysis (Song and Niu, 2008). Concerning that, the general solution of automatic match is concluded as follows. First, Euclidean Distance Analysis and grid overlay are used to calculate the shortest distance from each grid on terrain features lines to old delimitation line. Second, the above-mentioned shortest distance is regarded as cost to carry out Least-Cost Path Analysis so as to get a group of terrain features lines having the least accumulated traffic cost. That is new delimitation line. Concise implementation will be explored in the following.
4. DETAILED IMPLEMENTATION OF AUTOMATIC MATCH
4.1 Pretreatment of Data
Before automatic match, it is necessary to pretreat relevant data, such as the unification of mathematical basis, the clipping and extension on old delimitation line, creating terrain features network and so on. Additionally, special disposals related to delimitation laws should be introduced to above-mentioned network. Thereinto, the unification aims at terrain features grid, dispute area and old delimitation line, which can be realized via projection transformation (Song and Niu, 2008). The purpose of extension and clipping is to make old delimitation line and the boundary of dispute area touch with each other exactly. M eanwhile, the source and destination demanded in Least-Cost Path Analysis should be created according to the first and last point of disposed delimitation line.
(1) Creating terrain features network
For easy operation, different kinds of terrain features lines should be integrated into one layer through grid overlay. The layer is marked as ―R‖. All of the terrain features lines should not intersect with each other logically , which means there exist disconnections in above-mentioned network. But, in order to improve the efficiency of automatic match and pursue better match result, those dangling terrain features grids should be inversely extended, which makes different terrain features lines touch with each other to build related network. As the following shows, the extension mainly consists of two steps.
ķ Every terrain features grid should be dealt with as follows.
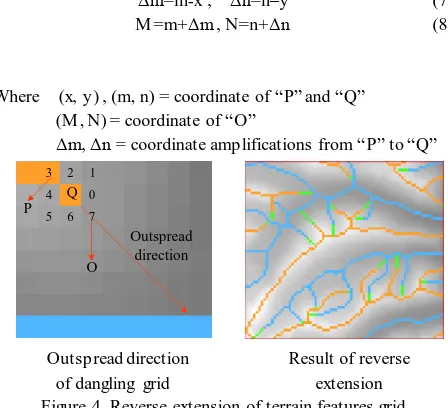
As the left of the fourth figure shows, if some terrain features grid ―Q‖ dangles in whose eight-neighborhood grids there is only one terrain features grid marked as ―P‖, the next step should be carried out.
ĸ Extension direction of ―Q‖ is calculated according to ―P‖ to
get row and column number of ordinary grid ready to become terrain features grid and marked as ―O‖. Equally, the amplifications in row and column direction can be calculated, which are ―Δm‖ and ―Δn‖. As the seventh and eighth formula show, if the row and column number of ―P‖ and ―Q‖ are (x , y) and (m , n), the location of ―O‖ is (M , N). Each time ordinary grid ―O‖ becomes terrain features one, it should be disposed according to the following. If ―O‖ also dangles, inverse
extension continuing executing. If not or reaching the boundary of above-mentioned network, the extension related to ―Q‖ is Figure 4. Reverse extension of terrain features grid
The right of the fourth figure shows the result of inverse extension. Thereinto, green parts become terrain features grids after disposals. What needs illustrating is that, there exist errors or mistakes in above-mentioned result. For the benefit of match precision, extension result should be checked and optimized.
(2) Special disposals on the network of terrain features line
According to delimitation laws, there always exist indiscerptible areas and unshakable areas because of history, People, religion, military affairs and so on (Wu, 2013). During automatic match, how to ensure that indiscerptible areas are not separated and unshakable areas are distributed to relevant countries needs to be solved. Concerning that, first, this paper uses these special areas to delete terrain features network so that new delimitation line do not pass through them. Second, the shortest straight path between unshakable area and related countries should be figured out, and a small buffer corresponding to above-mentioned path is built to be used to delete terrain features network again, which makes sure that dispute countries can get their own unshakable areas. These special areas are shown in the bottom of the fifth figure.
Additionally, in order to improve match efficiency, first, this article uses two polygons to clip pretreated network to reduce its match scope. Thereinto, these two polygons are related dispute areas and buffer area based on old delimitation line. Second, except terrain features grids, the values of all the grids are set to ―NoData‖, which not only saves match time, but also force the new delimitation line to go along terrain features lines.
4.2 Key Parts of Automatic Match
automatic match—creating cost layer and carrying out Least-Cost Path Analysis.
(1) The Creation of cost layer
This step aims to calculate the shortest distance from every terrain features grid to old delimitation line. First, distance layer ―D‖ shown in the top of the fifth figure can be obtained via Euclidean Distance Analysis on the basis of old delimitation line. Second, grid multiplication is executed on pretreated network of terrain features grid and distance layer ―D‖ in order to obtain cost layer ―C‖ shown in the bottom of the fifth figure. From the bottom, it can be easily seized that, the closer to old delimitation line the terrain features grids are, the darker their color become, which indicates that the current traffic cost will be lower. Of course, it will be selected with high priority.
Additionally, after Euclidean Distance Analysis, the values of those grids overlapp ed by old delimitation line are zero. If there is no extra disposal, both the new and the old will overlap with each other. Thus, before grid multiplication, a tiny offset should be added to the value of each grid in layer ―D‖ to prevent from getting bad result.
Old delilitation line
Dispute area
Distance layer—―D‖
Cost layer—―C‖ Figure 5. Creation of cost layer
(2) Least-Cost Path Analysis
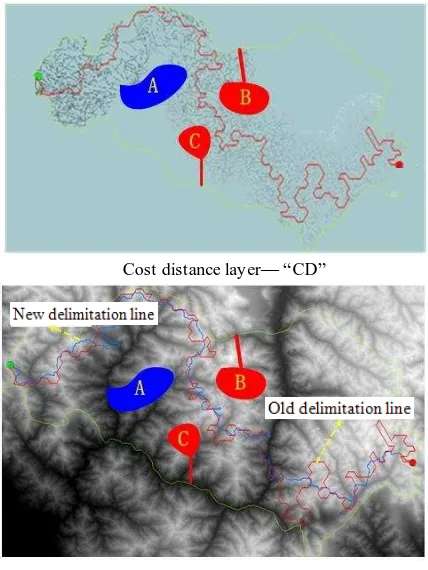
First, the source point of old delimitation line and cost layer are used to implement Least-Cost Path Analysis to build cost distance layer ―CD‖ ( as the top of the sixth figure shows ) and direction layer ―DI‖. Second, Least-Cost Path Analysis is carried out on the basis of destination point of old delimitation line, cost distance layer ―CD‖ and direction layer ―DI‖ to construct least-cost path which is new del imitation line shown in the bottom of the sixth figure.
Cost distance layer— ―CD‖
Result of automatic match Figure 6. Automatic M atch
Figure 7. M odel of automatic match
4.3 Analysis of Automatic Match Result
In the bottom of the sixth figure, new delimitation line mainly owns the following characteristics. First, it fits with the real landform better than the old one. Second, not only can both of two sides get their own unshakable district, but also the new one does not cross with indiscerptible areas. M oreover, in terms of location proximity, the new fluctuates around the old in a narrow extent, which makes sure that their similarity will be higher. All of the features not only accord with relevant delimitation laws, but also meets the objective of this paper. However, there appears an outstanding shortcoming. Around U or V area, the result of match is bad because the cost of directly passing through these areas is lower than that of going along those curves. Certainly, the shortage should be further perfected.
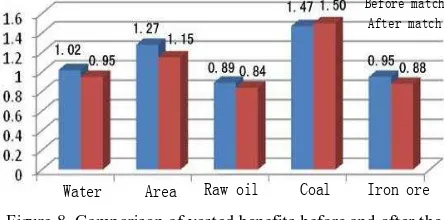
In order to make clear the changes of two-side vested benefits, the paper use related statistics methods (Cao, 2011; Chen, Lei and Liu, 1987) to calculate the gross of every resource in each zone. As the eighth figure shows, the changes of benefits do not fluctuate severely. Instead, they are located in an acceptable extent.
Before match After match
Water Area Raw oil Coal Iron ore
Figure 8. Comparison of vested benefits before and after the match
5. CONCLUS ION
The experiment proves that, the automatic match explored in this article not only ensures that the delimitation line fits with real landform exactly, but also can properly deal with those
special areas according to delimitation laws and leaves the changes of vested benefits in an acceptable extent. From this perspective, the method of automatic match is feasible and effective. But, some questions still need to be properly resolved. M oreover, on account of that the negotiation on delimitation is full of intelligence, the result of automatic match may not be the final delimitation line which can be eventually determined through repeated negotiations of two sides.
References
[1] M artha Finnemore, 1996. National Interests in International Society. Cornell University Press, Ithaca, 11.
[2] Zhao Junxi, 2008. Research on Geospatial M etadata Oriented Digital Borders. Doctor dissertation, Institute of Surveying and M apping, PLA Information Engineering University, Henan, China.
[3] Cao Yibing, 2011. Research on Auxiliary Demarcation of Land Border. M aster Dissertation, Institute of Surveying and M apping, The PLA Information Engineering University, Henan, China.
[4] M ilitary Training Dept, The General Staff, 1993. World M ilitary Geography . Bayi Press, Beijing. 11: 13-21
[5] Song Xiaodong, Niu Xinyi, 2008. Practice tutorial of GIS(ArcGIS 9.X). Science press, Beijing, 94-103.
[6] Jiang Hao, Chu Yandong. Guo Lifeng, 2009. Defination and M easurement of Shape Similarity for Curves. Journal of Yunnan University of Nationalities (Natural Sciences Edition), 18(4), pp.316-318.
[7] Wu Lili, 2013. Research on the Auxiliary Generation of Initial Delimitation Line Based on Hexagon. Doctor dissertation, Institute of Surveying and M apping, PLA Information Engineering University , Henan, China.
[8] Tang Guoan, Yang Xi, 2012. GIS Experimental Tutorial of Spatial Analysis (The Second Edition). Science press, Beijing, 340-345.
[9] Xing Chao, Li Bin, 2010. Guide for ArcGIS—ArcToolBox. Science press, Beijing, 6-10.