USING GIS TO UNDERSTAND AND PRIORITISE WORKER MOVEMENTS DURING
THE 2012 LONDON OLYMPICS
I. M. McGuinness
Geospatial Team, Strategic Planning, Regeneration and Olympic Legacy Division, London Borough of Newham, 1000 Dockside Road, London E16 2QU - [email protected]
KEY WORDS: GIS, Modelling, Data Mining, Planning, Urban, Impact Analysis
ABSTRACT:
The performance of the transport network and the associated movement of people was one of the most critical elements to London’s successful delivery of the 2012 Olympic Games. During the planning stages Transport for London asked the London Borough of Newham to mitigate the impact of the authority’s 13,500 employees on transport infrastructure close to the Olympic Park. To achieve this, the authority needed to understand the geographic distribution of its workforce and the demand it placed on roads and local transport hubs. The authority’s Geospatial Team led the research based on four cross-referenced data sources, and spatial analysis was used to determine priorities for special absence arrangements and a commissioned coach service. The research was used to support a targeted information campaign but also presented considerations on large-scale data collection, the use of Human Resources data, and the degree to which the movement of people can be measured and managed.
1. INTRODUCTION
The London Borough of Newham ('the Authority') was heavily involved in planning and preparatory work for the London 2012 Olympic Games ('the Games'), with the majority of the park and the main stadium situated inside the Borough. The Authority formed its own 2012 Team to co-ordinate civil contingency and emergency response across the eight adjacent authorities, as well as to ensure the effective management of the interface areas immediately outside the Olympic Park. The 2012 Team drew heavily on the input of the Authority’s Geospatial Team to manage, analyse and coordinate spatial data with other public bodies involved in the delivery of the Games.
At the end of 2011, Transport for London (TfL) raised a concern about the impact of the Authority’s 13,500 employees on transport infrastructure close to the Olympic Park during the Games. They asked the Authority to mitigate this impact in order to better accommodate the anticipated spectator flows through Stratford and West Ham stations (both of which served the main stadium directly), as well as Canning Town (which acted as a hub serving the ExCeL Centre and the O2 Arena). The Authority additionally resolved to encourage employees using cars onto other forms of transport in light of road restrictions associated with the Olympic Route Network.
While workers make decisions about mode of transport based on geographical factors such as distance to transport hubs (Kitamura et al., 1997), they are also based on complex human factors including habit, personal security and disposable income (Jou et al., 2010). The extent to which these decision making processes could be influenced was unclear, but would rely on a much stronger understanding of existing commuting patterns. The Authority's 2012 Team tasked the Geospatial Team with establishing where the workforce was travelling from, the degree to which changes in mode of transport were viable, and where temporary coach services could be deployed most effectively.
2. PROJECT INITIATION
2.1 Constraints
The primary project constraint was the limited timeframe within which the work could be carried out. TfL made its request to Newham in November 2011, and research findings were required ahead of the Olympic Park Zone Reference Group civil contingency exercises in March 2012. For the data collection stage, significant security concerns and ICT challenges had to be addressed, as well as problems reaching consensus on the scope of the work and depth of information to be collected.
2.2 Data Sources
2.2.1 Human Resources data
The only existing source of information relevant to journey-to-work profiling was the Human Resources (HR) database, which included a home and work postcode for each of the Authority’s 13,549 employees. There was initial reluctance to utilise this database due to the sensitivity of information associated with individual employees. Senior Management at the Authority determined which information would be exported for use by the Geospatial Team, having considering advice on the analytical value of each database element, summarised in Table 1.
Field exported Function
Employee ID Data linking and cross-referencing Name Sense-checking and ad-hoc reporting Grade Determining implementation role Home postcode Spatial analysis
Work postcode Spatial analysis
Date of birth Quality control / ongoing monitoring Joining date Quality control / ongoing monitoring
Table 1. Exported Human Resources Data
Two elements - date of birth and date of joining the Authority - were agreed on the basis of being able to track changes to the travel patterns of the workforce over time. These elements would facilitate profiling distances travelled by employees with reference to their age and date of joining the organisation, and would also establish baseline data for a follow up study.
To comply with the Authority's policy on data protection, an inter-departmental agreement governing the use of the data was implemented. In considering the Authority's obligations under the 1998 Data Protection Act, it was noted that decisions based solely on the analysis of personal data may constitute "automated decision taking", and can be challenged under the legislation. This informed the approach that analytical findings would serve to guide managers in their discussions with
To determine these relationships, the Intranet Phone Book maintained by ICT was exported to supplement the analysis. The key difference between the two was employee coverage; the HR database included all 13,549 individuals employed directly and indirectly by the Authority (including school staff) whereas the Intranet Phone Book was limited to the 4,442 staff members who had centralised ICT profiles and who were essentially office-based PC users within the Authority.
2.2.3 Electronic Survey
As neither of the data sources outlined in 2.2.1 or 2.2.2 could be used to infer employee mode of transport or transit through a key station, attention turned to how new information could be gathered quickly from across the organisation.
It was proposed that the fastest way to gather data was to issue an electronic survey that would be presented to the Authority’s PC users at login. From a systems perspective, only the 4,442 staff members who appeared in the Intranet Phone Book could be reached by such a survey. The ICT Department developed a script to deliver the survey, and in parallel, work commenced with the 2012 Team and the Corporate Communications Team to establish what questions would be asked of respondents. There were challenges reaching consensus on issues such as whether the survey should accommodate free-text responses and whether option questions should be answered as absolutes or ranked along a scale. In addition, Senior Management made decisions about certain questions with reference to organisational and operational issues outside the scope of this research. The most significant of these interventions was a decision to omit a question asking how long it took employees to get to work. This omission impeded some aspects of the transport, respondents were asked explicitly whether they travelled through each of Stratford, West Ham and Canning Town stations. Where this applied, they were also asked whether they changed or boarded a train at one of these stations or whether they remained on a train passing through them. Questions were also asked of employees' willingness to use leave time and capacity to utilise working-from-home arrangements.
Options were presented aimed at determining levels of interest in various temporary transport initiatives during the Games. These included matching up employees interested in car-sharing, providing bicycle loan arrangements, road safety training for cyclists, and a coach service to connect Newham's head office with transport hubs outside the borough.
The survey was launched on Monday 13th of February and appeared to all PC users who logged in that morning. Response rates were tracked and the survey was reissued to non-British National Grid coordinates is attached to each postcode in the dataset. These coordinates are mapped to a resolution of 1 metre and represent the nearest addressable point to the calculated centroid of the addresses within a given postcode unit boundary (Ordnance Survey, 2012).
This database was deemed to be the most efficient way of linking the aforementioned databases into GIS, as the postcode centroid provided sufficient geographic accuracy to address general questions about where the workforce were based, for example; which side of a given train line, whether within or outside the borough or M25, etc.
Code-Point uses a specific format for postcodes where the field always totals 7 characters, such that E1 1AB will occupy the same number of characters as EC1A 1AB by adding to and subtracting from the spaces between the outcode and incode (Ordnance Survey, 2012).
However, postcodes in the HR database contained a single space between the outcode and incode. To facilitate automated matching, an additional field was added which reformatted the HR postcodes to match the Code-Point format. This was based on a combined Excel length/concatenate query which counted the number of characters in the outcode and inserted the appropriate number of spaces.
3. METHODOLOGY
3.1 Analysis
Three software packages were used to compile the four datasets; Microsoft Excel, Microsoft Access and ESRI ArcInfo. The four databases were joined in accordance with the linkages outlined in Table 2. To establish the basic geographic distribution of the workforce, cross-referencing was carried out in Access between the HR database and OS Code-Point ahead of the results of the Electronic Survey.
HR Database
Intranet Phone Book
Employee ID
Employee ID
Home Postcode
ICT Username
Work Postcode
Other Data
Other Data
Electronic Survey
OS Code-Point
ICT Username
Postcode
Survey Responses
Coordinates
Table 2. Summary of Data Linkages
In query builder, the join properties were set to include all HR records and only records from Code-Point where the joined fields were equal. This would show where a postcode present in the HR database was not one recorded in Code-Point, however project time constraints meant that no attempt was made to remediate records from any databases that failed to match. In this case, all but 45 out of 13,549 linked to Code-Point coordinates, matching 99% of records between the two databases.
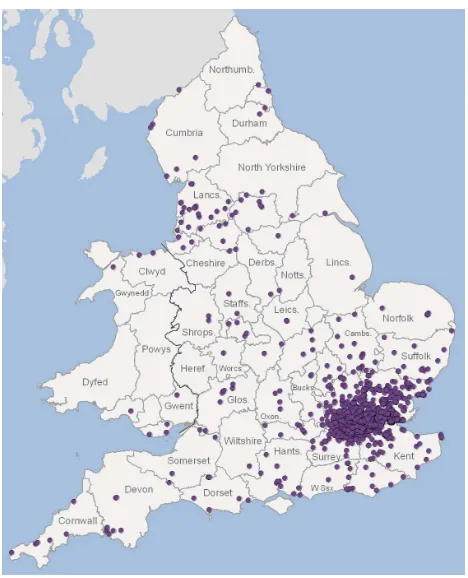
Using the Add XY data command in ArcInfo and specifying British National Grid as the coordinate reference system, the data could be visualised in GIS. This is illustrated in Figure 3.
Figure 3. Apparent Distribution of the Authority's Workforce
3.1.1 Data Integrity
Visualised in this way, the information raised questions about whether some of the implied journeys represented feasible daily commutes. When the data points around Manchester were isolated, they revealed a median employee age of 25.6, compared with the 42.9 average for the rest of the workforce. It
was inferred that many younger members of staff used their parents' addresses when their contracts began, and had subsequently relocated closer to London without updating HR. Other cases were assumed to involve second homes. Nonetheless, linear clustering evident along the A1(M), M11, M23, Midland Main Line and the Great Eastern Main Line suggested the data was accurately representing commuting distances out to approximately 80km.
3.1.2 Consistency of Sources
Assuming data was reliable to this distance, it was necessary to address whether there was sufficient similarity between the data sources in order to extrapolate results from the survey to the entire workforce. This representativeness has been shown to be a more important consideration than the number of responses collected (Cook et al., 2000). As discussed in Section 2.2.3, the Electronic Survey could only reach a third of employees, and contained an inherent sampling bias by querying PC users alone. The remaining 9,107 staff members were for the most part school staff, contractors, temporary workers and street cleaners, characterised as a hidden workforce in the context of local government management (McKeown & Lindorff, 2011). It was unclear whether these staff members were similarly distributed outside the borough. The proportional demand placed on public transport by this larger group was likely to be mitigated by the fact that the Games were taking place during the school summer holidays; although the split between schools and non-school staff could not be determined from the HR database. Subsequently, any extrapolation from the survey results to the entire workforce would represent the higher end of probable impact across transport modes.
By cross-referencing the Intranet Phone Book with the joined HR-Code-Point data, it was possible to visualise the distribution of PC users against those that were present in the HR database alone. This is illustrated for the Greater London area in Figure 4.
Figure 4. Comparison of Sources for Greater London
Three measures of similarity of the distribution were made; relative clustering as per nearest neighbour ratio, the percentage of employees found inside and outside Newham, and the percentage found inside and outside the M25. As Table 5 shows, PC users were less likely to live in Newham, and were
marginally more likely to commute into the borough from outside the M25.
All Records Survey Sample
Nearest Neighbour Ratio 0.10 0.13
Within Newham 47.8% 31.7%
Within M25 91.9% 87.2%
Table 5. Assessing Survey Sampling Bias
Weighing these characteristics against broadly similar levels of clustering and spatial distribution to the rest of the workforce, it was concluded that there was sufficient rational basis for extrapolating the results of the survey.
3.1.3 Incorporation of Survey
By the 27th of February, 3,118 responses had been received to the Electronic Survey, and work began to compile the results.
The geographic data volunteered by individual staff members was shown to contain more errors than the HR database; for example, employee names entered erroneously in the postcode field. When assessed separately, 91% of these records matched to Code-Point, compared with the 99% match rate via the HR database.
It was determined that 442 responses were from individuals not present in the Intranet Phone Book, who were identified as contractors and schools’ staff present in the HR database and PC users missing from the Intranet Phone Book. Although the associated responses could not be mapped without the respondent’s Employee ID (see Table 2), this data could still be used to evaluate non-spatial information such as levels of interest across the temporary transport initiatives.
The remaining 2,676 survey responses could be linked across all four datasets, and represented 70% of the total number of employees that could be reached by the survey. As thematic journey-to-work data often reveals patterns obscured at higher levels of aggregation (Sang et al., 2010), data was broken into sets representing the responses of different groups to the survey.
3.2 Findings
To establish the relative dependency on each mode of transport, the survey data was cross-referenced with the Euclidean distance between home and work postcodes, as calculated from Code-Point coordinates. Modes were grouped by their impact on, and susceptibility to, people and vehicle movements associated with the Games. Distance bands were calibrated manually, the results of which are shown in Figure 6.
3.2.1 Reliance on Car Use
The data showed a heavy reliance on car and rail use, peaking at 4km and 5km from place of work respectively. For distances under 2km, the survey showed that the majority of employees preferred to walk to work.
1,435 respondents (46%) reported driving to work, a proportion lower than the national average but comparable to other workforce studies (Gatersleben & Uzzell, 2007). 783 of these drivers (55%) said they also used their car during the day for
work purposes. This finding varied by distance, but employees who stated they needed their car for work accounted for the majority of car users in each 1km distance band up to 16km from place of work.
Figure 6. Employee Mode of Transport by Distance Travelled
In light of road restrictions associated with the Olympic Route Network and given the office-based nature of many of the corresponding service areas, guidance was issued to Service Managers to challenge the widespread use of private cars for work purposes. Data was summarised as per the reporting structures in the Intranet Phone Book and disseminated to managers for further investigation.
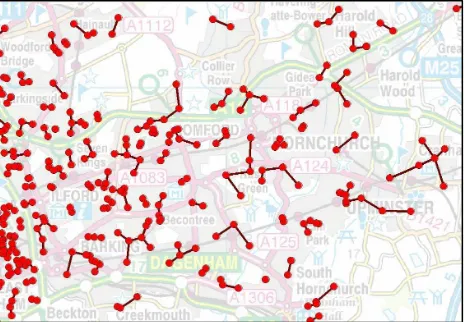
Additionally, 1,119 employees (554 of whom did not already drive to work) registered their interest in car sharing during the Games. This list was exported separately into GIS and ArcInfo's Near function was used to match potential car sharers. An unanticipated outcome of this process was the formation of small networks, reflecting the fact that while two employees may be closest to each other, a third employee may in turn be closest to one of these two, as illustrated in Figure 7. This was seen as beneficial in application, presenting opportunities for car sharing clubs and alternative connections for employees who could not combine their journeys. Using the ArcInfo Select by Location function, connections that crossed the River Thames were removed from the list of viable car-sharing arrangements, leaving 947 matched employees. Again the list was summarised in accordance with the reporting structures in the Intranet Phone Book.
Figure 7. ArcInfo Near Function Used to Match Car-Sharers
3.2.2 Transit through Key Stations
1,873 survey responses reported passing through one of the three key stations, with all but 188 of these actively boarding or changing trains. This suggested that 9,340 of the entire workforce would use these stations by default as part of their daily commute, accounting for 18,680 journeys. 10,322 of these journeys included travel through Stratford station, which had been expected to accommodate 345,470 extra journeys to and from the Olympic Park on Thursday the 2nd of August (ODA, 2011). The Authority had thus established that before any interventions to change staff travel patterns, the impact of its workforce represented only 3% of the additional movements expected on the busiest day of the Games.
Visualisation of this data in GIS revealed that 74% of the Authority's employees using these stations were coming into the borough from the east; this proportion rose to 80% for Stratford station. This distribution was consistent with data on the wider workforce examined in previous studies (Newham, 2010).
3.2.3 Viable changes
Despite quantifying the relatively low impact of the workforce in relation to crowd numbers anticipated during the Games, the Authority resolved to disperse unnecessary travel through the key stations to cover unforeseen difficulties. 449 respondents (suggesting 2,239 employees) passing through these stations indicated ability to switch to modes of transport other than car, and were subsequently encouraged to do so; however they represented only 24% of the projected workforce journeys through these stations. 473 other respondents (suggesting 2,359 employees) on the same routes had no transport alternative and were suggested as potential priority users of the remote access portal, particularly if they were travelling from west of the Jubilee line. Of the various temporary transport initiatives offered, this group expressed more interest in the temporary coach service (218 responses) than in any other initiative. Their distribution was examined in ArcInfo with reference to potential locations for a temporary coach service, along with a separate data set comprising all 1,062 respondents who expressed an unqualified interest in this service.
3.2.4 Coach Service
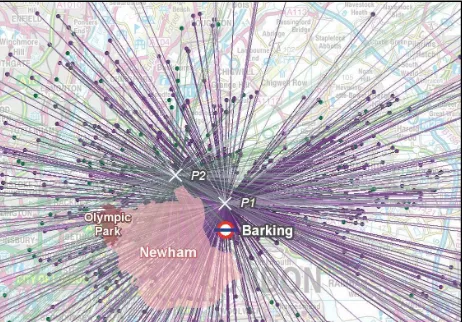
The geographic mean of the distribution of these points was established by averaging Eastings and Northings for employee addresses isolated in the two datasets. Considered along with operational factors, this distribution mean was used as a proxy indicator for the optimum location for the coach terminus. The geographic mean of employees expressing an unqualified interest in the coach service was a point in the vicinity of Barking station, shown as P1 in Figure 8. This was compared against the same point for employees using a key station and having no transport alternative, attributed to a location near Redbridge and shown as P2 in Figure 8.
This process aimed to establish only the general direction into the borough best served by this service. As the datasets suggested that most demand was concentrated to the east and north-east of the borough, Barking itself was chosen as a terminus for the coach service.
Figure 8. Geographic Mean of Potential Coach Users
3.3 Limitations
56% of all survey respondents requested specific information on what routes they should take between their home and place of work during the Games. Although network analysis is generally recognised as a core element of GIS-T modelling (Choi & Kim, 1994), there was insufficient time to build a multimodal network dataset for use in the ArcInfo Network Analyst extension. Had this been possible, a cost matrix could have been established to direct employees away from key stations while facilitating those with no transport alternative. It was also noted that while GIS was used simplistically to support the location of a terminus for the temporary coach service, the overall effectiveness of this service had not been established through analytical means. Again Network Analyst could be used to examine the relative strengths of various route options represented by additions to a network dataset.
Additionally, although a comprehensive spatial database had been created for this research, no information had been collected on employee commuting times for reasons discussed in 2.2.3. This data would have revealed where travel times were disproportionate to distance and assisted in the prioritisation of working-from-home and special absence arrangements.
3.4 Implementation
Ongoing communication and updates to TfL were facilitated through LOCOG’s One Plan workshops and the Olympic Park Zone Reference Group. Summary analysis which outlined staff travel intentions and ability to use alternative forms of transport was distributed to Service Managers, who made decisions to reduce or suspended services accordingly.
An information campaign was launched which advised staff not to drive privately owned cars into the borough during the Games, and a temporary parking permit regime was put in place across the borough. A regular coach service ran for 6 weeks between Barking and the Authority’s head office at the Royal Docks. Despite the low interest recorded in temporary transport initiatives related to cycling, this mode of transport was heavily promoted with the ambition of encouraging employees to cycle to work both during and beyond the Games period. 100 staff members joined the cycle safety training programme, compared with 115 employees who had expressed an interest through the survey.
Findings relating to car-sharing arrangements were not taken forward by Senior Management, nor were recommendations to reissue the survey at the end of the Games to determine the effectiveness of the information campaign. This was partly attributed to the internal market arrangements operated by the Authority, which occasionally inhibits collaboration between some teams. This left the survey baseline as the only record of how the Authority's employees may have travelled during the Games; the degree to which they followed through on their intentions was not assessed. In anecdotal terms, it was observed that the information campaign had encouraged a higher proportion of workers to avail of the special absence provision than had been indicated through the survey.
4. CONCLUSION
The Authority progressed from having very little understanding of the commuting characteristics of its workforce to a point where numbers and impacts had been clearly quantified in relation to routes and stations associated with the Games. The findings presented issues for consideration by Senior Management beyond the Games, highlighting some of the most arduous commutes across several counties and conversely, problematic use of cars for short distances, purportedly in support of the Authority's work.
GIS played a fundamental role in this research, not only in analysing and visualising information, but in understanding and rationalising limitations within and across the various datasets used. It facilitated a more robust comparison between a representative sample and a whole population dataset, and presented solutions to specific geographical inquiries.
HR data was shown to contain a high standard of geographic information compared to that volunteered by individual staff members, supporting the rationale of linking survey information to a centralised data source. The use of the electronic survey was validated in quantifying journeys through specific locations, to a level of confidence that would be difficult to reach through GIS analysis alone. The method of delivery generated a large amount of usable information quickly, facilitating the effective implementation of a Games-time staff travel plan.
Aspects of the collaborative element of the data collection stage and the ultimate implementation of the travel plan present cause for thought about the willingness to embrace GIS methods and findings, and suggest that in some settings the technology may be deployed to justify or reinforce a predetermined strategy. In these contexts, the role of the GIS analyst in communicating and informing is of as much importance as the associated analytical insight.
The outcomes of this research have resulted in a better understanding of the commuting patterns of a large London workforce and present methods and findings that can be generalised to similar urban working populations.
5. COPYRIGHT
Materials reproduced include © Ordnance Survey data Crown Copyright and database right 2012 and © Code-Point data Royal Mail Copyright and database right 2012
6. REFERENCES
Choi, K., and Kim, T.J., 1994. Integrating Transportation Planning Models with GIS: Issues and Prospects Journal of Planning Education and Research 13:199-207
Cook, C., Heath, F., and Thompson, R.L., 2000. A meta-analysis of response rates in web or internet-based surveys. Educational and Psychological Measurement 60(6): 821–23.
Gatersleben, B., and Uzzell, D., 2007. Affective Appraisals of the Daily Commute: Comparing Perceptions of Drivers, Cyclists, Walkers, and Users of Public Transport Environment and Behaviour 39(3): 416-431.
Jou, R.C., Hensher, D.A., Liu, Y.H., and Chiu, C.S., 2010. Urban Commuters' Mode-switching Behaviour in Taipai, with an Application of the Bounded Rationality Principle. Urban Studies 47(3): 650–665.
Kitamura, R., Mokhtarian, P., and Laidet, L., 1997. A micro-analysis of land use and travel in five neighbourhoods in the San Francisco Bay Area. Transportation 24(2): 125–58.
McKeown, T., and Lindorff, M., 2011. Temporary Staff, Contractors, and Volunteers: The Hidden Workforce in Victorian Local Government. Australian Journal of Public Administration 70(2): 185–201.
Newham, London Borough of, 2010. Local Economic Assessment 2010-2027, London, United Kingdom http://www.newham.gov.uk/NR/rdonlyres/807515EC-6E44-4858-BF47-A0E60F8861A0/0/NewhamLocalEconomic Assessment2010to2027.pdf (01 Mar. 2013).
Olympic Delivery Authority, 2011. Olympic Games Arrival and Departure Profiling Tool v2-5. Issued to London Borough of Newham, OPK Modelled tab.
Ordnance Survey, 2012. Code-Point User Guide and Technical Specification, Southampton, United Kingdom http://www.ordnancesurvey.co.uk/oswebsite/docs/user-guides/ code-point-user-guide.pdf (01 Mar. 2013).
Sang, S., O'Kelly, M., and Kwan, M.P., 2010. Examining Commuting Patterns: Results from a Journey-to-work Model Disaggregated by Gender and Occupation. Urban Studies 48(5): 891–909.