MAPPING SVALBARD GLACIERS WITH THE CRYOWING UAS
S. Solbøa,∗
, and R. Storvolda
a
Northern Research Institute (Norut), Forskningsparken, 9294 Tromsø, Norway –(stian.solbo, rune.storvold)@norut.no
Commission UAV-g, 2013
KEY WORDS:Glaciology, Glacier mapping, Glacier mass balance, glacier dynamics, UAS
ABSTRACT:
The remoteness of most Svalbard glaciers makes it difficult to perform regular in situ monitoring, especially in the melting season. Terminus areas (into the sea) and crevassed areas are in practice only accessible from the air. In this paper, first investigations on the feasibility of UAS based 3D measurements of glacier elevation is performed. The results show that UAS can be a valuable tool for glacier measurements in remote areas like Svalbard, where the only real alternative to measure glacier elevation in the ablation zone during the melt season is by manned aircraft. Imagery from repeated observations within a few days can be used to estimate dynamic mass loss rates when coupled to 3D modeling and feature tracking. Retrieval of these data is valuable, especially for glaciers terminating in the sea and surging glaciers.
1 INTRODUCTION
Svalbard is an archipelago in the Arctic Ocean, located about midway between Norway and the North Pole. With the excep-tion of some coastal lowlands, the landscape is mountainous with many large and small glaciers. Glaciers cover roughly 60% of the land area, with many outlet glaciers terminating in the sea. In central Spitsbergen, most glaciers are comparatively small due to the dry climate, but large valley glaciers and ice caps are frequent along both the west and east coasts. Several large ice caps exist on the eastern islands, Edgeøya, Barentsøya and Nordaustlandet. Most glaciers in the dry interior of Spitsbergen are cold-based, and move only 1–2 m per year, but in the more humid regions along the coasts, glacier velocities frequently are more than 10– 30 m per year, causing large crevasses to form (Ingolfsson, 2005). A significant number (at least 30%) of glaciers in Svalbard are surging-type glaciers. This means that from time to time they ad-vance with extraordinary high velocity, up to several km during a period of 3-6 years.
The remoteness of most Svalbard glaciers makes it difficult to perform regular in situ monitoring, especially in the melting sea-son. Terminus areas (into the sea) and crevassed areas are in practice only accessible from the air. However, there availabil-ity of manned aircrafts suitable for aerial mapping is limited in Svalbard. Hence, satellites are the source of remote sensing data used in practice for glacier monitoring. Synthetic aperture radar (SAR) satellites can provide daily acquisitions at moderate spatial resolutions (30–100 m), which is sufficient for the larger glaciers. Smaller glaciers require high-resolution satellite images, where in practice optical satellites provide best availability of data. How-ever, the climate in Svalbard yield low probability for cloud-free days, which makes tracking of smaller, fast moving (surging) glaciers impractical. Latest research finds that even within a small area such as Svalbard, large regional discrepancies in mass bal-ance occur, and in-depth studies of ice masses around the world are needed (Moholdt et al., 2010).
During the last few years, the Cryowing UAS system has been utilized periodically for measurements of the cryosphere in Sval-bard, including glaciers (Solbø and Storvold, 2011). In this paper we will present the first results on the analysis of the data. We concentrate on measuring the glacier elevation profile along the centerline and 3D modeling of the glacier terminus.
Previously, Crocker et al. have performed glacier elevation map-ping utilizing an UAS borne laser altimeter, where a digital eleva-tion model(DEM) was generated by interpolating laser elevaeleva-tion profiles from gridded flights (Crocker et al., 2012). In this work we will discuss data from a similar setup, but focusing on the elevation profile along the glacier centerline.
Anther objective of this work is to investigate if the recent meth-ods known as multiple view geometry (Hartley and Zisserman, 2004) for generating 3D models from a set of overlapping images from an ordinary camera is feasible for digital elevation mapping of inaccessible glaciers, this technique is also known as structure-from-motion (SfM). Multiple view geometry has become an es-sential tool for the civilian UAS industry, enabling the possibil-ity for fast DEM and orthophoto generation with relatively sim-ple and inexpensive equipment (Remondino et al., 2011, Sauer-bier et al., 2011). There is a wide selection of photogrammet-ric software tools available for the UAS industry, ranging from online services (Pix4D.com, pieneering.fi, dronemapper.com ) to desktop/workstation software (PiX4D, Agisoft PhotoScan Pro). There is also open source alternatives available (Deseilligny and Clery, 2011). Multiple view photogrammetry has previously been successfully utilized for glacier monitoring from manned aircraft (Gleitsmann and Kappas, 2006).
The glacier elevation profile is measured utilizing a payload con-sisting of a laser altimeter in combination with a high precision L1/L2 GPS receiver. The glacier terminus is mapped using a dig-ital camera post processed with multi view stereography, through SfM. The Cryowing UAS is capable of carrying both payloads si-multaneously, and measure both parameters during a single flight. Imagery from repeated observations within a few days can be used to estimate dynamic mass loss when coupled to the 3D mod-eling and feature tracking. Retrieval of these data is valuable, es-pecially for glaciers terminating in the sea and surging glaciers.
In this paper we demonstrate that the Cryowing (or other medium sized UAS with similar range and endurance) can be a valuable tool for glacier measurements in remote areas like Svalbard.
2 AIRCRAFT AND INSTRUMENTATION
mete-orology, climate, environment and Earth observation disciplines. The Cryowing can carry up to 10 kg payload, and has a maximum range and endurance of 500 km and 5 hours, respectively. Though the complete Cryowing system is limited to Norut’s (and partner institutions) in-house use, the system is assembled mainly from off-the-shelf components, and third party manufacturers utilize the same airframe in turn-key solutions. More information on the platform and its availability can be found online at Norut’s web
sitehttp://uas.norut.no.
The Cryowing can carry a wide variety of payload configurations. The core of the payload system is a computer for instrument con-trol, data storage, data time stamping and communication rout-ing. This payload computer, which runs a linux OS, is tightly connected to the power supply module that provides power to the system. This yields the opportunity to monitor the current con-sumption for each component, and the different instrument can be powered up and down when needed. Experience has shown that the ability to power cycle instruments can be essential to ensure measurements through long flights, specially for consumer grade cameras that are neither designed for automated operations, nor continuous measurements through several hours.
The payload operator on the ground is provided control and status for each instrument through a web interface on the ground sta-tion. In addition, if the required bandwidth is available, sample data can be downloaded in near real time. In theory, all commu-nication channels or modems that are supported by linux can be utilized. For the Ny- ˚Alesund flights discussed here, A 868MHz radio modem was utilized when within radio line of sight, with a fallback to Iridium satellite modem. The radio link is shared between flight control and payload communication, and natu-rally, flight control data is prioritized. In addition there is a sep-arate 433MHz link for manual control of the aircraft, used for launch and landing. 2.4GHz communication can not be used in Ny- ˚Alesund, as this part of the frequency spectrum is licensed to the Norwegian Mapping Authority’s space-geodetic measure-ment station.
For the measurements discussed in this paper, the payload con-sisted of the following instrumentation:
• Xsens MTi-G Inertial measurement unit (IMU) (Xsens
Tech-nologies B.V., 2013).
• Trimble BD982 L1/L2 GNSS receiver with dual antennas
• FAE LS1501 laser distance meter (FAE s.r.l, 2013)
• Canon EOS 450D digital SLR camera with a Canon EF
28mm f/2.8 objective lens (with focus adjusted and locked to infinite)
The IMU was sampled at 100Hz, whereas the GPS receiver and laser altimeter was recorded at 100Hz and 2KHz, respectively. The Canon 450D shot images roughly every second, the frequency of image acquisition is limited by the bandwidth of the USB bus that transfer the images to the camera.
3 UAS FLIGHT AND MEASUREMENT DATA
In this paper we are interested in data collected on a flight con-ducted July 18, 2012, which was one of of a total of 24 flights carried out during a major UAS campaign between July 9. and August 9. 2012, including on site preparations, unpacking and packing. All flights were located in the vicinity of Ny- ˚Alesund,
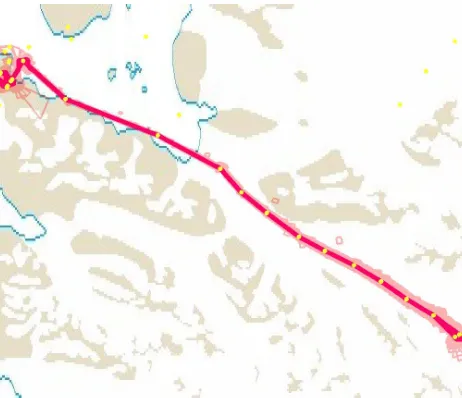
Svalbard. The flight of interest for this paper, which flight tra-jectory is shown in figure 1, was the only glacier flight equipped with the payload discussed in the previous section. The majority of the flights were carried out with a payload configuration where the Laser altimeter was in principle swapped with a pair of TriOS Ramses radiance and irradiance spectrometers. The purpose of this setup was direct measurements of spectral remote sensing reflectance to retrieve surface characteristics such as albedo and BRDF (bidirectional reflectance distribution function) as well at-mospheric aerosol properties, which is beyond the scope of this paper.
Figure 1: Trajectory of the Cryowing UAS flight (red). The pink polygons represent the coverage of the camera images, and the yellow dots are the flight waypoints. In this paper, we focus on the Kongsvegen glacier.
The flight lasted for 55 minutes, and covered a total distance of 131 km. The flight was programmed to keep an altitude around 200 m above the surface of the Kongsvegen glacier, which mean that the flight altitude ranged between ground level and 943 m m.a.s.l. During the flight 2220 images were acquired, note that this is less than the specified 1Hz frequency. We discovered that the specific camera had serious issues and froze repeatedly. Hence the payload computer watchdog had to perform several hard resets (power cycling) of the camera. The camera was de-commissioned after the flight.
The Kongsvegen glacier is a 20 km long surge type glacier lo-cated on the western side of Svalbard. Kongsvegen ends as it merges with the neighboring glacier, Kronebreen glacier, which is one of the largest glacier streams on Svalbard(Liestøl, 1988). Kongsvegen and Kronebreen moves with roughly 3 and 750 me-ters per year, respectively, and has a sea calving terminus (Wood-ward et al., 2002).
4 GPS PROCESSING AND ACCURACY
Though the onboard Trimble GPS receiver is capable of record-ing carrier phase of both L1 and L2 frequencies, this was not used during the flight. The onboard Iridium modem was too close in frequency, to the L1 GPS frequency resulting in frequent cy-cle slips making carrier phase post processing impossible. Thus, code phase DGPS processing was performed, which yield an ac-curacy of approximately 0.5 m.
In addition to the Trimble GPS receiver, there were two addi-tional receivers onboard. The Xsens MTi-G has an internal 50 channels L1 frequency GPS receiver with 4Hz update rate. The MTi-G’s internal processor utilize this to deliver real-time com-puted GPS-enhanced attitude/heading and inertial enhanced posi-tion/velocity data. Further, the Cryowing’s autopilot, an Micropi-lot MP2128G2, has an onboard 4Hz Ublox receiver. The Mi-cropilot datalog contain what is believed to be IMU and barome-ter enhanced position data, and we have utilized the default log-ging frequency of 5Hz. Note that the autopilot log does not con-tain any timestamps. We have co-registered the autopilot log with the payload data through a least squares fit to between the hori-zontal positions reported by the autopilot and the Trimble GPS receiver (without GrafNav post processing).
To validate the accuracy of the different GPS receivers, we com-pared the 3D positions of each GPS receiver relative to the Graf-Nav processed Trimble data. The horizontal and vertical GPS offsets for the entire flight is shown in figure 2 and figure 3, re-spectively. The mean and standard deviations for the position offsets are listed in table 1.
Figure 2: Horizontal accuracy of different GPS receivers, com-pared to GrafNav post processed Trimble data. The time axis is in seconds from launch.
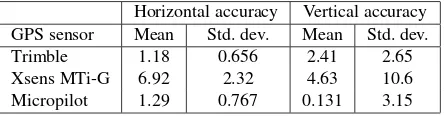
Table 1: Accuracy of onboard GPS receivers compared to Trim-ble GPS data post processed with GrafNav. The mean and stan-dard deviations have been calculated for data recorded throughout the whole flight. All figures are in meters.
Horizontal accuracy Vertical accuracy GPS sensor Mean Std. dev. Mean Std. dev.
Trimble 1.18 0.656 2.41 2.65
Xsens MTi-G 6.92 2.32 4.63 10.6
Micropilot 1.29 0.767 0.131 3.15
We observe all GPS receivers follow the post processed Trimble data within acceptable bounds. However, we note that there is a
Figure 3: Vertical accuracy of different GPS receivers, compared to GrafNav post processed Trimble data. The time axis is in sec-onds from launch.
significant difference in accuracy between the positions reported by the Xsens and Micropilot instruments, where the Micropilot seems to be far better. Both systems provide accelerometer and barometer enhanced position, hence it is natural to believe that the results should be similar, and the authors initial guess was that the Xsens system would be superior since it is advertised as a high performance system (mainly in attitude, though). As both the Micropilot and Xsens perform proprietary processing, we are not able to investigate the differences further. One theory is that the Xsens is a generic AHRS device suitable for numerous appli-cations, whereas the Micropilot is tailored for use in small and medium sized UAs. Further, we must not neglect the fact that the Micropilot is installed at Cryowing’s center of mass, whereas the Xsens is located in the front most part of the payload compart-ment in an effort to minimize magnetic disturbances from ferrous materials in the payload itself. The result is that the Xsens has a lever arm of approximately half a meter to the axes of vehicle rotations, which certainly is a disadvantage.
5 GLACIER TOPOGRAPHY MAPPING
The images acquired with the Canon EOS 450D was used to gen-erate a 3D topography model through multiple view geometry (Hartley and Zisserman, 2004) utilizing the Agisoft PhotoScan pro software. Aircraft positions from the GrafNav post processed Trimble data and attitude from the Xsens MTi-G IMU were uti-lized as auxiliary data for estimating the geographic location of each pixel. However, due to no available ground control points, as described in section 3, the produced DEM seemed to have an angular offset around an axis located in the NE-SW direction. I.e. the DEM seemed to be rotated around the roll axis. An angular offset between the Canon EOS 450D and the Xsens MTi-G is a plausible source for this error. Since the aircraft flew a single line, and not the usual grid pattern, there is little information redun-dancy for the bundle adjustment process to remove a systematic error in the roll direction.
resolution digital elevation models are to be produced from UAV photogrammetry, the terrain has to be properly prepared with a time consuming placement of GCPs (Rock et al., 2011).
However, we know that the ocean surface in front of the glacier is level on average. Waves and processing errors due to float-ing chunks of ice which move between overlappfloat-ing individual images are regarded as noise. We wrote a program in IDL (In-teractive Data Language) for estimating the DEM bias by manual selection of a water body. The bias from the horizontal plane is estimated by fitting the bilinear surface which minimize the chi-squared error. An unbiased DEM is then calculated by subtract-ing the estimated bias plane. Note that we do not try to attempt to account for any horizontal offsets caused by a misalignment by the IMU.
Figure 4 shows the resulting unbiased DEM. An orthophoto mo-saic with spatial resolution of 7 cm has also been generated, this is displayed in figure 6.
Figure 4: Elevation model from the terminus zone of the Krone-breen glacier. Produced from the Canon EOS 540D with Agisoft PhotoScan pro software utilizing the aircraft position and attitude as auxiliary data. Note that the DEM only cover a small strip around the glacier center line.
Figure 5: Elevation profile along the glacier centerline retrieved from the DEM shown in figure 4.
We observe that in the lower part of the glacier the image bundling software easily match the different images to a visually pleasing
Figure 6: Orthophoto mosaic of the Kronebreen glacier terminus. Note that the DEM only cover a small strip around the glacier center line.
mosaic. The successful processing is caused by the large amount of crevasses and debris in the glacier which yields numerous sta-tistical key-points for the matching process. We note that the crevassed pattern look nearly fractal in nature, so intuitively the matched images should be of similar scale.
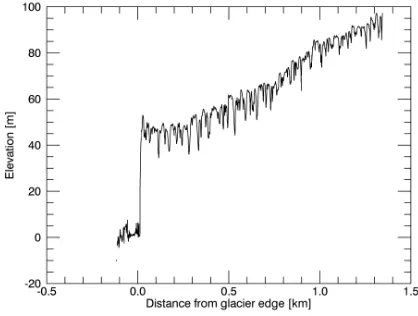
Figure 7: Elevation profile of the Kongsvegen glacier retrieved by laser altimeter. Both ascending (asc) and descending (dec) legs are shown. The aircraft flight altitude is shown for reference.
An FAE LS-1501 laser altimeter data has been corrected for air-plane orientation utilizing data from the Xsens MTi-G. I.e. the spatial location of each illuminated spot on the ground has been calculated. By subtracting the vertical distance from the GrafNav processed Trimble positions we get the elevation profile of the ground beneath the flight trajectory. The processing is similar to what Crocker et al. presented in (Crocker et al., 2012). The re-sulting elevation profile for the Kongsvegen glacier is shown in figure 7.
measure distances of 200 m when the reflectivity of the ice drops due to impurities (rocks, gravel and other debris).
6 CONCLUSIONS AND FURTHER WORK
In this paper we have investigated the feasibility of UAS based el-evation measurements of inaccessible glaciers on Svalbard. The glacier elevation profile is measured utilizing a payload consist-ing of a FAE-LS1501 laser altimeter in combination with a high precision L1/L2 GPS receiver. The glacier terminus is mapped using a digital camera post processed with multi view stereogra-phy, through a process known as bundle adjustment. The Cry-owing UAS is capable of carrying both payloads simultaneously, and measure both parameters during a single flight. However, the laser altimeter is found to have too short range over the ablation zone of the glacier where the surface reflectance is low. For future campaigns the laser altimeter will be replaced with a more power-ful version capable of providing overlap in the elevation profiles retrieved by multiple view photogrammetry and laser altimetry for the areas below and above the firn line, respectively.
The accuracy of the surface elevation profile retrieved from laser altimetry is directly related to the accuracy of the onboard GPS receiver. Preferably a high precision L1/L2 GPS receiver capa-ble of carrier phase processing should be utilized. Data from the flight show that if no high-precision GPS is available, the position information provided by the Micropilot MP2128 g2 autopilot is more accurate than those of the Xsens MTi-G IMU.
Ground control points are essential to generate an accurate DEM from multiple view geometry. Preferable measurements should be collected in a grid pattern covering known points located on the lateral moraines on both sides. Alternatively, a known refer-ence plane like the sea-surface can be utilized, as demonstrated in this article.
These initial measurements presented in this paper were an add on to a measurement campaign for surface albedo, hence little auxiliary reference data were available. The experiments show yields promising results, The retrieved elevation profile of the Kongsvegen needs to be validated in a controlled experiment, but appears to legitimate given the available DEM of Svalbard, and knowledge of its accuracy. As noted previously, further experi-ments with more ground truth and in-situ measureexperi-ments has to be obtained for a proper accuracy validation.
Given the range and endurance of a medium sized UAS, such as the Cryowing, the experiment demonstrate that such a system can be a valuable tool for glacier measurements in remote areas like Svalbard, where the only real alternative to measure glacier el-evation the ablation zone during the melt season is by manned aircraft. Imagery from repeated observations within a few days can be used to estimate dynamic mass loss when coupled to the 3D modeling and feature tracking. Retrieval of these data is valu-able, especially for glaciers terminating in the sea and surging glaciers.
Acknowledgements
This work has been financed by the Norwegian Research Council under contract Arctic EO and Fram Center Flagship Program Pol-havet. The authors would like to thank our colleagues at Norut. The Cryowing software has been developed by Nj˚al Borch and Daniel Stødle. Kjell Sture Johansen and Andreas Tøllefsen as-sembled the airframe, developed the instrumentation and was part of the flight team. Finally, the authors would like to thank Jostein Sveen at Andøya Rakettskytefelt for his valuable contribution to
the flight campaign. Finally, the authors would like to thank Andøya Rakettskytefelt and Kings Bay for the use of their fa-cilities at Ny- ˚Alesund during the flight campaign.
REFERENCES
Crocker, R. I., Maslanik, J., Adler, J. J., Palo, S. E., Herzfeld, U. C. and Emery, W. J., 2012. A sensor package for ice surface observations using small unmanned aircraft systems. IEEE T. Geoscience and Remote Sensing 50(4), pp. 1033–1047.
Deseilligny, M. P. and Clery, I., 2011. Apero, an open source bundle adjusment software for automatic calibration and orienta-tion of set of images. In: Proceedings of the ISPRS Symposium, 3DARCH11.
FAE s.r.l, 2013. http://www.fae.it/cms/ls1501.
Gleitsmann, L. and Kappas, M., 2006. Glacier monitoring survey flights below clouds in Alaska: Oblique aerial photography utilis-ing digital multIple-image photogrammetry to cope with adverse weather. EARSeL eProceedings 5(1), pp. 42–50.
Hartley, R. and Zisserman, A., 2004. Multiple View Geometry in computer vision. Cambridge University Press.
Ingolfsson, O., 2005. Outline of the geography and geology of svalbard.
Liestøl, O., 1988. The glaciers in the Kongsfjorden area, Spits-bergen. Norsk Geografisk Tidsskrift - Norwegian Journal of Ge-ography 42(4), pp. 231–238.
Moholdt, G., Nuth, C., Hagen, J. O. and Kohler, J., 2010. Re-cent elevation changes of svalbard glaciers derived from repeat track icesat altimetry. Remote Sensing of Environment 114(11), pp. 2756–2767.
Remondino, F., Barazzetti, L., Nex, F., Scaioni, M. and Sarazzi, D., 2011. Uav photogrammetry for mapping and 3d modeling– current status and future perspectives. International Archives of the Photogrammetry, Remote Sensing and Spatial Information Sciences 38, pp. 1.
Rock, G., Ries, J. and Udelhoven, T., 2011. Sensitivity analysis of uav-photogrammetry for creating digital elevation models (dem). International Archives of the Photogrammetry, Remote Sensing and Spatial Information Sciences 38, pp. 1.
Sauerbier, M., Siegrist, E., Eisenbeiss, H. and Demir, N., 2011. The practical application of uav-based photogrammetry under economic aspects. International Archives of the Photogrammetry, Remote Sensing and Spatial Information Sciences 38, pp. 1.
Solbø, S. and Storvold, R., 2011. Using Unmanned Aerial Sys-tems for Climate and Environmental research in Ny- ˚Alesund . In: 10th Ny- ˚Alesund Seminar, NILU, Kjeller, Norway.
Solbø, S. and Storvold, R., 2013. The CryoWing unmanned aerial system for scientific measurements. In: First Conference of the International Society for Atmospheric Research using Remotely-piloted Aircraft, ISARRA, Palma de Mallorca, Spain.
Woodward, J., Murray, T. and McCaig, A., 2002. Formation and reorientation of structure in the surge-type glacier kongsvegen, svalbard. Journal of Quaternary Science 17(3), pp. 201–209.
Xsens Technologies B.V., 2013.