LANDSLIDE MONITORING USING INSAR TIME-SERIES AND GPS OBSERVATIONS,
CASE STUDY: SHABKOLA LANDSLIDE IN NORTHERN IRAN
S. Mirzaee a, *, M. Motagh b, c, B. Akbari a
a Forest, Range and Watershed Management Organizations of Iran
b GFZ German Research Centre for Geosciences, Department of Geodesy, Section of Remote Sensing, Potsdam, Germany
c Institute for Photogrammetry and GeoInformation, Leibniz University Hannover, 30167 Hannover, Germany
Commission III, WG III/3
KEY WORDS: Landslide, InSAR Time Series, GPS, ALOS
ABSTRACT:
Shabkola is a village located in Mazandaran province of northern Iran that suffers from the mass movement happening in the upstream. Deforestation and changes to land use are the main reasons for the soil instability in this region, which together with steep slope, relatively high precipitation rate and natural erosion has led to such a condition. The area of mass movement is approximately 90 hectares which is a big threat for people living in the region. In this study, we have utilized two different geodetic techniques including InSAR time-series analysis and GPS measurements to assess slope stability in Shabkola. The SAR dataset includes 19 ALOS/PALSAR images spanning from July 2007 to February 2011 while GPS observations are collected in 5 campaigns from September 2011 to May 2014. Displacement as much as approximately 11.7 m in slope direction was detected by GPS observations for the 2011-2014 time period. Most of the slope geometry is in north-south direction, for which the sensitivity of InSAR for displacement detection is low. However, ALOS PALSAR data analysis revealed a previously unknown landslide, covered by dense vegetation in the northern part of main Shabkola landslide, showing line-of-sight velocity of approximately 2cm/year in the time period 2007-2011.
* Corresponding author
1. INTRODUCTION
Landslides are among the most common natural hazards in mountainous regions with steep slopes. Due to the potential loss of properties and lives, which may result from such phenomena, landslide assessment and monitoring is one of the main responsibilities in each community in order to give a perspective for stabilization processes (Avşar et al., 2014; Mizal-Azzmi et al., 2011; Mulia and Prasetyorini, 2013). In this regard, different geodetic techniques can provide important insights to this problem (Delacourt et al., 2007; Gili et al., 2000; Pardeshi et al., 2013).
Global positioning system (GPS/GNSS) provides precise (mm-level) 3 dimensional and pointwise information of ground surface motion and has been widely used for measuring mass movement and landslide applications (Akbarimehr et al., 2013; Peyret et al., 2008; Squarzoni et al., 2005). However this millimetre level of accuracy is obtained through relatively short baselines between receivers and/or by continuous observations (Bossler et al., 1980; Komac et al., 2015; Remondi, 1985).
On the other hand, synthetic aperture radar interferometry (InSAR) is an all-weather, cost effective technique that provides information with high spatial and temporal resolution. The technique is particularly useful for slow-moving landslides and large regions, where the use of ground-based surveying is not practical (Akbarimehr et al., 2013; Bovenga et al., 2012; Colesanti and Wasowski, 2006; Haghshenas Haghighi and Motagh, 2016; Tong and Schmidt, 2016; Wasowski and
Bovenga, 2014). Challenges for the InSAR technique arise when there exist spatial and temporal decorrelations due to vegetation coverage, rough terrain and big deformations or phase artefacts due to atmosphere (Hanssen, 2001; Singleton et al., 2014; Tang et al., 2015; Yun et al., 2007).
The existing satellite-based SAR sensors work in X-, C- or L-band frequencies, which have the wavelengths of ~3, ~6 and ~24cm respectively. The longer the wavelength is, the more penetration occurs into the plant canopy and therefore the decorrelations due to vegetation coverage decreases (Brown et al., 1992; Martinis and Rieke, 2015).
Northern cities of Iran on the southern rim of the Caspian Sea are located in a kind of geographical areas that are partially mountainous and partially flat between Alborz Mountains and Caspian Sea. This area is mostly covered by dense and sparse vegetation, which causes decorrelations in interferometric measurements and is a challenge for InSAR analysis. This issue should be carefully considered when using an InSAR dataset to monitor slope stability in this region.
In this study, we have utilized two different geodetic techniques including InSAR time-series analysis and GPS to analyse landslide motion in Shabkola region. The SAR dataset includes 19 ALOS/PALSAR images spanning July 2007 to February 2011, while GPS observations are collected in 5 campaigns from September 2011 to May 2014. InSAR time series analysis is done using Persistent scatterer interferometry (PSI) technique. The results are presented and compared to evaluate The International Archives of the Photogrammetry, Remote Sensing and Spatial Information Sciences, Volume XLII-1/W1, 2017
heterogeneous surface motion on the landslide and assess the consistency between different methods.
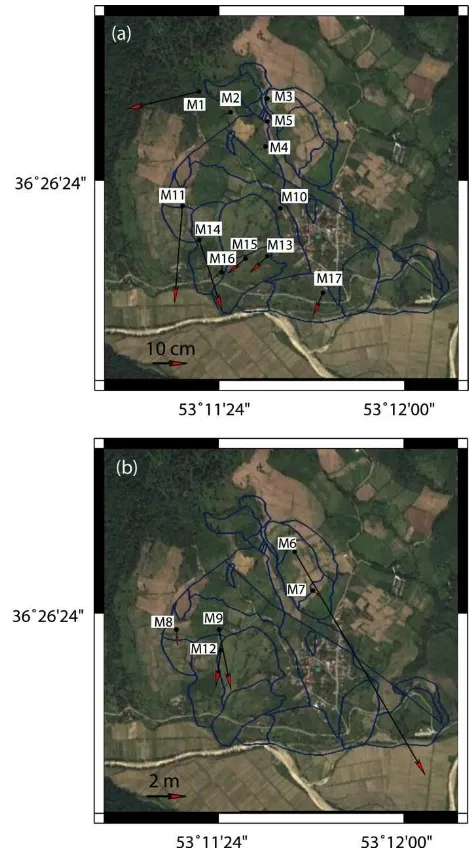
Figure 1: Google Earth image of the study area. Shabkola village is highlighted with a red rectangle in the south east of Sari city. Blue rectangle in figure (a) shows the footprint of the
cropped radar images used in this study. Blue polygons in figure (b) show the active region of Shabkola landslide while red triangles and black circles are the reference and measuring
GPS stations, respectively.
2. STUDY AREA
Mazandaran province of northern Iran, especially areas located south of Sari, the capital city of the province, suffers from numerous landslides, and every year a lot of agricultural fields houses, and roads are destroyed by such phenomena. Development of manmade structures built at roads upstream, deforestation and destroying natural resources are some of the main causes of mass movement in this area. The landslides often happen during period of high precipitations, threatening lives and properties and disrupting transport and access to rectangle on the Google Earth image of the study area.
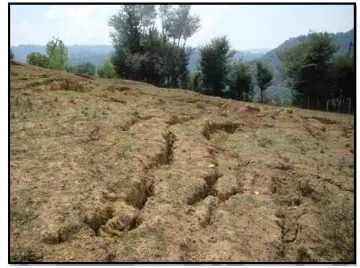
From the geological point of view, there are formations from Cenozoic period in the landslide region, which is a suitable structure for slope instability and creep. The area units consist of sandy limestone and calcareous sandstones of Paleocene, marl, calcareous sandstone, sandy limestone and a little conglomerate of Miocene and silty marl, silt and marl limestone of Pliocene. dynamics of the landslide. Figure 2 shows an exemplary ground picture form part of the landslide with tensile cracks in the northwest-southeast direction.
Figure 2: A landslide-prone area with tensile cracks in the northwest-southeast direction
3. GEODETIC DATA ANALYSIS
3.1 GPS processing
Our GPS observations are collected in 5 campaigns from September 2011 to May 2014. The GPS network consisted of 5 reference Benchmarks outside the landslide body and 17 measuring points scattered on the objective slope. The location of all GPS stations is depicted in Figure 1(b) with red triangle for reference benchmarks and black circles for measuring points. All the observations were collected with dual frequency receivers in static mode and linked to the global reference frame with a national reference station located 27 km south from Shabkola. GPS processing and adjustment was implemented in Columbus Network Adjustment Software with minimum constraints method (Sillard and Boucher, 2001).
3.2 InSAR analysis
We utilized 19 PALSAR data from Japan Aerospace Exploration Agency (JAXA) ALOS/PALSAR mission. The data was acquired in an ascending geometry from July 2007 to February 2011. We analyzed the data using InSAR time series technique of persistent/permanent scatterer interferometry (PSI). We used 18 single master interferograms for PSI analysis with the reference master selected as the image acquired on 13th of May, 2010. DORIS software (Kampes et al., 2004) was used for interferometric processes and PSI analysis was implemented using StaMPS method (Hooper and Zebker, 2007; Hooper, 2008). 30-meter spatial resolution digital surface model of ALOS (AW3D30) was used for topographic phase removal and geocoding in interferometric processing. Persistent scatterer candidates were initially selected by amplitude dispersion index with a threshold value of 0.4 and then filtered by temporal coherence (Hooper et al., 2004). Finally, ambiguity of phase values was resolved through 3D phase unwrapping and displacement time series are obtained through least square inversion (Hooper and Zebker, 2007).
In order to have a better assessment of the InSAR technique, a sensitivity analysis (Cascini et al., 2010) was first done using geometric information from satellite and earth surface topography. Equation 1 shows the relationship between the sensitivity of radar observations and geometric parameters to detect displacements (Haghshenas Haghighi and Motagh, 2016).
cos( ) [sin( ) cos( )cos( ) cos( )sin( )] sin( )sin( )
cos( )sin( )
s h
h
(1)
In this equation,
and show slope and aspect angles respectively derived from ALOS 30m resolution DEM, whileh and are heading and incidence angles of the satellite respectively. Zero value in s would correspond to the lowestsensitivity while 1 corresponds to the highest sensitivity to slope displacement.
3.3 Slope displacement
InSAR velocity values are one dimensional in the Line-Of-Sight (LOS) direction from satellite to the ground, while GPS provides 3 dimensional displacement values. In order to be able to compare the results together, both GPS and InSAR velocity measurements are projected to the slope direction (Cascini et al., 2010; Schlögel et al., 2015). For the InSAR observation, the slope displacement (Dslope) was retrieved using the following equation:
/ ( . )
slope los los slope
D D n n (1)
where, Dlosis the displacement in line-of-sight direction,
los
n is the LOS unit vector and nslopeis the slope unit vector,
respectively that are obtained from the following equations:
( sin cos , sin sin , cos )
los s s
n (2)
( sin cos , cos cos , sin )
slope
n (3)
Where andsare incidence angle with respect to the flat earth and the angle between azimuth and north direction respectively. and show the slope and aspect angles for each point on the land surface.
For 3D GPS observations, the conversion to the slope direction is done through the following equation:
'
( , , ).
slope x y z slope
D d d d n (4)
4. RESULTS
4.1 GPS result
Horizontal GPS displacement vectors for the period between 8th of September, 2011 and 7th of May, 2014 are depicted in Figure 3. Most of the stations have cumulative horizontal displacement less than 50 centimetres (Figure 3(a)), while 5 stations have large horizontal displacements (Figure 3(b)) up to several meters; for visualization purposes we used two sub figures in Figure 3 to show the displacement vectors as the displacement values vary from a few centimetres to several meters. The station M6 in Figure 3(b), which is located at the northeast of the area, has the largest displacement, which is 11.4 m in horizontal and -2.3 m vertical direction. Figure 4 shows horizontal and vertical displacement values of this station during all 5 GPS campaigns; the amount of motion in slope
direction is plotted with a black triangle. Positive values for East-West directed displacements show eastward movement.
Figure 3: GPS horizontal displacement vectors for a period between 8th of September, 2011 and 7th of May, 2014. (a) Stations with displacement values less than 50 centimetrs. (b)
Stations with displacement values up to several meters.
Figure 4: (a) GPS driven Displacement time series of point 6 (M6 in Figure 3(b)) in slope, East-West, North-South and
Vertical direction.
4.2 InSAR results
For the period of time between 2007 and 2011 we analysed slope behaviour by using time series of InSAR observations The International Archives of the Photogrammetry, Remote Sensing and Spatial Information Sciences, Volume XLII-1/W1, 2017
from ALOS/PALSAR images. The sensitivity map of the area of interest is initially produced to investigate the effect of slope and satellite geometry on the InSAR results (Figure 5).
Figure 5: Sensitivity map of the LOS observations from the ALOS satellite in ascending mode with incidence angle of 35°
and heading of -13° to the slope movement in Shabkola landslide. Polygons show the landslide body. GPS reference and measuring stations are depicted with red triangles and black
circles, respectively. H and L vectors show the heading and LOS direction of the satellite, respectively.
As seen in Fig. 5, most of the main landslide body in Shabkola and GPS stations are located in an area with very low sensitivity values of LOS observations to displacements. Due to near-polar orbits of SAR data, InSAR observations have the least sensitivity to motion in north-south direction. In Shabkola, the main component of displacement in the landslide body, as it was measured by GPS observations, is the southward motion, which is approximately parallel to the satellite flight heading angle, and therefore perpendicular to the LOS direction. As a result InSAR technique is not appropriate for monitoring displacement in Shabkola landslide.
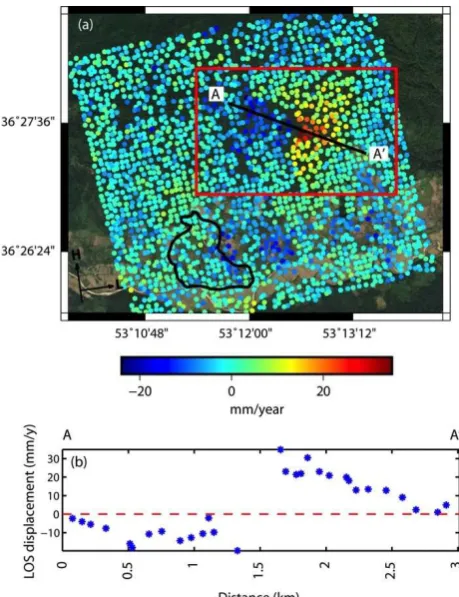
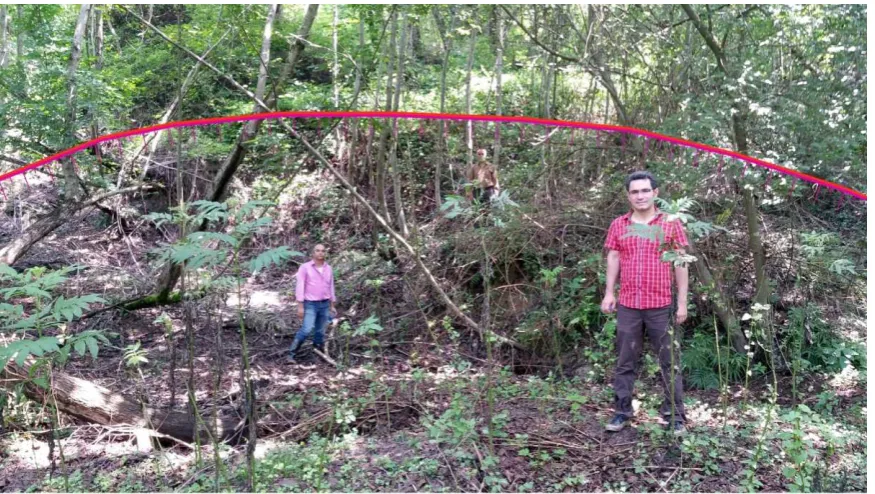
Although InSAR time series analysis with ALOS ascending dataset was not effective to monitor displacement of the main body of Shabkola landslide due to inappropriate slope geometry, but we observed a previously unknown landslide, covered by dense vegetation in the northern part of the area. The area is depicted with a red rectangle over LOS velocity map in Figure 6(a). The radar displacement in this region includes two different sections. The western slope which is moving toward east with an average LOS velocity of -8mm/y and maximum of -24mm/y, and the eastern slope moving toward west with an average and maximum LOS velocity of 10 and 35mm/y, respectively. The profile plotted in Figure 6(b) shows the LOS velocity along AA' in Figure 6(a). Positive values show the motion is towards the sensor while negative values show the surface is moving away from the sensor in the LOS direction. In a field observation which was done in May 2016, numerous features such as tensions, cracks and scarps related to ongoing surface displacement was observed in this area. Figure 7 shows an exemplary scarp observed in this area.
5. CONCLUSION
In this paper, the kinematics of Shabkola landslide in Mazandaran, north of Iran was investigated using two different geodetic techniques of InSAR time series analysis in the period between 2007 and 2011 and GPS observations in the period
between 2011 and 2014. Results obtained from GPS showed an active mass movement that in some regions reaches to several meters of displacement in the slope direction. Due to improper slope geometry, which is approximately in the North-South direction, parallel to the satellite flight direction of our radar dataset, the InSAR analysis was not able to monitor and detect the surface motion on the main body of Shabkola landslide. However, the time-series analysis of ALOS data revealed a previously unrecognized area of landslide which was located in an area with dense vegetation coverage, benefiting from penetration ability of long wavelength (L-band) SAR system for deformation assessment. This area exhibited an approx. 2cm/y displacement in the LOS direction between 2007 and 2011. Numerous scarps, cracks and tensions observed during a field survey in 2016, confirmed the ongoing displacement in this area.
Our future work will focus on integrating the results presented here with geological and hydrological information to have a better understanding of complex behaviour of landslide in Shabkola.
Figure 6: (a) LOS displacement map from ALOS dataset over Shabkola landslide. Positive values are moving toward the sensor and negative values are moving away from the sensor in
the LOS direction. Black boundary is the Shabkola landslide body measured by GPS stations. Red rectangle shows the active
region of the old landslide. H and L vectors show the heading and LOS direction of the satellite. (b) AA' LOS velocity profile
depicted by black line in figure (a).
Figure 7. Ground picture of one of the scarps (red line) observed in the landslide detected by ALOS data analysis
ACKNOWLEDGMENT
We thank Farazamin Consulting Engineering Company for helping with GPS observations and providing Columbus software. We also thank Seyed Mohsen Mousavi and Yahya Ezzati for helping with the field observations. ALOS original data is copyright Japanese Aerospace Exploration Agency and provided under proposal 1162
REFERENCES
Akbarimehr, M., Motagh, M., Haghshenas, M., 2013. Slope Stability Assessment of the Sarcheshmeh Landslide, Northeast Iran, Investigated Using InSAR and GPS Observations. Remote Sens. 5, 3681–3700.
Avşar, Ö., Akgün, H., Koçkar, M.K., 2014. Investigation of the failure mechanism and stabilization of a landslide in weathered tuffite, Giresun, northeastern Turkey. Environ. Earth Sci. 72, 3723–3740.
Bossler, J.D., Goad, C.C., Bender, P.L., 1980. Using the Global Positioning System (GPS) for geodetic positioning. Bull. Géodésique 54, 553–563.
Bovenga, F., Wasowski, J., Nitti, D.O., Nutricato, R., Chiaradia, M.T., 2012. Using COSMO/SkyMed X-band and ENVISAT C-band SAR interferometry for landslides analysis. Remote Sens. Environ. 119, 272–285.
Brown, R.J., Manore, M.J., Poirier, S., 1992. Correlations between X-, C-, and L-band imagery within an agricultural environment. Int. J. Remote Sens. 13, 1645–1661.
Cascini, L., Fornaro, G., Peduto, D., 2010. Advanced low- and full-resolution DInSAR map generation for slow-moving landslide analysis at different scales. Eng. Geol. 112, 29–42.
Colesanti, C., Wasowski, J., 2006. Investigating landslides with space-borne Synthetic Aperture Radar (SAR) interferometry. Eng. Geol. 88, 173–199.
Delacourt, C., Allemand, P., Berthier, E., Raucoules, D., Casson, B., Grandjean, P., Pambrun, C., Varel, E., 2007. Remote-sensing techniques for analysing landslide kinematics: A review. Bull. la Soc. Geol. Fr.
Gili, J.A., Corominas, J., Rius, J., 2000. Using Global Positioning System techniques in landslide monitoring. Eng. Geol. 55, 167–192.
Haghshenas Haghighi, M., Motagh, M., 2016. Assessment of ground surface displacement in Taihape landslide, New Zealand, with C- and X-band SAR interferometry. New Zeal. J. Geol. Geophys. 59, 136–146.
Hanssen, R.F., 2001. Radar Interferometry - Data Interpretation and Error Analysis, Journal of Physics A: Mathematical and Theoretical.
Hooper, A., Zebker, H.A., 2007. Phase unwrapping in three dimensions with application to InSAR time series. J. Opt. Soc. Am. 24, 2737–2747.
Hooper, A., Zebker, H., Segall, P., Kampes, B., 2004. A new method for measuring deformation on volcanoes and other natural terrains using InSAR persistent scatterers. Geophys. Res. Lett. 31, 1–5.
Hooper, A.J., 2008. A multi-temporal InSAR method incorporating both persistent scatterer and small baseline approaches. Geophys. Res. Lett. 35.
Kampes, B.M., Hanssen, R.F., Perski, Z., 2004. Radar interferometry with public domain tools, in: European Space Agency, (Special Publication) ESA SP. pp. 59–68.
Komac, M., Holley, R., Mahapatra, P., van der Marel, H., Bavec, M., 2015. Coupling of GPS/GNSS and radar interferometric data for a 3D surface displacement monitoring of landslides. Landslides 12, 241–257.
Martinis, S., Rieke, C., 2015. Backscatter analysis using multi-temporal and multi-frequency SAR data in the context of flood mapping at River Saale, Germany. Remote Sens. 7, 7732–7752.
Mizal-Azzmi, N., Mohd-Noor, N., Jamaludin, N., 2011. Geotechnical approaches for slope stabilization in residential area, in: Procedia Engineering. pp. 474–482.
Mulia, A.Y., Prasetyorini, L.A., 2013. Slope Stabilization based on Land use Methods in Ambang Sub River Basin. Procedia Environ. Sci. 17, 240–247.
Pardeshi, S.D., Autade, S.E., Pardeshi, S.S., 2013. Landslide hazard assessment: recent trends and techniques. Springerplus 2, 1–11.
Peyret, M., Djamour, Y., Rizza, M., Ritz, J.F., Hurtrez, J.E., Goudarzi, M.A., Nankali, H., Chéry, J., Le Dortz, K., Uri, F., 2008. Monitoring of the large slow Kahrod landslide in Alborz mountain range (Iran) by GPS and SAR interferometry. Eng. Geol. 100, 131–141.
Remondi, B.W., 1985. Global positioning system carrier phase: Description and use. Bull. Géodésique 59, 361–377.
Schlögel, R., Doubre, C., Malet, J., Masson, F., 2015. Landslide deformation monitoring with ALOS/PALSAR imagery: A D-InSAR geomorphological interpretation method. Geomorphology 231, 314–330.
Sillard, P., Boucher, C., 2001. A review of algebraic constraints in terrestrial reference frame datum definition. J. Geod. 75, 63– 73.
Singleton, A., Li, Z., Hoey, T., Muller, J.-P., 2014. Evaluating sub-pixel offset techniques as an alternative to D-InSAR for monitoring episodic landslide movements in vegetated terrain. Remote Sens. Environ. 147, 133–144.
Squarzoni, C., Delacourt, C., Allemand, P., 2005. Differential single-frequency GPS monitoring of the La Valette landslide (French Alps). Eng. Geol. 79, 215–229.
Tang, P., Chen, F., Guo, H., Tian, B., Wang, X., Ishwaran, N., 2015. Large-area landslides monitoring using advanced multi-temporal InSAR technique over the giant panda habitat, Sichuan, China. Remote Sens. 7, 8925–8949.
Tong, X., Schmidt, D., 2016. Active movement of the Cascade landslide complex in Washington from a coherence-based InSAR time series method. Remote Sens. Environ. 186, 405– 415.
Wasowski, J., Bovenga, F., 2014. Investigating landslides and unstable slopes with satellite Multi Temporal Interferometry: Current issues and future perspectives. Eng. Geol.
Yun, S.H., Zebker, H., Segall, P., Hooper, A., Poland, M., 2007. Interferogram formation in the presence of complex and large deformation. Geophys. Res. Lett. 34.