METHODS
Do focus groups and individual interviews reveal the same
information for natural resource valuation?
Michael D. Kaplowitz *, John P. Hoehn
Department of Resource De6elopment,311A Natural Resource Building,Michigan State Uni6ersity,East Lansing,MI48824,USA
Received 2 December 1999; received in revised form 15 May 2000; accepted 30 June 2000
Abstract
Focus groups and individual interviews have become accepted methods used in the initial stages of valuation research. Whether focus groups and individual interviews reveal similar valuation information has not been thoroughly studied. The research tests the hypothesis that focus groups yield the same ecosystem service information as do individual interviews. The research also explores how the focus group and individual interview data might differ. The analysis shows that focus groups and individual interviews are not substitutes. They yield different information about ecosystem services and resource uses. © 2001 Elsevier Science B.V. All rights reserved.
Keywords:Nonmarket valuation; Qualitative methods; Mangroves; Total economic value
www.elsevier.com/locate/ecolecon
1. Do focus groups and individual interviews reveal the same information for natural resource valuation?
Focus groups and individual interviews have become accepted methods used in the initial stages of valuation research (e.g. Arrow et al., 1993; Boyle et al., 1994; Carson et al., 1994; Chilton and Hutchinson, 1999b). Qualitative methods may reveal the language and concepts that potential respondents use to discuss and
con-ceptualize resource and environmental issues (e.g. Carson et al., 1994; Hutchinson et al., 1995; Chilton et al., 1998; Chilton and Hutchinson, 1999a). These lay terms and concepts may be incorporated into draft resource valuation ques-tionnaires. Qualitative methods find further ser-vice in assessing the performance of these draft questionnaires (Mitchell and Carson, 1989; John-ston et al., 1995).
Existing valuation research makes little distinc-tion between the data produced by focus groups and individual qualitative interviews (also referred to as in-depth and individual interviews). The assumption seems to be that focus groups and individual interviews provide the same
informa-* Corresponding author. Tel.: +1-517-3550101; fax: + 1-517-3538994.
E-mail address:[email protected] (M.D. Kaplowitz).
M.D.Kaplowitz,J.P.Hoehn/Ecological Economics36 (2001) 237 – 247 238
tion on natural resource activities, concepts, and values; that qualitative individual interview meth-ods may be interchangeable with focus group methods (Johnston et al., 1995). However, the two methods are quite different in their structure.
Focus groups are group discussions designed to learn about subjects’ perceptions on a defined area of interest. They involve as many as 12 participants and are conducted by a skilled mod-erator using a discussion guide. Focus groups rely on the dynamics of group interaction to reveal participants’ similarities and differences of opin-ion (Krueger, 1994; Morgan, 1996, 1997). In con-trast, in-depth interviews are guided, one-on-one sessions. The researcher uses the same interview guide for each session and makes comparisons of the interview data to determine similarities and differences (Weiss, 1994).
Focus groups generate data subject to group effects, both positive and negative. Group interac-tion may facilitate an exchange of ideas and infor-mation thereby stimulating individual group members thinking and allowing group members to build on each others ideas. However, members of groups may fail to exchange all information they have and groups may focus only on shared information (Levine and Moreland, 1995). Fur-thermore, problems of dominant group members, peer pressure and other group dynamics may be responsible for incomplete or biased information processing (Janis, 1982; Morgan, 1997). Individ-ual in-depth interviews generate data in one-on-one settings similar to the settings of typical face-to-face survey questionnaires. Both focus groups and individual qualitative interviews may allow researchers to gain access to, and under-stand people’s activities and perceptions that can-not be directly observed. Both methods, to varying degrees, may facilitate learning from a broad range of informants about their perceptions and may be helpful identifying variables, issues, and hypotheses for quantitative research. How-ever, only individual qualitative interviews can be used to undertake such investigations independent
of group effects (positive and negative)
(Minichiello et al., 1995).
This paper reports the findings of a statistical analysis of focus group and individual interview
data collected in preparation for a valuation study of a mangrove ecosystem. First, the paper de-scribes the research hypotheses, design, and method used to collect focus group and individual interview information. Next, the paper discusses the procedures used to analyze the qualitative data, including the framing of a statistical test of the hypothesis that focus groups and individual interviews yield a similar range of data about a shared mangrove ecosystem. Results of the analy-sis are then reported and their implications discussed.
2. Hypotheses
Previous theory and results provide mixed guid-ance regarding the differences between focus group and individual interview data. Morgan (1997) posits that focus group data benefit from group dynamics and interaction. Morgan suggests that focus groups may have an advantage over individual interviews for topics that may not be thought out in detail by individual respondents due to accustomed patterns of thought. However, Janis (1982) and Levine and Moreland (1995) warn that the range of topics raised in focus groups may be limited to ideas and information that are shared by the group. That is, topics raised in focus groups may reflect ‘groupthink’ (Janis, 1982; Levine and Moreland, 1995). In con-trast, Agar and MacDonald (1995) assert that individual qualitative interviews tend to reveal more detailed information than focus groups. Agar and MacDonald (1995) posit that individual interviews may place informants in a one-on-one position that, in contrast to focus groups, forces them to explain themselves. This, according to Agar and MacDonald, may result in the sharing of elaborate and sometimes intimate information. Whether focus groups and individual interviews produce similar data has not been systematically researched (Morgan, 1997).
signifi-cantly more ideas than an equivalent number of individual interviews. An empirical examination of focus group and individual interview results in a technical text evaluation exercise found that focus group participants seemed to raise general problems and that individual interview partici-pants seemed to raise detail-oriented problems (De Jong and Schellens, 1998). Wight (1994) re-ported differences in the use of stereotypic vocab-ulary in focus groups and individual interviews. Wight observed the same men to use gender-sensi-tive terms in individual interviews and sexist/ ma-cho in focus groups when referring to women. Gray and Denstein (1998) empirically analyzed data gathered in in-depth interviews but offered no generalizations about the method’s relative strengths.
Understanding how focus group and individual interview data might differ may help resource economists choose the appropriate qualitative method or combination of methods for use in conjunction with natural resource valuation. The research was designed to learn about the range of services that the communities’ associate with the shared wetland ecosystem. The research explored the general hypothesis that focus groups and indi-vidual qualitative interviews differ in the extent and type of information revealed concerning wet-land ecosystem services and values. This research does not characterize the relative quality of the focus group and individual interview data.
Focus groups and individual interviews are hy-pothesized to reveal different types of information concerning consumptive and non-consumptive values associated with a mangrove ecosystem. If focus groups and individual interviews concerning respondents’ uses and perceptions of local man-grove ecosystem services yield dissimilar sets of information on the range of ecosystem services, then, all else being equal, we expect that tran-scripts of those sessions would evidence dissimilar frequencies of ecosystem service information. The empirical analysis tests whether the frequencies of statements regarding the consumptive and non-consumptive values of mangrove ecosystems differ across focus group and individual interviewer data.
3. Research design
The qualitative research reported here was the initial stage of a nonmarket valuation study of mangrove ecosystems in Mexico’s Yucata´n Penin-sula. The research included both focus groups and individual interviews. The qualitative research centered on two villages, Chele´m and Chuburna´, near the city of Progresso. These are located along a 15-km stretch of coastal fringe that borders the Gulf of Mexico on one side and Chele´m Lagoon on the other. The two villages are comprised of families that have traditionally relied upon shared natural resources of the region, including the mangrove wetland, for their subsistence and liveli-hood. Chele´m and Chuburna´ share similar socio-economic characteristics and have roughly 475 and 215 households, respectively (Instituto Na-cional de Estadı´stica Geografı´a e Informa´tica
(IN-EGI), 1992). Focus group interviews and
individual in-depth interviews were conducted with residents of these communities as part of the design phase for a nonmarket valuation effort supported by the Inter-American Foundation (IAF), the Organization of American States (OAS), and the Centro de Investigacio´n y
Estu-dios Avanzados del IPN, Unidad Me´rida
(CINVESTAV).
inter-M.D.Kaplowitz,J.P.Hoehn/Ecological Economics36 (2001) 237 – 247 240
views were conducted in the two communities, with slightly more men participating then women. A total of 97 year-round residents from the two communities were interviewed in one of 12 focus groups or 19 individual in-depth interviews.
The focus groups and individual interviews were designed and implemented following the generally accepted practices of Weiss (1994) and Morgan (1996, 1997), Morgan et al. (1998), re-spectively. A Mexican professional moderator used the same specially prepared discussion guide to conduct the focus groups and individual inter-views. Figure 1 illustrates a sample discussion guide. The discussion guide was designed to have the moderator promote discussion of ecosystem
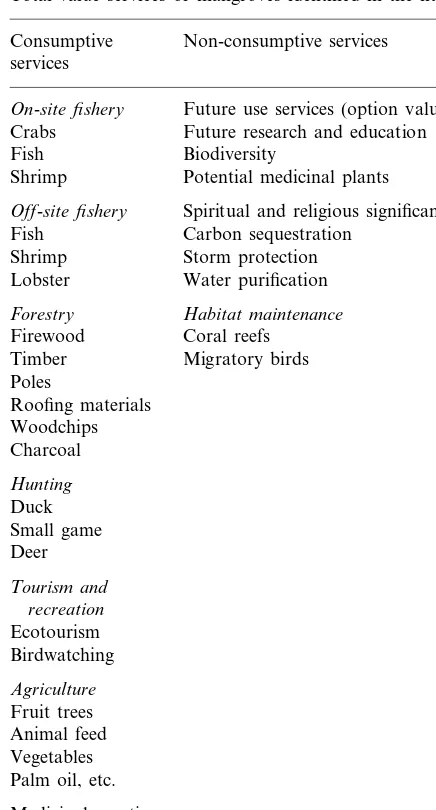
services relevant to local beneficiaries and was based on the literature of mangrove ecosystem services (e.g. Costanza et al., 1989; Hamilton et al., 1989; Hirsch and Mauser, 1992; Ruitenbeek, 1992; Bennet and Reynolds, 1993; Barbier, 1994; Bann, 1997; Barbier et al., 1997; Carson, 1998). Table 1 illustrates the wide range of consumptive and non-consumptive values that have been asso-ciated with mangrove ecosystems. The moderator was instructed to encourage discussion of the widest possible range of values associated with the Chele´m Lagoon ecosystem and to explore each service raised by participants with follow-up ques-tions and nondirective prompts. The focus groups
were conducted in centrally-located meeting
Table 1
Total value services of mangroves identified in the literaturea
Consumptive Non-consumptive services services
Future use services (option value)
On-site fishery
Crabs Future research and education Biodiversity
Fish
Potential medicinal plants Shrimp
Spiritual and religious significance
Off-site fishery
Carbon sequestration
aSources include: Costanza et al. (1989), Aylward and
Barbier (1992), Ruitenbeek (1992), Bennet and Reynolds (1993), Barbier (1994), Farber (1996), Janssen and Padilla (1996), Bann (1997), Barbier et al. (1997).
number of lines of the individual interview tran-scripts (6933).
4. Analysis
Focus group and individual interview transcript data were sorted and coded as 14 variables in order to quantitatively test the hypothesis that the quantity of focus group information on the range of ecosystem services is substantially similar to individual interview information. One variable, interview type, records the type of interview (e.g. focus group or individual interview) associated with each transcript. The other 13 variables cap-ture those wetland ecosystem services raised by respondents during the focus groups and individ-ual interviews. Such a content analytical approach to qualitative data analysis is generally accepted (Krippendorff, 1980; Weber, 1990) and has been used as an adjunct to contingent valuation re-search (Chilton and Hutchinson, 1999a; Lunt, 1999).
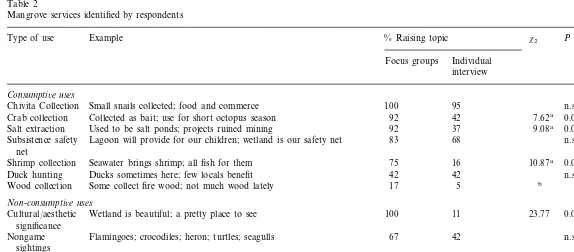
Table 2 lists the 13 ecosystem service variables derived from the coding process. Table 2 also presents some representative references as well as the relative frequencies that the sessions raised each topic and chi-squared tests. As can be seen, most of the ecosystem services discussed by par-ticipants are consumptive use services (e.g. crab, shrimp, and wood collection). Some of the ser-vices discussed are non-consumptive uses (e.g. recreation, storm protection). As well, partici-pants raised for discussion a subset of non-con-sumptive services sometimes referred to as passive use services (e.g. cultural and aesthetic signifi-cance, nongame habitat).
In terms of the relative ranking, it can been seen, for example, that cultural and aesthetic sig-nificance (e.g. wetland beauty) was raised during every focus group discussion, but that it was only the ninth most frequent service topic raised during individual interviews. While a similar range of ecosystem services was discussed by the focus groups and the individual interviews in aggregate, not every individual interview or focus group raised the entire range of mangrove services. places and lasted for roughly one hour. The
indi-vidual interviews were conducted at respondents’ homes and typically lasted 30 minutes. All focus
group and individual interviews were
M
.
D
.
Kaplowitz
,
J
.
P
.
Hoehn
/
Ecological
Economics
36
(2001)
237
–
247
242
Table 2
Mangrove services identified by respondents
P Odds ratio
Type of use Example % Raising topic x2
Individual Focus groups
interview
Consumpti6e uses
n.s. Chivita Collection Small snails collected; food and commerce 100 95
15.1
92 42 7.62a 0.006
Crab collection Collected as bait; use for short octopus season
Used to be salt ponds; projects ruined mining 92 37
Salt extraction 9.08a 0.003 18.9
Subsistence safety Lagoon will provide for our children; wetland is our safety net 83 68 n.s. net
Seawater brings shrimp; all fish for them 75 16 0.001 16.0
Shrimp collection 10.87a
Duck hunting Ducks sometimes here; few locals benefit 42 42 n.s.
Wood collection Some collect fire wood; not much wood lately 17 5 b
Non-consumpti6e uses
Wetland is beautiful; a pretty place to see 100 23.77 0.001 9.5
Cultural/aesthetic 11
significance
n.s. 42
67 Flamingoes; crocodiles; heron; turtles; seagulls
Nongame sightings
21 n.s.
Tourism People come here to see flamingoes; tourists from Me´rida visit for the 58 day
n.s. Recreation Take guests for boat trip; sometimes picnic there; celebrate Mass there 42 32
Storm protection Can protect boats from storm; helps if water rises 42 16 b
ad.f.=1,N=31.
Cross-tabulation analysis of each ecosystem ser-vice variable with the interview type variable was undertaken to test the null hypothesis that, in the sample population, the same percentage of focus groups and individual interviews raised each wet-land service for discussion. Table 2 shows the Pearson chi-square test of the distribution of ob-served instances that focus groups and individual interviews raised each ecosystem service topic against the null hypothesis that each interview type results in the same frequency of the topic being raised. The null hypothesis was rejected for
five variables — crab collection (P=0.006),
shrimp fishing (P=0.001), salt extraction (P=
0.003), tourism (P=0.035) and cultural and aes-thetic significance (P=0.001). To examine the strength of the association of interview type with respondents’ raising the particular ecosystem ser-vice in discussion, odds ratios were computed. As Table 2 shows, it is about nine times more likely that a focus group of local resource beneficiaries raises the topic of the mangrove ecosystem’s cul-tural and aesthetic significance than an individual interview. The topics of salt extraction, shrimp fishing, crab collection, and tourism are respec-tively 19, 16, 15 and five times more likely to be raised in focus groups than raised by individuals during one-on-one interviews.
To further appreciate the significant differences observed in the frequencies of discussion of ecosystem services by focus group and individual interview data, it should be remembered that four times as many people participated in focus groups (78) than in individual interviews (19). All else being equal, if there are differences in focus group and individual interview data that are a linear function of number of people, the expected odds ratios should be closer to 4. Furthermore, those discussion topics that do differ appear with ob-served odds ratios two to four times that sug-gested by a linear relationship with the number of participants. This suggests that more than the larger numbers of participants in focus groups are responsible for the increased frequency that cer-tain topics were raised by focus groups.
Five of the nine most frequently mentioned topics in focus groups differed significantly in the frequency in which individual interviews raised
them in discussions. Therefore, the research find-ings support the rejection of the null hypothesis. The data show that focus groups and individual interviews revealed significantly different ecosys-tem service information.
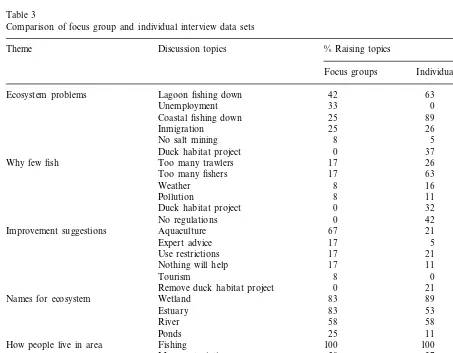
To further explore how the focus group and individual interview data on the wetland ecosys-tem might differ, the hypothesis that focus groups reveal the same type of information as do individ-ual interviews was examined. To do this, the focus group and individual interview data were re-coded using a ‘grounded theory’ approach and placed into thematic groups (Strauss and Corbin, 1990; Chilton and Hutchinson, 1999b,a; Lunt, 1999). These thematic groups (ecosystem problems, why few fish, names for ecosystem, improvement sug-gestions, how people live in area, and perception of ecosystem) represent the primary subject mat-ter of the respondents’ responses and discussion topics during the focus groups and individual interviews. The qualitative data were further sorted into several discussion topic variables un-der each thematic category. Each of the thematic categories had between four and six topic re-sponse variables. Such thematic-coding, attaching specific codes to text-bits with a more or less clear relevance for a certain theme, is a generally ac-cepted qualitative analytical approach in sociol-ogy and other fields (Strauss and Corbin, 1990; Sivesind, 1999).
M.D.Kaplowitz,J.P.Hoehn/Ecological Economics36 (2001) 237 – 247 244
Inspection of the relative frequencies in Table 3 does shed additional light on differences in the information revealed by focus groups and individ-ual interviews. The frequency that participants discussed particular topics during the focus groups and individual interviews differ. For exam-ple, among the problems confronting the ecosys-tem that participants discussed, more individual interviews raised the problems of decreasing fish populations in the coastal and in the lagoon fisheries than did participants in the focus groups. Conversely, more of the focus groups interviews generated suggestions such as aquaculture, bring-ing in outside experts, and increasbring-ing tourism as means for improving the ecosystem than did the
individual interviews. Not only do the amounts of information on similar topics appear to differ between the two methods, but, as Table 3 illus-trates, the range of topics also differs between the two methods.
Three themes (ecosystem problems, why few fish, and improvement suggestions) contain two discussion topics that were not raised at all by one of the methods. For example, none of the individ-ual interviews raised the general level of unem-ployment as an ecosystem problem nor did they raise tourism as a possible means for improving their ecosystem health. Likewise, none of the fo-cus groups mentioned the Ducks Unlimited of Mexico, America and Canada (DUMAC) duck
Table 3
Comparison of focus group and individual interview data sets
Theme Discussion topics % Raising topics
Focus groups Individual interview
Ecosystem problems Lagoon fishing down 42 63
0
Unemployment 33
89 Coastal fishing down 25
26 25
Inmigration
5
No salt mining 8
Duck habitat project 0 37
26 17
Why few fish Too many trawlers
Too many fishers 17 63
16
Weather 8
Pollution 8 11
Duck habitat project 0 32
No regulations 0 42
21 67
Improvement suggestions Aquaculture
Expert advice 17 5
Use restrictions 17 21
Nothing will help 17 11
8 0
Tourism
Remove duck habitat project 0 21
Wetland
Names for ecosystem 83 89
Estuary 83 53
River 58 58
Ponds 25 11
How people live in area Fishing 100 100
37
Masonry/painting 58
Factory work in Me´rida 33 11
Seasonal work 17 53
Beautiful
Perception of ecosystem 100 11
Source of subsistence 83 74
Connection to sea 58 21
habitat restoration project. A project that, based on the individual interviews and subsequent inves-tigation, seems to be highly controversial. The individual interviews did raise the DUMAC pro-ject as an ecosystem problem, a reason for there being so few fish, and an impediment to ecosys-tem improvement. This finding was particularly interesting and was amenable to a Pearson chi-squared test. It turns out that the observed differ-ence in the frequency that focus groups and individual interviews raised the DUMAC project was statistically significant (x2=9.079, df=1, PB0.01). Further illustrating differences in the
information revealed by the two methods, the range of reasons suggested for the declining fish populations differed between the two methods. The focus groups raised only four of the six reasons proffered by individual interviews for the decreasing fish populations in the region.
These results demonstrate that the focus groups and individual interviews did not reveal the same quantity or type of natural resource valuation information. Not only do the two methods result in different frequencies of ecosystem service data, they generate different sets of information con-cerning the reasons local beneficiaries attribute to their current ecosystem problems and the possible means for improvement.
5. Conclusion
The analysis shows that focus groups and indi-vidual interviews are not substitutes. The informa-tion from each method was complementary, with each yielding somewhat different perspectives on the range of resource services, values, and issues. The observation that the focus groups did not reveal the controversial DUMAC project should be placed in the proper context. Focus groups conducted by specially trained moderators with appropriate discussion guides (scripts) are often used to explore controversial topics. However, the reported results do demonstrate that, all else equal, individuals may feel more comfortable vol-unteering controversial information unknown to researchers during individual interview sessions rather than sharing that information in a focus
group setting among people from their locale. The group dynamics of focus groups may tend to encourage speculation about information. It may be that once groups have identified the obvious, routine activities that the group dynamics lead to consideration of ‘what else.’ In the case of con-sumptive and non-concon-sumptive use information, the data suggest that the focus groups revealed significantly more information about intermittent consumptive use activities (e.g. crab collection, salt extraction, shrimp collection) than did the individual interviews. The significant difference in the frequency that the focus groups discussed the ecosystem’s beauty support this notion in that the focus groups seem to have easily identified an obvious, routine non-consumptive use.
The key message of this research is not that one method is better than the other. It is that these two approaches to learning from resource benefi-ciaries about how they perceive, use, and value natural resources are complementary. As a result, nonmarket valuation research should be cautious relying upon information generated solely by one of them: (i) to support assertions that a particular survey instrument adequately addresses relevant passive use values, or (ii) to interpret valuation study results to include respondents’ passive use values. Not only do the two qualitative methods provide different types of ecosystem information, reliance on one or the other may provide valua-tion practivalua-tioners with different impressions of the range or relative importance of ecosystem ser-vices. It appears that one-on-one qualitative inter-views may reveal important insights absent group effects that are complimentary to focus group research. As a result, valuation researchers should typically use both.
Acknowledgements
M.D.Kaplowitz,J.P.Hoehn/Ecological Economics36 (2001) 237 – 247 246
the anonymous reviewers for their probing ques-tions, demanding observaques-tions, and thoughtful contributions.
References
Agar, M.H., MacDonald, J., 1995. Focus groups and ethnog-raphy. Hum. Organ. 54, 78 – 86.
Arrow, K., Solow, R., Learner, E., Portney, P., Rader, R., Schuman, H., 1993. Report of the NOAA panel on contin-gent valuation. Federal Register 58, 4601 – 4614.
Aylward, B., Barbier, E.B., 1992. Valuing environmental func-tions in developing countries. Biodiversity Conservation 1, 34 – 50.
Bann, C., 1997. An economic analysis of alternative mangrove management strategies in Koh Kong Province, Cambodia, Economy and Environment Program for South East Asia, Singapore.
Barbier, E.B., 1994. Valuing environmental functions: tropical wetlands. Land Econ. 70, 155 – 173.
Barbier, E.B., Acreman, M., Knowler, D., 1997. Economic valuation of wetlands: a guide for policy makers and planners, Ramsar Convention Bureau, Department of En-vironmental Economics and Management, University of York, Cambridge, UK.
Bennet, E.L., Reynolds, C.J., 1993. The value of a mangrove area in Sarawak. Biodiversity Conservation 2, 359 – 375. Boyle, K.J., Desvousges, W.H., Johnson, F.R., Dunford, R.,
Hudson, S.P., 1994. An investigation of part – whole biases in contingent valuation studies. J. Environ. Econ. Manag. 27, 64 – 83.
Carson, R.T., 1998. Valuation of tropical rainforests: philo-sophical and practical issues in the use of contingent valuation. Ecol. Econ. 24, 15 – 29.
Carson, R.T., Hanemann, W.M., Kopp, R.J., Krosnick, A., Mitchell, R.C., Presser, S., Ruud, P.A., Smith, V.K., 1994. Prospective interim lost use value due to DDT and PC13 contamination in the southern California Bight, Natural Resource Damage Assessment, Inc., La Jolla, CA. Chilton, S.M., Hutchinson, W.G., 1999a. Do focus groups
contribute anything to the contingent valuation process? J. Econ. Psychol. 20, 465 – 483.
Chilton, S.M., Hutchinson, W.G., 1999b. Exploring diver-gence between respondent and researcher definitions of the goods in contingent valuation studies. J. Agric. Econ. 50, 116.
Chilton, S., Burton, T., Jones, M., Loomes, G., 1998. A qualitative examination of preference reversals. The 1st World Congress of Environmental and Resource Economists, Venice, Italy.
Costanza, R., Farber, S.C., Maxwell, J., 1989. Valuation and management of wetland ecosystems. Ecol. Econ. 1, 335 – 361.
De Jong, M., Schellens, P.J., 1998. Focus groups or individual interview? A comparison of text evaluation approaches. Tech. Commun. 45, 77 – 88.
Farber, S., 1996. Welfare loss of wetlands disintegration: a Louisiana study. Contemp. Econ. Policy 14, 92 – 106. Fern, E.F., 1982. The use of focus groups for idea generation:
the effects of group size, acquaintanceship, and moderator on response quantity and quality. J. Marketing Res. 19, 1 – 13.
Gray, J.H., Denstein, I.L., 1998. Integrating quantitative and qualitative analysis using latent and manifest variables. Qual. Quantity 32, 419 – 431.
Hamilton, L., Dixon, J., Owen Miller, G., 1989. Mangroves forests: an undervalued resource of the land and sea. In: Borgese, E.M., Ginsburg, N., Morgan, J.R. (Eds.), Ocean Yearbook, vol. 8. University of Chicago Press, Chicago, IL.
Hirsch, D., Mauser, A., 1992. The economic values of man-groves: two case studies — Mida Creek and Funzi Bay, University of Amsterdam, Amsterdam.
Hutchinson, W.G., Chilton, S.M., Davis, J., 1995. Measuring non-use value of environmental goods using the contingent valuation method: problems of information and cognition and the application of cognitive questionnaire design meth-ods. J. Agric. Econ. 46, 97 – 112.
Instituto Nacional de Estadı´stica Geografı´a e Informa´tica (INEGI), 1992. Yucata´n-resultados definitivos: datos por AGEB urbana. XI censo general de poblacion vivienad, 1990. Instituto Nacional de Estadı´stica, Geografı´a e Infor-ma´tica, Aguascalientes, Mexico.
Janis, I.L., 1982. Groupthink. Houghton Mifflin, Boston, MA. Janssen, R., Padilla, J.E., 1996. Valuation and Evaluation of Management Alternatives for the Pagbilao Mangrove Forest, vol. 9. Institute for Environmental Studies, Amsterdam.
Johnston, R.J., Weaver, T.F., Smith, L.A., Swallow, S.K., 1995. Contingent valuation focus groups: Insights from ethnographic interview techniques. Agric. Resource Econ. Rev. 24, 56 – 69.
Krippendorff, K., 1980. Content Analysis: An Introduction to its Methodology. CommText Series, vol. 5. Sage Publica-tions, Beverly Hills, CA.
Krueger, R.A., 1994. Focus Groups: A Practical Guide for Applied Research. Sage Publications, Thousand Oaks, CA. Levine, J.M., Moreland, R.L., 1995. Group processes. In: Tesser, A. (Ed.), Advanced Social Psychology. McGraw-Hill, New York.
Lunt, P., 1999. Comments on Chilton and Hutchinson: be-yond measurement issues in the focus group method. J. Econ. Psychol. 20, 491 – 494.
Minichiello, V., Aroni, R., Timewell, E., Alexander, L., 1995. In-depth Interviewing: Principles, Techniques, Analysis. Longman, South Melbourne.
Mitchell, R.C., Carson, R.T., 1989. Using surveys to value public goods: the contingent valuation method. Resources for the Future, Washington, DC.
Morgan, D.L., 1997. Focus Groups as Qualitative Research. Sage Publications, Thousand Oaks, CA.
Morgan, D.L., Krueger, R.A., Scannell, A.U., King, J.A., 1998. Focus Group Kit. Sage Publications, Thousand Oaks, CA.
Ruitenbeek, H.J., 1992. Mangrove management: an economic analysis of management options with a focus on Bintuni Bay, Irian Jaya, vol. 8, Environmental Management Devel-opment in Indonesia Project (EMDI) and Dalhousie Uni-versity, Jakarta and Halifax.
Sivesind, K.H., 1999. Structured, qualitative comparison. Qual. Quantity 33, 361 – 380.
Strauss, A., Corbin, J., 1990. Basic of Qualitative Research: Grounded Theory Procedures and Techniques. Sage Publi-cations, Newbury Park, CA.
Weber, R.P., 1990. Basic content analysis. In: Lewis-Beck, M.S. (Ed.), Quantitaitve Applications in the Social Sci-ences. Sage Publications, Newbury Park, CA.
Weiss, R.S., 1994. Learning from Strangers: the Art and Method of Qualitative Interview Studies. The Free Press, New York.
Wight, D., 1994. Boys’ thoughts and talk about sex in a working class locality of Glasgow. Sociol. Rev. 42, 702 – 737.