AN ALYSIS
D iet and the distribution of environmental impact
Thomas White *
Department of Economics and Global S tudies,A ssumption College,W orcester,M A 01615, US A R eceived 27 July 1999; received in revised form 22 F ebruary 2000; accepted 3 M arch 2000
Abstract
This paper examines the relationship between scale and distribution issues. It is argued that since achieving a sustainable scale requires economic activity to stay within biophysical limits, considerations of equity should not be limited to the distribution of monetary measures such as income, but should include the distribution of scarce environmental services as well. In order to make this point this paper examines how differences in diet across populations lead to inequality in the distribution of environmental impact. F irst, the distribution of food consumption across the world’s population is examined using national data. N ext, ecological footprints are estimated in order to ascertain how differences in diet affect the distribution of environmental impact. The results show that the meat-intensive diet enjoyed by many in the industrialized world leads to a greater degree of inequality in the use of environmental services than is apparent from examination of the distribution of food consumption across countries. © 2000 Elsevier Science B.V. All rights reserved.
Keywords:Scale; D istribution; Equity; Ecological footprint
www.elsevier.com/locate/ecolecon
1. Introduction
D aly (1991, 1996) has argued that scale, distri-bution, and efficiency are the three issues that
ecological economics must address. While
neoclassical economists have long studied the problems of distribution and efficiency, it is scale
that distinguishes the ecological economics
paradigm from that of neoclassical economics. Ecological economists argue that achieving a
sus-tainable scale should be the primary policy goal instead of the pursuit of growth that is favored by neoclassical economists (D aly, 1996). H owever, since achieving a sustainable scale necessarily re-quires the human economy to stay within bio-physical limits, scale has important implications for distribution issues (Luks and Stewen, 1999). U nlike income, which can theoretically grow without bound, an economy facing biophysical limits must address how scarce environmental ser-vices are distributed in use. While the degree of equity in the distribution of income will continue to be an important issue, the distribution of
bio-* Tel.: +1-508-7677558; fax:+1-508-767-7382. E-mail address:[email protected] (T. White)
physical measures such as the ecological footprint will become increasingly important in the future. The significance of scale for distribution issues depends on the decision criterion being employed. U tilitarian and R awlsian social welfare functions have often been used as decision criteria for distri-bution questions (Atkinson and Stiglitz, 1980). R egardless of whether an economy is pursuing growth or sustainability, under a utilitarian deci-sion rule goods should be distributed to those who receive the greatest satisfaction from consumption of those goods. D istribution according to revealed willingness to pay is therefore consistent with a utilitarian perspective. On the other hand, a R awl-sian decision criteria which focuses on the position of the individual with the lowest utility leads to different results under the different policy goals. A growth policy is consistent with a R awlsian view-point only if the growth leads to an increase in the utility of the least well-off individual. This is the rising-tide-lifts-all-boats scenario. In contrast, a policy aimed at maintaining a sustainable scale could meet a R awlsian criterion of improving the position of the least well-off individual only through redistribution efforts. This paper employs a R awlsian perspective to examine how food con-sumption patterns affect the distribution of the use of scarce environmental services in agriculture.
Over the last 30 years there has been an increase in food production worldwide. This resulted from an increase in the amount of land under cultiva-tion and from improved yields on existing agricul-tural lands (F AO, 1996a). U nfortunately, evidence is mounting that food production may be ap-proaching limits. Brown and K ane (1994) report that growth in per capita grain production has leveled off since the mid-1980s as efforts to in-crease yields begin to exhibit decreasing returns. H arris and K ennedy (1999) examined yield growth patterns and argue that the world is already near carrying capacity in agriculture. Overfishing of the world’s oceans has created a situation where fish catch is likely to decline over the next several decades (M cG inn, 1998). Overgrazing of range-lands has left them degraded and unable to main-tain current livestock levels (D urning and Brough, 1991). There also appears to be limited potential for increasing the amount of land under
cultiva-tion (G oodland, 1997). In a world where popula-tion is growing by more than 90 million annually (WR I, 1994) and as much as 20% of the popula-tion is still classified as undernourished (F AO, 1996b), the ability of agriculture to provide an increasing amount of food appears to be diminish-ing.
In a recent article G oodland (1997) argues that diet is an important factor in achieving sustain-ability in agriculture. G oodland points out that the predominantly meat-based diet consumed by the more affluent citizens of the world requires a significantly greater amount of environmental re-sources per calorie than a more grain-based diet. An increased demand for meat has encouraged farmers to raise livestock instead of grain (U N EP, 1999), and currently almost 40% of the world’s grain currently goes to feeding livestock and is therefore unavailable for human consumption (Brown and K ane, 1994). Policies designed to discourage meat consumption through taxation or other incentives could improve health and food availability (G oodland, 1997). In addition, reduc-ing the amount of meat consumed by the affluent could lead to more equity in the distributions of
both food consumption and environmental
impact.
This paper will explore how differences in diet affect the distribution of environmental impact. In the next section, the implications which sustain-ability has toward the issue of equity will be developed using a simple conceptual model. R e-cent trends in food availability will then be exam-ined with particular attention paid to how the consumption of food calories is distributed across the world’s population. F ollowing this, ecological footprint analysis will be used to estimate how the distribution of environmental impact across the world is affected by differences in diet. The analy-sis reveals that there is potential for reducing inequality in the distribution of environmental impact through alteration of diet.
2. Model
Ii=Pi·
whereIiis the degree of environmental impact of
nation i,Pirepresents population of nation i and
Ciis the caloric intake of nation i. Eq. (1) simply
states that total environmental impact from food consumption depends on population, calories per capita, and the ratio of environmental impact per calorie consumed. Since different foods generate different levels of environmental impact the ratio
(I/C) will be referred to as the diet impact ratio.1
Achieving worldwide sustainability in
agriculture will require the total amount of
environmental impact (I=SIi) be stabilized at or
below some maximum sustainable scale, S*.
Setting P=SPi and C=SCi, the following
relationship must therefore be true for
sustainability:
I=P·
CP
·I
C
5S * (2)Ascertaining whether current agriculture has
reached the maximum sustainable scale S* is
beyond the scope of this paper, although previously cited evidence suggests that this may in fact be the case. H owever, assuming that limits to agricultural production are eventually faced, Eq. (2) becomes an equality and several important equity issues arise. F irst, for any given population, a R awlsian goal of increasing the calories available to the least well-off groups could be achieved through a redistribution
of calories from high-calorie to low-calorie
consumers. Alternatively, a reduction in the diet impact ratio could allow for additional calorie consumption on the part of the least well-off groups without a reduction in calories consumed by the rest of the population as the shift to a more grain-intensive diet would free up agricultural capacity.
In addition to equity in the distribution of available calories, achieving a sustainable scale may
require a second equity issue to be addressed: equity in the distribution of environmental impact. The existence of a maximum sustainable scale highlights
the scarcity of environmental services, and
therefore the degree to which those scarce services are shared is important from an equity standpoint. Of course, in the case of food consumption, the
distribution of calories will influence the
distribution of environmental impact, reinforcing the importance of equity in calorie distribution. In addition, differences in the diet impact ratios will lead to disparity in environmental impact per person, which suggests that the choice of diet is itself an equity issue.
3. Equity and food availability
R ecent evidence indicates that world food secu-rity has improved over the past several decades. Since the 1960s world food production has grown more rapidly than population (F AO, 1996c). R e-gional data presented in Table 1 show that total calories consumed per capita has in general in-creased during the period from 1985 to 1995, F AO
(1997).2
The regions with the lowest levels, Africa and Asia, experienced 5 and 6% increases in per capita consumption, respectively, while N orth America, already with high food availability, in-creased by over 8%. Only Europe experienced a significant drop in food availability. This is a result of the decrease in food production of the former centrally planned economies of Central and East-ern Europe (F AO, 1996b). While the overall trend in food availability has been encouraging, there are still an estimated 840 million people who are considered undernourished (F AO, 1996b), and al-though most reside in low-income countries there are also significant numbers of undernourished in more developed and industrialized countries.
2Calorie consumption data was obtained from the F ood
and Agriculture Organization of the U nited N ations, F AOSTAT Statistics D atabase, (http://www.fao.org). F igures are net of trade and therefore represent an estimate of average calorie consumption. R eported per capita figures are actually 3-year averages with 1985 and 1995 representing the averages of 1984 – 86 and 1994 – 96, respectively.
1Eq. (1) is a modified version of the well-known ‘impact’ or
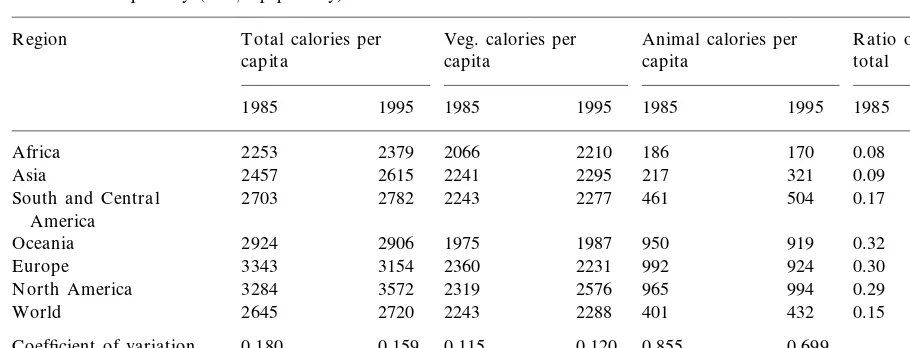
Table 1
Calorie intake per day (kcal/cap per day)a
Animal calories per Total calories per Veg. calories per
R egion R atio of animal to
capita
capita capita total
1995
1995 1985 1995 1985
1985 1995 1985
2210 186 170 0.08
Africa 2253 2379 2066 0.07
0.12 0.09
321 217
Asia 2457 2615 2241 2295
2277 461 504
South and Central 2703 2782 2243 0.17 0.18
America
950 919 0.32
Oceania 2924 2906 1975 1987 0.32
924 0.29
992 0.30
Europe 3343 3154 2360 2231
994 0.29 0.28
N orth America 3284 3572 2319 2576 965
0.16 0.15
432 2288
World 2645 2720 2243 401
0.699 Coefficient of variation 0.180 0.159 0.115 0.120 0.855
0.377 G ini coefficient 0.101 0.088 0.063 0.063 0.436
0.041 0.352 0.271 H oover index 0.073 0.062 0.046
aSource for calorie data: U nited N ations F ood and Agriculture Organization, F AOSTAT Statistics D atabase (http://
www.fao.org).
Table 1 also shows the breakdown of available calories into the two food categories of vegetable products and animal products which allows for differences in diet to be considered. F or example, by 1995 the available calories per capita from vegetable sources was spread fairly evenly across regions, with only Oceania falling much below the world average. On the other hand, calories derived from animal products was much more unevenly distributed, with Europe, N orth Amer-ica, and Oceania consuming over five times the calories of Africa on a per capita basis, about three times that of Asia, and about twice that of South and Central America. Comparison with 1985 shows Asia, South and Central America and N orth America experienced substantial increases in the consumption of calories from animal sources, while the other regions all experienced reductions. On a worldwide basis, about two-thirds of the increase in total calories per capita that occurred between 1985 and 1995 is explained by the increase in calories from animal products, indicating diets in general have been becoming more meat-intensive. The final two columns in Table 1 show the fraction of total calories per capita derived from animal products. This is a simple measure of the degree to which a diet is dependent upon meat and other animal products.
On average, Oceania, Europe and N orth America have the most meat-intensive diets while Africa and Asia are the least meat-intensive although Asia has seen a fairly significant increase during the 1985 – 95 period.
Three statistical measures were estimated in order to quantify the degree of inequality that exists in the distribution of food calories and are
also reported in Table 1.3
The first measure re-ported is the coefficient of variation, which is the S.D . divided by the mean. The second measure, the gini coefficient is a measure that is commonly used in studies of income distribution. It repre-sents twice the area between a ‘Lorenz curve’ and an equality line, where the Lorenz curve is a plot of the cumulative proportion of population against cumulative proportion of income when the population is sorted in ascending order of incomes. When income is equally distributed across a population then the gini coefficient will be equal to zero, and when income is highly concentrated amongst a few the gini coefficient
3Calculation of the inequality measures were based upon
approaches one. While the current analysis uses calories rather than income, the calculation and interpretation of the gini coefficient are
un-changed.4
The final measure used to estimate the degree of inequality in the distribution of food is the H oover concentration index. The H oover in-dex measures the proportion of some variable that would need to be redistributed in order to achieve a completely equal distribution of that variable. It has been applied to the distribution of income across a population, the distribution of a
popula-tion across land area, and other cases.5
Like the gini coefficient, the H oover index is bounded by
zero (complete equality) and one (total
inequality).
Comparing the estimated measures of inequal-ity reveal several patterns. F irst, over the 10-year period from 1985 to 1995 total calories have become more evenly distributed amongst the world’s population, as indicated by the decrease in each of the three measures. Second, compari-son of the inequality measures of total calories with those of vegetable and animal calories shows that in general calories from vegetables are more evenly distributed than total calories, while ani-mal calories exhibit a greater degree of inequality than either total or vegetable calories. The magni-tude of the inequality in the consumption of calories from animal products is worth noting as each of the measures for animal calorie inequality is over four times the corresponding measures for total calorie inequality. The discrepancy in the inequality measures indicates that differences in diet affect the ultimate distribution of calories per
capita but do not reveal how differences in diet translate into differences in environmental impact. This will be addressed in the next section.
4. Equity and environmental impact
Livestock farming requires a greater amount of resources per unit of food than other types of agriculture. F or example, cattle must eat approxi-mately 7 kg of grain in order to generate a single kg of beef, and pigs require about 4 kg grain for 1 kg of pork. F owl such as chicken and turkey are more efficient, but still require approximately 2 kg of feed per kilogram of poultry meat. In addition, livestock farming can lead to overgrazing which causes soil erosion, desertification, and even tropi-cal deforestation as land is cleared to make way for cattle herds (Brown and K ane, 1994). There-fore, the meat-intensive diet of some of the world’s population leads to a disproportionate share of the environmental impact resulting from agriculture.
In order to examine the degree to which differ-ences in diet affect environmental impact ecologi-cal footprint analysis was utilized. Wackernagel and R ees (1994, 1996) have developed the ecolog-ical footprint concept and applied it to a variety of situations. Briefly defined, an ecological foot-print of a population is the amount of ecologically productive land that would be necessary to provide current levels of consumption on a sus-tainable basis. An ecological footprint is therefore a measure of environmental impact, with a larger estimated footprint implying greater land require-ments and therefore a greater impact on the envi-ronment by a population.
F or the current application national ecological footprints were estimated for food consumption. The methodology used to calculate the footprints followed that of Wackernagel and R ees (1996). A footprint of a population is estimated by dividing the level of consumption of some item by the average annual yield of producing that item. The resulting quotient is the land area necessary to produce the current consumption level. F or exam-ple, the footprint resulting from the consumption of wheat in the U nited States in 1995 was
calcu-4The gini coefficient (G) was calculated using the following
formula:G=1−Spi(Qi+Qi−1), wherepirepresents the
pro-portion of world population which resides in countryi, andQi
is the cumulative proportion of calories or footprint attributed to countries 1. . .i, when countries are ranked in ascending order. See Sundrum (1990) for a description of the characteris-tics of a gini coefficient.
5Calculation of the H oover concentration index (H) is
completed using the equation:H=0.5S(qi/q)−(pi/p), where
qi, represents calorie consumption of country i, pi is the
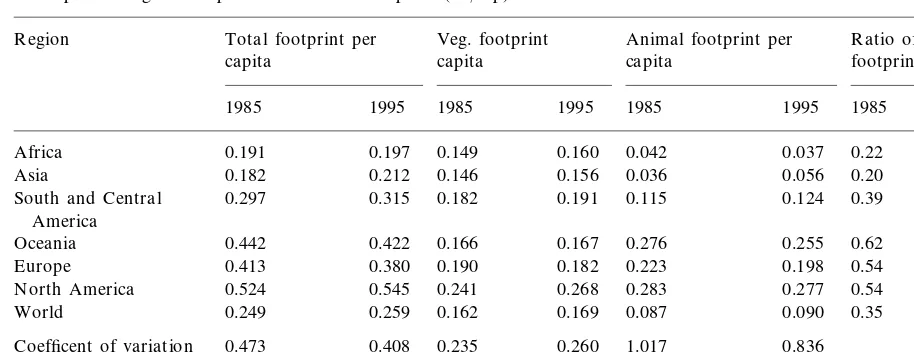
Table 2
Per capita ecological footprint for food consumption (ha/cap)
Animal footprint per
R egion Total footprint per Veg. footprint R atio of animal
capita footprint to total capita
capita
1985 1995 1985 1995 1985 1995 1985 1995
0.19 0.22
0.037 0.042
0.160
Africa 0.191 0.197 0.149
0.036 0.056 0.20 0.26
Asia 0.182 0.212 0.146 0.156
0.191 0.115 0.124 0.39
South and Central 0.297 0.315 0.182 0.39
America
0.167 0.276 0.255 0.62
Oceania 0.442 0.422 0.166 0.60
0.380 0.54 0.52
0.413 0.198
Europe 0.190 0.182 0.223
0.51
0.249 0.259 0.162 0.169
World 0.087 0.090 0.35 0.35
0.235 0.408
Coefficent of variation 0.473 0.260 1.017 0.836
0.208 0.246
G ini coefficient 0.129 0.142 0.505 0.431
0.092 0.156 0.198
H oover index 0.099 0.417 0.322
lated by dividing total U S wheat consumption of 23 233 720 metric tons by the estimated yield of
2.5 metric tons/ha.6 The result of 9 293 488 ha
represents the amount of the world’s cropland needed to meet the amount of wheat consumed in the U S in 1995. By comparison, in 1995 Chile consumed 1 679 155 metric tons of wheat, which translates into a footprint of 671 662 ha of land, much smaller than the U S estimate. Estimating per capita footprints allows for comparison of environmental impact per person. The U S per capita footprint for wheat consumption was 0.035 ha per person in 1995, while Chile’s was 0.047 ha per person. This implies that the average citizen of Chile is utilizing a greater share of the world’s cropland than the average citizen of the U S in order to meet their consumption of wheat. While this example uses wheat consumption, similar
esti-mates can be made for other agricultural products by using the appropriate yield and food consump-tion data.
D etermining the ecological footprint of animal products such as meat, eggs, or milk required some additional assumptions. As noted earlier approximately 40% of world grain production is currently fed to livestock which means using an estimate of rangeland productivity in the calcula-tion of ecological footprints for animal products would provide a misleading estimate of environ-mental impact from animal agriculture. Instead several conversion factors were used to translate the quantity of animal products produced into a
grain-equivalent amount.7 F or example, Brown
and K ane (1994) estimate that it requires approx-imately 7 kg of grain to produce 1 kg of beef. Therefore, the 1 961 641 metric tons of beef con-sumed in Argentina in 1995 would require ap-proximately 13 731 487 metric tons of grain. This grain estimate is then divided by the average grain
yield of 2.5 metric tons/ha to arrive at a footprint
of 5 492 595 ha of land or 0.158 ha per person in
Argentina. In contrast, Japan consumed
1 348 338 metric tons of beef in 1995 resulting in
6The food data for this and all calculations in this paper
were obtained from the F AOSTAT D atabase of the U nited N ations F ood and Agriculture Organization (http:// www.fao.org). The yield is an estimate of the worldwide productivity of land used in producing wheat and is derived from F AO data for world food consumption and land use. The purpose of using the world average yield rather than a yield specific to each country is to focus on the distribution of food and environmental impact across the world’s population and not on the distribution of productive capacity. All calcula-tions for 1995 are based on a 3-year average of 1994 – 1996, and all 1985 calculations are averages of 1984 – 86 data.
7The following conversion efficiencies were used to convert
a footprint of 3 775 346 ha (=1 348 338*7/2.5) or 0.030 ha per capita thus showing a much lower impact as a result of a less beef-intensive diet.
F or this paper, ecological footprints were esti-mated for 19 categories of food for 1995 and 1985. Since the footprint associated with each food category is measured in hectares of land each may be added together to estimate the to-tal amount of land area needed to support food consumption. This total footprint provides an overall estimate of the degree of environmental impact resulting from food consumption in each nation. Estimates were completed for 178 coun-tries in 1995, and 158 councoun-tries in 1985. Table 2 shows the results of the footprint calculations expressed on a per capita basis and broken down by region. Comparison of the relative magnitudes is revealing. F or instance, while the average N orth American consumed about 50% more calories than the average African in 1995, the N orth American’s diet generated approxi-mately 175% more environmental impact than the African’s diet. N otice also that while calo-ries per capita was greater in Europe than in Oceania in 1995, Oceania had a greater environ-mental impact per capita as a result of the heavy reliance on animal products in the diet. The trend since 1985 is mixed, with N orth America, South and Central America, and Asia all exhibiting increases in environmental impact per person while the other regions show de-creases. H owever, the world average reveals that
overall agriculture has increased in environmen-tal impact per capita since 1985.
Breaking down the footprint into vegetable and animal products shows that the N orth American diet has the greatest environmental impact for both categories. In addition, while the footprint associated with vegetable products is relatively consistent across regions there is a wider disparity in the footprint for animal prod-ucts. The final two columns in Table 2 express the fraction of total footprint that is derived from animal products. Comparison of these val-ues to the fraction of total calories derived from animal products in Table 1 reveals the dis-crepancy in impact between vegetable products and animal products. F or the world, animal products made up only about 16% of total calo-ries while generating approximately 35% of total environmental impact from agriculture.
The statistical measures used to examine the distribution of calories were also employed for the distribution of environmental impact as measured by the ecological footprint. These esti-mates are shown at the bottom of Table 2 and when compared to the corresponding measures in Table 1 indicate that there is substantially greater inequality in the distribution of environ-mental impact than there is in the distribution of food calories. Each of the statistical measures of inequality for total environmental impact are over twice the same measures of inequality in food calories. While all the measures tell a simi-lar story the H oover index provides an intuitive explanation of the issue. R ecalling that the H oover index measures the amount of some variable that would need to be redistributed to obtain a completely equal distribution the esti-mated H oover index in 1995 indicates that ap-proximately 6.2% of calories would need to be redistributed for complete equality in food calo-ries. H owever, the H oover index implies that 15.6% of environmental impact would need to be redistributed for equality. Therefore, the de-gree of inequality in environmental impact is roughly 2.5 times the inequality in the distribu-tion of food.
Eq. (1) shows that the source of inequality in the distribution of environmental impact is from
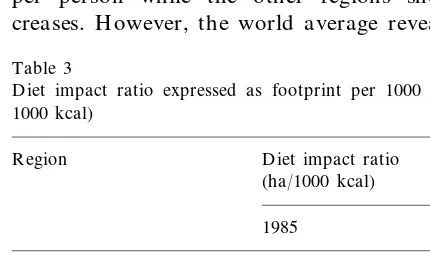
Table 3
D iet impact ratio expressed as footprint per 1000 kcal (ha/ 1000 kcal)
R egion D iet impact ratio (ha/1000 kcal)
South and Central America 0.110 0.113 0.145 0.151
Oceania
Europe 0.124 0.120
N orth America 0.160 0.153
0.095 0.094
two sources: differences in calories per capita (Table 1), or differences in the diet impact ratio. Table 3 shows the average diet impact ratios for regions of the world and reveals that the regions with the highest diet impact ratios are N orth America and Oceania, whose diets generate al-most twice as much impact per calorie as Asia and Africa. N ot surprisingly, the average diets of N orth America and Oceania are also two of the most meat-intensive as indicated in the last two columns of Table 2. The diet impact ratios of South and Central America and Europe are relatively close to one another indicating diets that are similar in environmental impact. This result is masked in Table 2 as impact per capita is influence by both calories per capita and the diet impact ratio, therefore differences in envi-ronmental impact between Europe and South and Central America are more a result of differ-ences in per capita calorie consumption than differences in diet. Africa and Asia have the least environmentally damaging diets but Asia exhibited the greatest increase in diet impact ra-tio of any region over the 1985 – 95 time period.
R educing the diet impact ratio through the implementation of a tax as G oodland (1997) suggests or through another means would lead to a greater degree of equality in the distribu-tion of environmental impact. In addidistribu-tion, the ability of the world to feed its population could improve as lower diet impact ratios would allow regions such as N orth America, Oceania, or Eu-rope to maintain their calorie intake while using a smaller proportion of scarce agricultural re-sources. Therefore other regions could experi-ence an increase in food availability which in turn would reduce the amount of inequality in the distribution of food calories.
5. Summary and conclusions
This paper has examined how calorie con-sumption and environmental impact are dis-tributed across the world. A simple model was employed to show how achieving a sustainable scale affects distribution issues. R awlsian efforts to improve the status of the least well-off
indi-viduals could come about from a redistribution of calories or a reduction in diet impact ratios. Analysis of food consumption data reveals there is significantly greater inequality in the tion of environmental impact than the
distribu-tion of caloric consumption, suggesting an
alteration of diet could potentially improve eq-uity.
Two important issues have not been ad-dressed. F irst, while efforts to increase the
de-gree of equity in the distribution of
environmental impact are important, achieving a sustainable scale requires the recognition of and adherence to biophysical limits to scale. Sustain-ability will require policies that prevent agricul-ture from exceeding sustainable scale while still providing adequate food for the population. Second, while reducing the diet impact ratio can potentially lead to increased food availability for those groups currently consuming the fewest calories, how such improvements in equity could be ensured must be addressed in future research.
Acknowledgements
The author would like to thank three anony-mous referees for their constructive comments.
References
Atkinson, A.B., Stiglitz, J.E., 1980. Lectures on Public Eco-nomics. M cG raw-H ill, N ew York, p. 619.
Brown, L.R ., K ane, H ., 1994. F ull H ouse. W.W. N orton, N ew York, p. 261.
D aly, H .E., 1991. Elements of environmental macroeconom-ics. In: Costanza, R . (Ed.), Ecological Economics: The Science and M anagement of Sustainability. Columbia U ni-versity Press, N ew York, pp. 32 – 46.
D aly, H .E., 1996. Beyond G rowth. Beacon Press, Boston, p. 253.
D urning, A.B., Brough, H .B., 1991. Taking Stock: Animal F arming and the Environment, Worldwatch Paper 103. Worldwatch Institute, Washington D .C.
Ehrlich, P., H oldren, J., 1971. Impact of population growth. Science 171, 1212 – 1217.
F AO, F ood and Agriculture Organization of the U nited N a-tions, 1996. F ood, Agriculture and F ood Security: D evel-opments since the World F ood Conference and Prospects. F AO, R ome.
F AO, F ood and Agriculture Organization of the U nited N a-tions, 1996. World F ood Summit: F ood Security Issues in Europe. ER C/96/4. F AO, R ome.
F AO, F ood and Agriculture Organization of the U nited N a-tions, 1997. F AOSTAT Statistics D atabase. F AO, R ome. http://www.fao.org
G oodland, R ., 1997. Environmental sustainability in agricul-ture: diet matters. Ecol. Econ. 23 (3), 189 – 200.
H arris, J.M ., K ennedy, S., 1999. Carrying capacity in agricul-ture: global and regional issues. Ecol. Econ. 29 (3), 443 – 461.
H oover, E.M ., 1941. Interstate redistribution of population: 1850 – 1940. J. Econ. H istory 1, 199 – 205.
Luks, F ., Stewen, M ., 1999. Why biophysical assessments will bring distribution issues to the top of the agenda. Ecol. Econ. 29 (1), 33 – 35.
M cG inn, A.P., 1998. R ocking the Boat: Conserving F isheries
and Protecting Jobs, Worldwatch Paper 142. Worldwatch Institute, Washington D .C.
Plane, D .A., R ogerson, P.A., 1994. The G eographical Analysis of Population. Wiley, N ew York, p. 417.
Sundrum, R .M ., 1990. Income D istribution in Less D eveloped Countries. R outledge, London.
U N EP, U nited N ations Environment Programme, 1999. G lobal Environment Outlook 2000. Earthscan, London, p. 398.
Wackernagel, M ., R ees, W., 1994. Appropriating carrying capacity: measuring natural capital requirements of the human economy. In: Jansson, A., H ammer, M ., F olke, C., Costanza, R . (Eds.), Investing in N atural Capital: Ecologi-cal Economics Approaches to Sustainability. Island Press, Washingtion D .C.
Wackernagel, M ., R ees, W., 1996. Our Ecological F ootprint: R educing H uman Impact on the Earth. N ew Society, G abriola Island, BC, Canada, p. 160.
WR I, World R esources Institute, 1994. World R esources, 1994 – 1995. Oxford U niversity Press, N ew York.