STATE-OWNED ENTERPRISES PERFORMANCE AND THE ROLE OF CORPORATE GOVERNANCE AND STRATEGY SELECTION
Abstract
The inconclusive results of earlier studies have given a reasonable doubt whether state ownership in state-owned enterprises is the main cause of low performance as well as the source of inefficiency within the company. There is also still little evidence about this topic for the emerging economies, such as Indonesia. Therefore, this study is about to examine whether there is a difference on performance related to different type of ownership of publicly listed SOE and non-SOE in Indonesia. It also wants to examine the influence of moderating factors of strategy selection and corporate governance mechanism over this different type of ownership on the performance of the company. The corporate governance mechanisms that will be put to the test are audit quality and level of board independence. The empirical results proved that there are no significant and systematic effects from type of ownership difference between SOE and non-SOE on the performance of the company. It also proved that strategy selection and audit quality have moderating role in the relations between type of ownership and performance, while the level of board independence has not.
Introduction
Previous studies that examine the influence of type of ownership between private and
state-owned companies on performance still reporting mixed results. Many studies conclude
that privately owned companies generally perform better than the state-owned companies
(Boardman and Vining, 1989; Goldeng et al., 2008). While several studies find ambiguous or
not find a systematic and significant difference in performance between private owned
companies and state-owned companies (Atkinson and Halvorsen, 1986; Newbery and Pollit,
1997). Nevertheless few studies argued that state-owned companies perform better than
privately owned companies (see Bruggink, 1982).
The diverse results of these studies gave a reasonable doubt whether state ownership
in state-owned enterprises is the main cause of low performance and competitiveness as well
as the source of inefficiency within the company. Those competing conclusion also indicated
the need for a better understanding about the relationship between state ownership in
state-owned enterprises and the performance.
In the meantime, of the many studies concluding that privately owned companies
perform better than state-owned enterprises, there is still little evidence for the emerging
economies, such as Indonesia. Moreover, most of the studies that compare state-owned enterprises (SOE) with non-SOE only cover a limited sample selection based on certain
industry sectors only. Research conducted with a selection of sample that includes the entire
population of public companies in a country is still rare.
Therefore, this study objective is about to examine whether there is a difference in
performance between SOE and non-SOE in Indonesia. Also be tested the influence of the
good corporate governance mechanism and selection of strategy over these two different
ownership types (between SOE and non-SOE) on the performance differences. The good
corporate governance mechanisms that will be put to the test is the audit quality and the level
of board independence.
This study contributes to add related literature that explains how the differences
between ownership types affect performance in the context of the public companies in
Indonesia. This study also add to the understanding of SOE and its governance for the policy
settings and effective supervision of SOE by the government order to optimize the role of
Next, it will be explained in brief about the SOE and its institutional development in
Indonesia. Then some of the literature review about the type of ownership and its influence
on the company's performance will be briefly presented. It will be followed by description of
the role of strategy selection, quality of external auditors and the board independence level on
moderating those influences. After hypothesis development, there will be an explanation on
the research design and analysis of the test results. As closing, there will be conclusions and
suggestions for future research on this related topic.
SOE in Indonesia
State ownership in SOE very often associated as the main cause of the inefficiency.
There are three challenges facing the good corporate governance practices in SOE compared
to the non-SOE that claimed as the cause of poor performance of SOE, namely: the
competing purposes (commercial vs. non-commercial), bureaucratic interference and political
interventions, as well as lack of transparency and weak managerial incentives (Wong, 2004).
Based on the belief that private ownership is superior in performance compared to the state
ownership (e.g. in Goldeng et al., 2008), then a lot of SOE especially in emerging economies,
privatized. Privatization is perceived as a means to improve the performance of SOE
(Wicaksono, 2009; Bozec and Breton, 2003).
In Indonesia, SOE regulations are under the umbrella of the SOE act (the Law No.
19/2003). Based on that act, the SOE are defined as businesses that all or most of the capital
is owned by the state through its investment directly derived from the separated state finance.
Therefore refers to the Act, there are two SOE legal entity form, ie.: General Corporations
and Limited Corporation. The General Corporation is the SOE that all of its capital owned by
the State and is not divided into shares. This kind of corporation was established for the
purposes of public benefit in the form of the provision of goods and or services and at once
looking for profit based on the principles of the corporate management. While the Limited
Corporation is the SOE that all of its capital or at least 51% of its shares owned by the State
with its main purpose of seeking profits. Those Limited Corporations of SOE that meet
certain criteria and or publicly listed in accordance with the prevailing capital market
regulations are shaped as Limited Liability Company.
Strategic Policy on SOE management in Indonesia according to the SOE act is
conducted under the State Ministry of SOE. The strategy of the Ministry to improve the
steps: profitization, restructuring, and privatization. In general, the performance of SOE is
still below the non-SOE if seen from indicators such as ROA, ROE and NPM implementation
(Wicaksono, 2009). Therefore, various regulations are made by the government to increase
the performance of SOE. Particularly the regulation associated with the implementation of
good corporate governance practices as well as to encourage SOE to go public.
Hypothesis Development
Ownership structures are instrumental in shaping the governance and performance of
the company (Shleifer and Vishny, 1997). But the influence of the related state ownership
against the company's performance still found in varying conclusions. Study of Boardman
and Vining (1989), Shleifer (1998) and Goldeng et al. (2008) concluded that state ownership
in SOE is associated as the main cause of the inefficiency. While the study of Atkinson and
Halvorsen (1986) as well as Newbery and Pollit (1997) found no significant and systematic
difference in performance between SOE and non-SOE. Even few studies (see Bruggink,
1982) argued that SOE perform better than non-SOE. Based on that mixed conclusion from
early studies, then we developed the first hypothesis of this study as follows:
H1: The difference type of ownership between SOE and non-SOE affect the
company's performance.
Previous studies also found some factors that can affect the performance of the
company. Gani and Jermias (2006) found a significant difference in performance on a
company with a different competitive strategy options. Therefore we will examine whether
the selection of different strategies can moderate the influence of state ownership on the
performance of the company. Then we developed the second hypothesis as follows:
H2: Strategy selection moderating the influence of difference type of ownership
between SOE and non-SOE on the company's performance.
Previous study by Larcker and Richardson (2002) concluded that there is a positive
relationship between the auditor size and the audit quality that will affect performance and
corporate governance. Concern on reputation is being a major deciding factor for big auditors
in limiting the client’s accounting choice which can degrade the quality of its financial
performance. Based on this finding, we use audit size as the proxy of audit quality. Then we
H3: Auditor size moderating the influence of difference type of ownership between
SOE and non-SOE onthe company’s performance.
Related to the influence of the level of board independence on the company's
performance, it still found mixed results. Chung et al. (2003) concluded that the level of
board independence have positive effect on performance through effective control against
management. Meanwhile Bathala and Rao (1995) found negative relationship between the
level of board independence and the performance of the company. Other studies by Prevost et
al. (2002) found no significant relationship between the level of board independence and the
performance of the company. Based on those competing results, we developed the fourth
hypothesis as follows:
H4: Level of board independence moderating the influence of difference type of
ownership between SOE and non-SOE on the company's performance.
Research Design
Because this study is based on the perspective of corporate governance and strategy
selection, it will be used the dependent variable in the form of company’s performance
(PERFORM) that reflect the benefit for shareholders. In this case, the benefit is associated
with the company's profitability. As a measure of the profitability we select two profitability
ratios: ROE and ROI. Both measurement of the profitability are expected to capture the
performance differences between SOE and non-SOE that are affected by managerial factors
(financial and operational) and stock market conditions (Goldeng et al., 2008).
The primary independent variable associated with type of ownership (OWNTYPE) is a
dummy variable, given the value of 1 if the companis are SOE and 0 otherwise. The
independent variable associated with the company's strategy selection (DSTRAT) is a dummy
variable, given the value of 1 if the companies select strategy of innovation, and 0 if the
company select the strategy of cost-efficiency. The strategy as in Gani and Jermias (2006) is
determined by comparing the value of Asset Utilization Efficiency (AUE) with Premium Price
Capability (PPC). AUE is calculated by using the ratio of total sales to total assets and PPC is calculated by using ratio of gross profit to total sales. If PPC is greater than AUE, then it is
classified as selecting the strategy of innovation. Conversely if AUE is larger than the PPC,
then it is classified as selecting the strategy of cost-efficiency. Related to the auditor quality
company audited by Big Four and 0 otherwise. The level of board independence (INDEP)
uses the ratio of the total independent board to the total amount of board of commissioners.
This study also uses three control variables. First, company size (SIZE) which in many
studies inferred effect on company performance (e.g. Frank and Goyal, 2003). The size of the
company is measured by the natural logarithm (Ln) values of the total assets. Second,
leverage (LEV) that affects the performance through oversight activity by the lender. In this study the leverage is measured by using ratio of total debt to total assets instead of the ratio of
total debt to equity in order to avoid the negative value of the variable. Third, Investment
Opportunities Set (IOS) that may affect performance because the company with high investment opportunities will face higher cost of control (Andersen, Francis and Stokes,
1993). IOS is measured as the ratio of gross PPE against market value of equity plus the book
value of the liabilities.
The first hypothesis was tested by looking at the influence of direct relationship of
type of ownership on performance. While the second, third and fourth hypotheses were
examined by moderating the type of ownership with the strategy selection, audit quality and
level of board independence against its influence on performance. Therefore a model
equation for all hypothesis testing is developed as follows:
= + + + + +
+ +
+ + + +
Description:
PERFORM = Company's performance, measured by profitability ratio of ROE and ROI
OWNTYPE = Type of ownership, dummy variable given the value of 1 if SOE and 0 otherwise
DSTRAT = Selection of corporate strategy, dummy variables given the value of 1 if select strategy of innovation, and 0 if select
strategy of cost efficiency
AUDQUAL = Audit quality, dummy variable given the value of 1 if audited by the Big Four and 0 otherwise
SIZE = Company’s size, measured by the value of natural logarithm (Ln) of total assets
LEV = Leverage, calculated by the ratio of total debts to total assets IOS = Investment Opportunities Set, calculated by the ratio of gross
PPE against market value of equity plus book value of liabilities
Based on the equation model above, the conclusion of the first hypothesis is shown by
the estimation result of the coefficient OWNTYPE ( ). This coefficient of OWNTYPE ( )represents linear relation between the type of ownership (SOE vs. non-SOE) and the company’s performance. Whereas the conclusion of the second, third and fourth hypothesis
are shown through the estimation result of the coefficients OWNTYPE*DSTRAT ( ),
OWNTYPE*AUDQUAL ( ) and OWNTYPE*INDEP ( ). Those three coefficients represent the moderation effect of strategy selection, auditor quality and the level of board
independence against the influence of difference type of ownership (SOE vs. non-SOE) on
thecompany’sperformance.
The entire hypothesis of this study will be proven when the estimation result of all
four coefficients on the variable tested is significant. But this study does not predict the
direction of the relationship between those four independent variables on the company’s
performance due to mixed finding from previous studies. The direction of the relationship
will be known later through the regression results of the model.
Sample and Data Selection
The samples were taken from companies listed on the Indonesia stock exchange
(IDX) in the period of 2005-2014. The financial data is obtained from thomson reuters
knowledge database. The external auditor information and other data related to the composition of the Board are obtained through the annual report of the company by
hand-collected.
The selection of the sample was based on the category of the industrial sector issued
by IDX which consist of 9 sectors. Industrial categories of banking, financial services and
investment (Sector 8) are excluded from the sample. From a total of 517 listed companies,
400 companies of non-banking, non-financial services and non-investments industry are
selected. Then we excluded 5 companies listed in 2014 and thereafter and make 395
companies remain. This study also excluded 60 samples of firms that enter into the category
manufacturing of food, drinks and motor vehicles (sector 5). At this stage, we collected the
sample of 335 companies with a total of 2,252 firm-year observation. For more fair
comparison between SOE and non-SOE, we conducted sorting sample that fall into the range
of the same company size. As benchmark, we set the range of the total assets of SOE that are
in the range of Rp400 million up to Rp150 billion. Then we excluded some samples with
incomplete financial data or outliers. Finally there are 293 companies, which consist of 16
SOE and 27 non-SOE, with a total of 1,670 firm-year observation.
Descriptive statistics
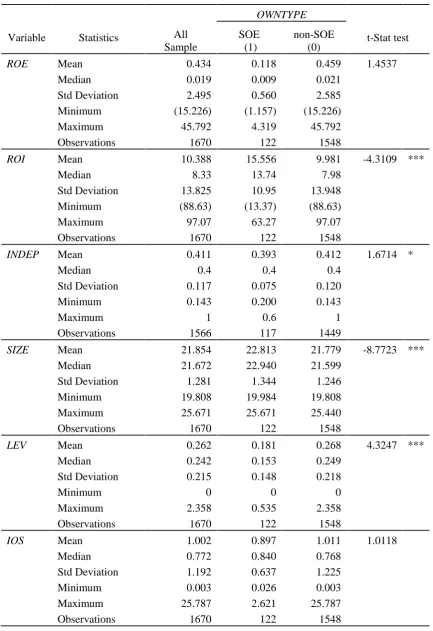
Descriptive statistics from all observations are shown in table 1 Panel A and Panel B.
We also performed a statistical comparison for each variable based on the type of ownership
(OWNTYPE) between SOE and non-SOE. Panel A of table 1 shows descriptive statistics for
continuous variables of ROE, ROI, INDEP, SIZE, LEV and IOS. Panel B of table 1 shows
descriptive statistics for dummy variables of AUDQUAL and DSTRAT. Table 1 also shows
the results of Test of Difference for each variable based on OWNTYPE. Panel A represent the
test of difference for continuous variables using t-stat test, while Panel B represent the test of
difference for dummy variable using the chi-square value.
From table 1 Panel A, it is shown that the average ROE and ROI for all samples are
0.43 and 10.39. While the average of ROE for the SOE and the non-SOE is 0.12 and 0.46.
However the result from t-stat test of the average ROE is not significant. In the other hand the
average of ROI for the SOE and the non-SOE is 15.56 and 9.98 with the result from the t-stat
test of the average ROI is significant (at the level of significance 1%). This result indicates that the average of ROI of SOE was significantly higher (at level of significance of 1%)
compared to the non-SOE. Test of difference also showed significant result for variable
INDEP, SIZE and LEV but not significant for variable IOS. This result indicates that SOE has fewer INDEP (at marginal level of significance 10%), less SIZE (at the level of significance
1%) and smaller LEV (at level of significance 1%) compared to the non-SOE.
Related to the dummy variables as indicated in table 1 Panel B, it shows that the
proportion of SOE that select Big4 auditor is 49.18%, while non-SOE is 47.93%. However
from the chi-square value, the results are not significant. Meanwhile the proportion of SOE
that select innovation strategy compared to cost-efficiency is 18.03% to 81,97%, while the
proportion of non-SOE is 32.38% to 67,62%. It indicates that public companies in Indonesia,
Table 1 Descriptive Statistics
Panel A: descriptive statistics and test different average continuous variables
Panel B: descriptive statistics and test different proportions of variable dummy
AUDQUAL Big4 1 802 60 49.18 742 47.93 0.0705
Non-Big4 0 868 62 50.82 806 52.07
Observations 1670 122 100.00 1548 100.00
DTSRAT Innovation 1 520 22 18.03 498 32.38 10.8152 *** Cost
-efficiency 0 1140 100 81.97 1040 67.62
Observations 1660 122 100.00 1538 100.00
Description:
*, **, *** = significance at the level of 10%, 5% and 1%
ROE = Return on Equity, measured as the ratio of net profit after taxation before extraordinary items to equity of common stock.
ROI = Return on Investments, measured as the ratio of net profit after taxation before extraordinary items to capital investments (long-term debt).
OWNTYPE = Type of ownership, dummy variable, given the value of 1 if SOE, and 0 otherwise
DSTRAT = Selection of corporate strategy, dummy variables, given the value of 1 if select the strategy of innovation, and 0 if select the strategy of cost efficiency.
AUDQUAL = Auditor quality, dummy variables, given the value of 1 if audited by the Big Four and 0 otherwise.
INDEP = Level of board independence, measured as the ratio of total independent board of commissioners to the total amount of Board of Commissioners.
SIZE = Size of the company, measured as the value of the natural logarithm (Ln) of total assets. LEV = Leverage, measured as the ratio of total debt to total assets.
IOS = Investment Opportunities Set, measured as the ratio of gross PPE against market value of equity plus the book value of the liabilities
value for this strategy selection is significant (at the level of significance 1%). This means that the proportion of SOE that select the strategy of cost-efficiency significantly larger (at the
level of significance 1%) than the non-SOE.
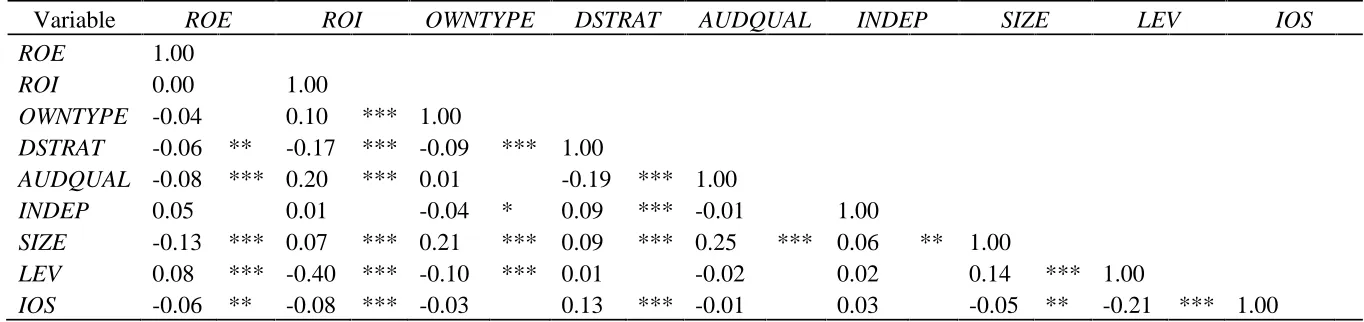
From the Pearson's correlation test for all variables used as shown by table 2, It is
shown that ROE has a negative and significant correlation with DSTRAT and IOS (at level of
significance 5%), as well as AUDQUAL and SIZE (at the level of significance 1%). This
negative correlation gives an early indication that companies benefited from ROE select the
strategy of cost-efficiency, have a smaller value of investment opportunity, are audited by
non-Big4 auditors and have smaller size of company. However the ROE has a positive and
significant correlation with LEV (at level of significance 1%). This indicates that the
Table 2 Test Correlation
Variable ROE ROI OWNTYPE DSTRAT AUDQUAL INDEP SIZE LEV IOS
ROE 1.00
ROI 0.00 1.00
OWNTYPE -0.04 0.10 *** 1.00
DSTRAT -0.06 ** -0.17 *** -0.09 *** 1.00
AUDQUAL -0.08 *** 0.20 *** 0.01 -0.19 *** 1.00
INDEP 0.05 0.01 -0.04 * 0.09 *** -0.01 1.00
SIZE -0.13 *** 0.07 *** 0.21 *** 0.09 *** 0.25 *** 0.06 ** 1.00
LEV 0.08 *** -0.40 *** -0.10 *** 0.01 -0.02 0.02 0.14 *** 1.00
IOS -0.06 ** -0.08 *** -0.03 0.13 *** -0.01 0.03 -0.05 ** -0.21 *** 1.00
Description:
*, **, *** = significance at the level of 10%, 5% and 1%
ROE = Return on Equity, measured as the ratio of net profit after taxation before extraordinary items to equity of common stock.
ROI = Return on Investments, measured as the ratio of net profit after taxation before extraordinary items to capital investments (long-term debt). OWNTYPE = Type of ownership, dummy variable, given the value of 1 if SOE, and 0 otherwise
DSTRAT = Selection of corporate strategy, dummy variables, given the value of 1 if select the strategy of innovation, and 0 if select the strategy of cost efficiency. AUDQUAL = Auditor quality, dummy variables, given the value of 1 if audited by the Big Four and 0 otherwise.
INDEP = Level of board independence, measured as the ratio of total independent board of commissioners to the total amount of Board of Commissioners. SIZE = Size of the company, measured as the value of the natural logarithm (Ln) of total assets.
LEV = Leverage, measured as the ratio of total debt to total assets.
Meanwhile, ROI has a negative and significant correlation with DSTRAT, LEV and
IOS (at level of significance 1%) but has a positive and significant correlation with AUDQUAL and SIZE (at the level of significance 1%). It indicates that companies benefited from ROI select the strategy of cost-efficiency, use less financing through debt, have smaller
investment opportunity, are audited by Big4 auditors and have bigger company size. There
are also indications that the level of board independence of the Board of Commissioners does
not affect the performance of company, as shown by the insignificant correlation between
ROE or ROI and INDEP.
The analysis of the correlation test for OWNTYPE shows a negative and significant
correlation with DSTRAT and LEV (at level of significance 1%), as well as significantly
negative correlated with INDEP (at marginal level of significance 10%). However it has
positive and significant correlation with SIZE (on the level of significance 1%). Those results
shows no different with its test of difference results as mentioned before which indicated that
the SOE prefer the strategy of cost-efficiency, using less financing through debt, have bigger
company size and have less number of independent commissioners.
The Results
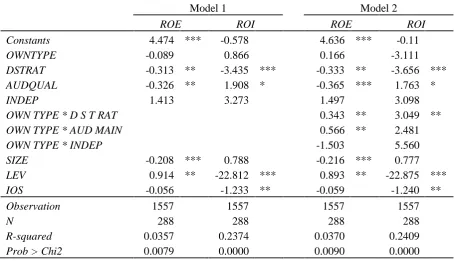
Table 3 shows the regression results of equations model to test the hypothesis with
ROE and ROI as the dependent variable. The regression used panel data with random effect and has taken into account the potential for heteroscedasticity on the data. The overall model
was significant with a value of F-statistics indicated through the values of Chi2>Prob less
than 0.01 (significant at the level of 1%).
Model 1 in table 3 represents the regression results of the direct influence of the
independent variable excluding the interaction variable. It is shown that the value of the
coefficient of OWNTYPE is not significant. These results indicate that the type of ownership
has no significant effect on performance. However there is the significant negative influence
of strategy selection (DSTRAT) both on the ROE (at level of significance 5%) and ROI (at the
level of significance 1%). This result indicates that the strategy of cost-efficiency has an
effect to improve performance. Whereas the level of board independence was found no
significant results on the coefficient of INDEP. This indicates that the level of board
Table 3
ROE = Return on Equity, measured as the ratio of net profit after taxation before extraordinary items to equity of common stock.
ROI = Return on Investments, measured as the ratio of net profit after taxation before extraordinary items to capital investments (long-term debt).
OWNTYPE = Type of ownership, dummy variable, given the value of 1 if SOE, and 0 otherwise
DSTRAT = Selection of corporate strategy, dummy variables, given the value of 1 if select the strategy of innovation, and 0 if select the strategy of cost efficiency.
AUDQUAL = Auditor quality, dummy variables, given the value of 1 if audited by the Big Four and 0 otherwise.
INDEP = Level of board independence, measured as the ratio of total independent board of commissioners to the total amount of Board of Commissioners.
SIZE = Size of the company, measured as the value of the natural logarithm (Ln) of total assets. LEV = Leverage, measured as the ratio of total debt to total assets.
IOS = Investment Opportunities Set, measured as the ratio of gross PPE against market value of equity plus the book value of the liabilities
Model 2 in table 3 shows the regression results that including interaction variable of
strategy selection, auditor quality and level of board independence with the type of ownership
on performance. Hence the model 2 is used for testing all four hypotheses on this study.
Related to the first hypothesis, regressions result on the model 2 shows that the coefficient
OWNTYPE is not significant. These results do not support the first hypothesis that states the difference type of ownership affect performance. It can be inferred that there is no significant
finding might indicate that the purpose of government policy to improve the performance of
SOE through privatization more or less has been achieved. Therefore, state ownership factor
that is claimed by many previous studies as factor that aggravate the company's performance
was not proven in Indonesia’s listed SOE.
Related to the moderation factor from strategy selection over the type of ownership,
the coefficient of the interactions variable of OWNTYPE*DSTRAT on the model 2 shows
significant positive effect (at the level of significance 5%) both on the ROE as well as ROI.
These findings support the second hypothesis that states strategy selection moderates the
influence of type of ownership on performance. In this case, based on the regression results, it
shows that the moderating effect is positive. This suggests that the influence of the type of
ownership on performance is stronger in SOE that select the strategy of innovations. While
the regression results for the moderation factor from the auditor quality over the type of
ownership is indicated by the coefficient of the interaction variable of
OWNTYPE*AUDQUAL on the model 2. It shows significant positive effect (at the level of significance 5%) on ROE but not significant on ROI. These findings support the third
hypothesis that audit quality moderates the influence of type of ownership on performance,
but it only applies on ROE. Based on regression results, the moderating effect is positive.
This suggests that the influence of type of ownership on performance is stronger in SOE
audited by the Big4 auditors. The third moderation factor is related to the role of the level of
board independence. It is indicated by the coefficients of interaction variable of
OWNTYPE*INDEP that is found not significant. It suggests that the fourth hypothesis which states that level of board independence moderates the influence of type of ownership on
performance is not proven.
Regression Results for control variables are consistent on both models. Coefficient
SIZE has significant negative value on ROE (at level of significance 1%) but not significant on ROI. This means the smaller the size of the company the greater the performance in terms
of ROE. Whereas the coefficient LEV has significant positive value on ROE (at level of
significance 5%) but has significant negative value on ROI (on the level of significance of
1%). This shows that the performance in terms of ROE increases on companies that have
larger financing through debt. In contrast, the performance in terms of ROI increases on
companies that have smaller financing through debt. For the coefficients of IOS, it is found
5%). The results are consistent with the findings on the study of Andersen, Francis and
Stokes (1993) which argue that the smaller the investment opportunities the greater the
performance, which in the context of this study is in terms of ROI.
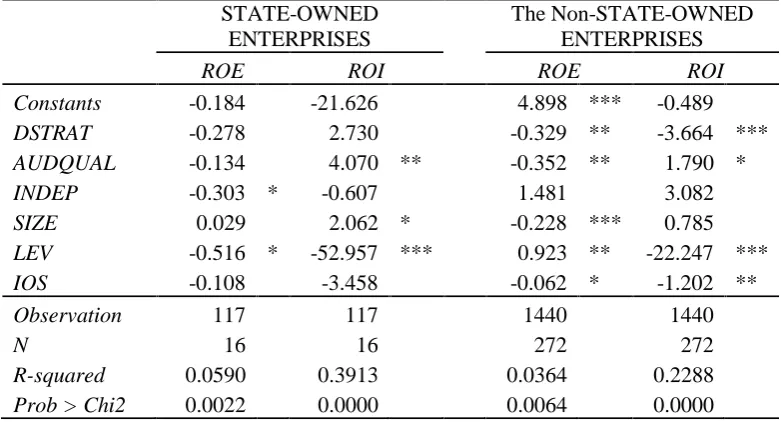
4.3. Robustness Test
As an additional test, we performed an analysis of the relationship between factors of
strategy selections, audit quality and the level of board independence along with other control
variables on performance at different types of ownership. The analysis is done by splitting the
sample firms into sub-groups of SOE and non-SOE. In general the model equations for these
two sub-groups are significant with the values of F-statistics test are less than 0.01
(significant at the level of 1%). The regression results of each group are shown in table 4.
From table 4, it can be shown that the influence of the independent variable on
performance varies on different sub-groups. In SOE, strategy selection has no effect on
performance, but it has significant negative effect in non-SOE, both on ROE (at level of
significance 5%) as well as on ROI (at the level of significance 1%). Related to audit quality,
it only has significant positive effect on ROI (at the level of significance 5%) in SOE. While
in non-SOE, it has significant negative effect on ROE (at the level of significance 5%) and
significant positive effect on ROI (at the marginal level of significance 10%). For the level of
board independence, it found significant negative influence (at the marginal level of
significance 10%) only on ROE in the SOE and were not found significant in non-SOE.
For the control variables, it is found that SIZE has significant positive influence on
performance (at marginal level of significance 10%) in SOE in terms of ROI. This might be
due to no variation of size in listed SOE. It happened because SOE conducted a public
offering in the capital market is usually the big size SOE. While in non-SOE, it is found that
SIZE has significant negative influence (at level of significance 1%) on performance only in terms of ROE. For LEV, it has significant negative relationship on ROE (at the marginal level
of significance 10%) and on ROI (at level of significance 1%) in SOE. This finding indicates
that the performance of SOE with more debt will decrease. Contrary to SOE, in non-SOE
there is significant positive effect of LEV on ROE (at level of significance of 5%) but
significant negative effect of LEV on ROI (at level of significance 1%). For IOS, it is found
that non-SOE has significant negative relationship on ROE (at marginal level of significance
10%) and on ROI (at level of significance 5%). However, no significant relationship is found
Table 4
ROE = Return on Equity, measured as the ratio of net profit after taxation before extraordinary items to equity of common stock.
ROI = Return on Investments, measured as the ratio of net profit after taxation before extraordinary items to capital investments (long-term debt).
OWNTYPE = Type of ownership, dummy variable, given the value of 1 if SOE, and 0 otherwise DSTRAT = Selection of corporate strategy, dummy variables, given the value of 1 if select the
strategy of innovation, and 0 if select the strategy of cost efficiency.
AUDQUAL = Auditor quality, dummy variables, given the value of 1 if audited by the Big Four and 0 otherwise.
INDEP = Level of board independence, measured as the ratio of total independent board of commissioners to the total amount of Board of Commissioners.
SIZE = Size of the company, measured as the value of the natural logarithm (Ln) of total assets.
LEV = Leverage, measured as the ratio of total debt to total assets.
IOS = Investment Opportunities Set, measured as the ratio of gross PPE against market value of equity plus the book value of the liabilities
Discussion and Suggestions
This study objective is about to examine whether there is a difference impact on
performance based on different type of ownership of publicly listed SOE and non-SOE in
Indonesia. It also wants to examine the influence of moderating factors of strategy selection
and corporate governance mechanism over this different type of ownership on the
performance of the company. The corporate governance mechanisms that will be put to the
Many studies conclude that non-SOE generally perform better than SOE. Yet some
previous studies found ambiguous results or not found significant and systematic differences
in performance between SOE and non-SOE. Even alittle study also argued that SOE perform
better than non-SOE. This mixed conclusion brings up doubts against strong opinion that has
already believed that state ownership in SOE is the main cause of low performance and low
competitiveness as well as the source of the inefficiency in the company.
The empirical results in this study proved that there are no significant and systematic
effects from type of ownership difference between SOE and non-SOE on the performance of
the company. It argued that there is not enough evidence to state that the state ownership in
the listed SOE cause a significant performance differences vis a vis non-SOE. These findings
might indicate that the purpose of government policy to improve the performance of SOE
through privatization policy has been achieved. State ownership factor does not affect the
performance of public listed SOE in Indonesia.
The empirical results also proved that the interaction of the strategy selection and the
audit quality with the difference type of ownership significantly affect performance. While
the interaction of the level of independence of the Board of Commissioners with the
difference type of ownership is not significantly affect performance. Analysis of the
additional tests also proved that there is a variation on the relationship between these three
factors on performance in SOE and non-SOE. Strategy selection for example found not
related to the performance of SOE but in contrast found related to the company's performance
of non-SOE. Audit quality has positive effect on the performance of SOE but has negative
effect on the performance of non-SOE. However the level of independence of the Board of
Commissioners in general has no effect on the company's performance both in SOE and in
non-SOE.
This study limits its testing only on SOE that already go public. In the future, it is
interesting to further examined whether there is a difference between the performance of SOE
that have not yet to go public with SOE that are already listed on the capital market. It is
expected that the findings generated can be increasingly strengthened the conclusions
obtained related to the performance related behavior of SOE. The more solid conclusion will
add to the understanding of SOE and its governance. Thus the policy settings and the
supervision of SOE that were taken by the government will in turn optimize the role of SOE
References
Anderson, D., Francis, J. R., & Stokes, D. J. (1994). Auditing, directorships and the demand
for monitoring. Journal of Accounting and Public Policy, 12(4), 361-375.
Atkinson,
s
. E., & Halvorsen, R. (1986). The relative efficiency of public and private firms ina regulated environment: The case of U.S. electric utilities. Journal of Public Economics,
29(3), 281-294.
Bathala, C. T., & Rao, R. P. (1995). The determinants of board composition: An agency
theory perspective. Production management and decision economics, 16(1), 59-69.
Boardman, A. E., & Vining, A. R. (1989). Ownership and performance in competitive
environments: A comparison of the performance of private, mixed, and state-owned
enterprises. The Journal of law and Economics, 1-33.
Bruggink, T. H. (1982). P ublic versus regulated private enterprise i n t he municipal water
industry-a comparison of operating costs. Quarterly review of economics and business, 22(1),
111-125.
Goldeng, E., Grünfeld, L. A., & Benito, G. R. (2008). The performance differential between
private and state-owned enterprises: The roles of ownership, management and market
structure. Journal of Management Studies, 45(7), 1244-1273.
Chung, K. H., Wright, P., & Second, B. (2003). Corporate governance and market valuation
of capital and R & D investments. Review of Financial Economics,12(2), 161-172.
Frank, M. Z., & Goyal, V. K. (2003). Testing the pecking order theory of capital structure.
Journal of financial economics, 67(2), 217-223.
Gani, L., & Jermias, J. (2006). Investigating the effect of board independence on performance
across different strategies. The International Journal of Accounting, 41(3), 295-314.
Larcker, D. F., & Richardson, S. A. (2004). Fees paid to auditing firms, accrual choices, and
corporate governance. Journal of Accounting Research, 42(3), 625-658.
Newbery, D. M., & Pollitt, M. G. (1997). The restructuring and privatisation of Britain's
Prevost, A. K., Rao, R. P., & Hossain, M. (2002). Determinants of board composition in New
Zealand: a simultaneous equations approach. Journal of Empirical Finance, 9(4), 393-397.
Republic of Indonesia Law Number 19 of 2003 about State-Owned Enterprises.
Shleifer, A., & Vishny, R. W. (1997). A survey of corporate governance. The journal of
finance, 52(2), 737-783.
Shleifer, A. (1998). State versus private ownership. National bureau of economic research. a
Wicaksono, A. (2008). Indonesian state-owned enterprises: the challenge of reform.
Southeast Asian Affairs, 2008(2008), 146-165.
Wong, S. C. (2004). Improving corporate governance in SOEs: An integrated approach.