AFBE 2010 CONFERENCE
PAPERS
TABLE OF CONTENTS
Roberto Akyuwen, Arifin Indra Sulistyanto, ―THE DYNAεICS OFINDONESIA‘S CRUDE PAδε OIδ EXPORT‖ 1
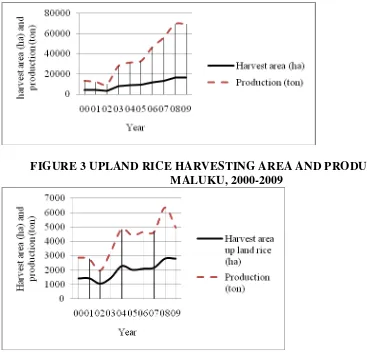
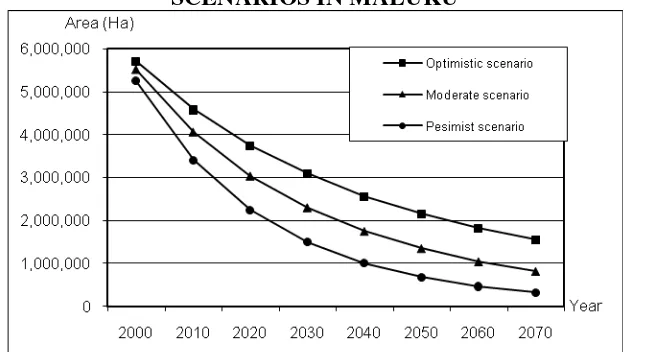
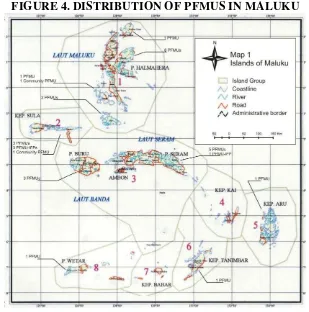
Wardis Girsang, ―FOOD SECURITY POLICY: A CASE OF MALUKU ISLANDS, INDONESIA‖
41
Agustinus Kastanya, ―THE MANAGEMENT OF SUSTAINABLE NATURAL PRODUCTION FORESTS FOR THE MOLCCASN ISLAND GROUPS , INDONESIA‖
55
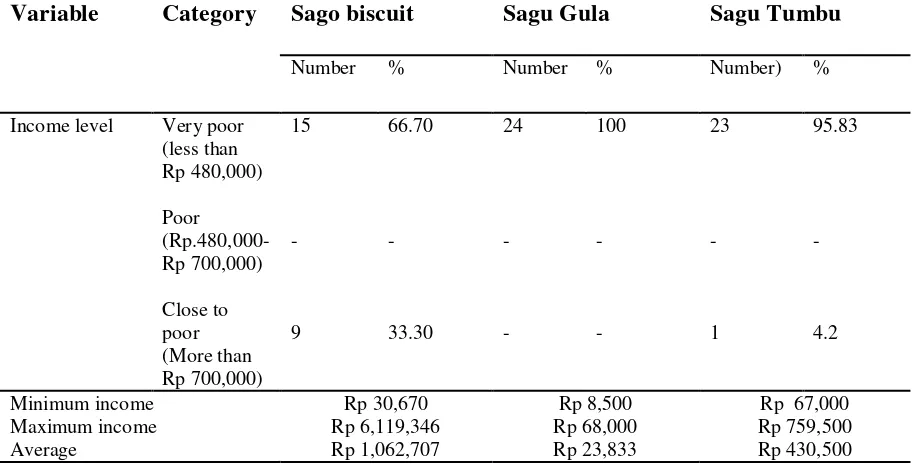
A.M. Sahusilawane and Esther. Kembauw, ―INCOME ANALYSIS: A CASE STUDY OF WOMEN SAGO WORKER IN AMBON ISLAND, INDONESIA‖
70
Lukman Mohammad Baga, Rahmat Yanuar, Feryanto William Karo-Karo,
―THE EFFECT OF THE GLOBAL ECONOMIC CRISIS ON MILK AGRIBUSINESS IN INDONESIA‖
86
Adrian D. Lubis, ―GLOBAL CRISIS HAS DELIVERED INDONESIA AGAINST THE NEGATIVE IMPACT OF EARLY HARVEST PROGRAM WITH CHINA‖
95
Tinjung Mary Prihtanti, ―POTENTIAL OF AGRICULTURAL LEADING COMMODITY BUSINESS IN MERAPI MERBABU AGROPOLITAN AREA
εAGEδANG, INDONESIA‖
114
Lukytawati Anggraeni, Tony Irawan, Ahmad Heri Firdaus, Amzul Rifin, ―THE CONTRIBUTION OF AGRICULTURAL SUB-SECTOR TO INDONESIAN ECONOMY AFTER ECONOMIC CRISIS‖
125
Amzul Rifin, ―WHAT DETERMINES THE PRICE OF COOKING OIL IN INDONESIA?‖
135
Maria, ―SUGAR-TRADING POLICY TOWARD THE AVAILABILITY AND DOMESTIC PRICE, INDONESIA‖
148
Muhammad Firdaus, ―HOW SEVERELY DID THE GLOBAL ECONOMIC CRISIS AFFECT INDONESIAN AGRIBUSINESS EXPORTS?‖
163
Firdiyansyah Romadhona and Adeline Puspitasiwi, ―STRATEGY
FORMULATION TO TRANSFORM COMPARATIVE ADVANTAGE INTO COMPETITIVE ADVANTAGE AS A RESPONSE OF GLOBAL CRISIS: CASE STUDY AT EMPING MELINJO BUSINESS IN SARI SONO
COOPERATIVE , INDONESIA‖
175
Muhamad Abduh, Roosemarina A. Rambe, ―STUDENTS‘ SATISFACTION LEVEL ON THE ENTREPRENEURSHIP EDUCATION PROGRAMS AT THE BENGKULU UNIVERSITY, INDONESIA‖
Tsuroyya Tsuroyy, Brian Pranata, and Wahdi S. A. Yudhi, ―PREVENTING THE GROWTH OF CHILD TRAFFICKING: RAISING PUBLIC
AWARENESS OF THE IMPORTANCE OF EDUCATION FOR STREET CHILDREN IN INDONESIA‖
204
Tsuroyya Tsuroyya, Mr Brian Pranata, and Wahdi S. A. Yudhi, ―A GLANCE OF KATHOEY LABORS: IN THE εIDST OF THAI‘S TRADITIONS AND LEGAL AUTHORITIES‖
213
Suciati Mega Wardani, ―THE REAL SECTOR EFFECTS OF THE
ECONOMIC CRISIS AND GLOBAL HEALTH IN SOUTHEAST ASIA: STUDY CASE: INSURANCE MANAGEMENT IN INDONESIA‖
220
Hastin Umi Anisah, ―THE ROLE OF BANJARESE CULTURE TO IMPROVE
PERFORMANCE AND COMPETITIVE ADVANTAGE THROUGH ISLAMIC ENTREPRENEURSHIP AND STRATEGY - SMALL AND MEDIUM ENTERPRISES IN JEWELLERY AND GEM STONES AT MARTAPURA, SOUTH KALIMANTAN, INDONESIA‖
236
Ningky Sasanti Munir, ―MODEL OF KNOWLEDGE CREATION IN A COMPANY: STUDY AT MODERN COSMETICS COMPANIES IN INDONESIA‖
248
Rina Oktaviani, Tony Irawan, and Lukytawati Anggraeni, ―THE IMPACT OF FISCAL AND MONETARY POLICY ON INDUSTRY AND INDONESIAN ECONOMY: A COMPUTABLE GENERAL EQUILIBRIUM ANALYSIS‖
273
Sahnaz Ubud, Marthin Nanere, ―THE ROLE OF SUPPLY CHAIN
FLEXIBILITY AND ITS ANTECEDENT VARIABLE IN INCREASING COMPETITIVE ADVANTAGE OF MANUFACTURING INDUSTRIES IN EAST JAVA‖
293
Brian Arieska Pranata, Ms. Tsuroyya, Wahdi. S. A. Yudhi, ―THE SOCIAL-CULTURAL AND ECONOMIC IMPLICATIONS OF THE PRESENCE OF MOBILE PHONES AMONG OVERSEAS MIGRANT WORKER FAMILIES IN KECOPOKAN HAMLET, EAST JAVA, INDONESIA‖
313
Lizar Alfansi, Ferry Tema Atmaja, Marthin Nanere, ―THE EXTRINSIC CUES EFFECTS ON PERCEIVED PRODUCT SAFETY‖
339
Roger C. Smith, ―APPLYING ATTRIBUTION THEORY TO
MANAGEMENT CONSULTING AND TO PERFORMANCE PROBLEMS – PEOPLE OR THE SYSTEM?‖
354
Victor Egan, ―AN EMPIRICAL STUDY OF THE CONTEMPORARY
LEGACY OF THE 1994 GENOCIDE ON BUSINESS IN RWANDA‖
364
Victor Egan, ―BUSINESS CONSTRAINTS AND RECESSIONARY EFFECTS
ON SMALL FIRMS IN VIETNAM: A CASE STUDY OF THE RETAIL CLOTHING INDUSTRY‖
Jiří Strouhal, Jiřina Bokšová, Dana Dvořáková, ―CHALLENGES FOR MEASUREMENT IN ACCOUNTING AFTER THE CRISIS‖
394
Prasanna.T, ―TOURISM: GLOBAL STATUS AND TRENDS‖ 407
Vivekanand B Khanapuri, Mayank R Khandelwal, ―BRIDGING THE GAP BETWEEN INSTITUTIONS OF HIGHER EDUCATION AND THE
INDUSTRY – EXPERIENCE OF A RECOGNIZED INDIAN INSTITUTE IN BRINGING STUDENTS AND INDUSTRY TOGETHER‖
420
Alexander Josiassen, Megan Willis, Jillian Hamill, Courtney Holmes, Luvna Munisamy, Nella Ortisi , Melissa Popovski, Albert Assaf, ―SOCIAL
NETWORKING SITES AND MARKETING OUTCOMES AN EMPIRICAL INVESTIGATION FROM AUSTRALIA‖
430
Earl Jobling, ―THE BANKING NEEDS OF SMES IN AUSTRALIA: WHAT DO THEY WANT, AND HOW CAN BANKS DELIVER?‖
439
Filda Rahmiati, Mulyaningrum, Md Nor Hayati Tahir, ―HOW εAδAYSIAN MANUFACTURING EXPORTS HAVE REACTED TO THE GLOBAL
ECONOεIC CRISIS‖
452
Guo, Yi Shan, Lina Huang, Lujin, ―SEεIOδOGY SNAδYSIS OF KFC‘S ADVERTISING IN CHINA THE VERIFICATION OF THE
DECiSION-εAKING εECHANISε, BASED ON CONSUεERS‘ SOCIAδ IDENTITY‖
464
Huang, Lujin, Shan, Lina, Wang, Yibo, ―RESEARCH OF THE
RELATIONSHIP BETWEEN CONSUMERS BEHAVIOR AND SELF-IDENTITY OF MIDDLE INCOME EARNERS IN CHINA: USING THE YANGTZE RIVER DELTA AS AN EXAMPLE‖
478
Philip D. Trebilcock, ―INDONESIAN STUDENT PERCEPTIONS OF AUSTRALIAN HIGHER EDUCATION‖
493
Julie B. Johnson, ―BUSINESS STRATEGIES ADAPTED FOR SOCIAL BENEFITS AMDIST THE ECONOMIC CRISIS‖
508
Michael Beacom, Marthin Nanere, ―THE IMPACT OF INTERNET TECHNOLOGIES AND E-BUSINESS APPLICATIONS ON TOURISM ENTERPRISES: A CASE STUDY FROM CENTRAL VICTORIA, AUSTRALIA‖
521
Abey Kuruvilla, Olakunle Ogunsanya, Dirk Baldwin, ―TRENDS IN ONδINE LEARNING – EXPERIENCES OF AN ACCREDITED BUSINESS SCHOOL
IN THE UNITED STATES‖
550
Malabika Deo, K. Srinivasan, ―EFFECTS OF RECENT GLOBAL MELTDOWN AND MARKET VOLATILITY IN INDIA: AN
ECONOMETRIC INVESTIGATION ON S&P CNX NIFTY SPOT AND FUTURES‖
Maryono, Jun-Yen Lee, ―CONSUMER PERCEPTION OF CORPORATE SOCIAL RESPONSIBILITY: A CROSS-CULTURAL COMPARISON IN INDONESIA AND TAIWAN‖
581
Hamed Armesh, Davoud Nikbin, Solmohammad Bastam, ―THE EFFECTS OF SECURITY AND PRIVACY INFORMATION ON TRUST &
TRUSTWORTHINESS AND LOYALTY IN ONLINE MARKETING IN MALAYSIA‖
595
Ali reza hedari, Noor Mohammad Yaghoobi, ―AN EVALUATION OF INDEPENDENT ENTREPRENEURSHIP OBSTACLES IN INDUSTRIAL SMES IN MALAYSIA - A CASE STUDY‖
610
Marthin Nanere, Lizar Alfansi, Ferry Tema Atmaja, ―ATTITUDES TOWARDS THE EFFECTS OF GREEN PRODUCTS ON THE ENVIRONMENT: AN INDONESIAN CASE STUDY‖
624
Siriporn Yenpiem, ―NAVIGATING PROCESS OF CHANGE TOWARDS NEW TECHNOLOGY FOR AVIATION‖
632
Roger J. Baran, ―WHO HAS THE POWER? A STUDY OF DECISION-MAKING INFLUENCE IN AMERICAN FAMILIES‖
THE DYNAMICS OF INDONESIA’S CRUDE PALM OIL EXPORT
Roberto Akyuwen
Senior Lecturer, Finance Training Center Jogjakarta, Ministry of Finance RI Jl. Solo Km 11, Kalasan, Sleman, Jogjakarta 55571, Indonesia
Telephone: 62-274-496219, Facsimile: 62-274-497235 Email: [email protected]
Arifin Indra Sulistyanto
Senior Managing Director, Indonesia Eximbank, Indonesia Stock Exchange Building Tower II, 8th Fl., SCBD
Jl. Jend. Sudirman Kav. 52-53 Jakarta 12190, Indonesia Telephone: 62-21-5154638, Facsimile: 62-21-5154639
Email: [email protected] ABSTRACT
Oil palm has played an important role in supporting Indonesia’s economy. The main product
of oil palm plantation is crude palm oil (CPO) and most of it has been exported to various countries. In 2006, total export volume of CPO reached 12.1 million tons with a value of US$ 4.82 billion. Since 2007, Indonesia has become the main CPO producer in the world,
replacing Malaysia. Total production of Indonesia’s CPO in 2007 was 16.8 million tons. This
research is aimed at analyzing the dynamics and factors affecting the performance of CPO export. The main tool of analysis is multiple regression by using 38 years of time series data. The other tools are descriptive statistics, tests of statistical significance between two means, and trends. It was found that government policies were not optimum in supporting the
performance of Indonesia’s CPO exports. For instance, the government was inconsistent in implementing an export tax and domestic market obligation (DMO) schemes and has made no specific effort to build infrastructure such as export ports and storage tanks which were vitally needed by CPO producers. Furthermore, the government of Indonesia was passive in responding to negative issues and black campaigns launched repeatedly in the international market. At the upstream level, there was no policy synergy between central and local governments in overcoming land certification and permission administration problems in palm oil plantations. The export financing was the most important factor which has a
significant and positive impact on Indonesia’s CPO export volume. The other factor was
Keywords: crude palm oil, production, exports, export financing, CPO price, black campaign, Sunflower, soybean oil prices.
BACKGROUND
Macroeconomics and international economics textbooks (Appleyard and Field, 1995; Dornbusch, et al. 2004; Krugman and Obstfeld, 2003; Mankiw, 2003; Markusen, et al., 1995) have revealed that inter-countries trading play important roles in today‘s open economy and the globalization era. Export and import activities have provided foreign reserves, investments, and employment opportunities for almost all countries in the world. Exports and imports have also influenced both domestic and foreign policies in many countries (Destler, 2005).
Export contribution is even more important for developing countries like Indonesia. Most of the developing countries are heavily dependent on primary commodities exports such as agriculture and mining (Todaro and Smith, 2003). These countries have limited capacity in advanced technology required to produce high value products. In fact, many developing countries have become only the assembling locations for various processing and manufacturing industries from developed countries in order to exploit the comparative advantages in abundant raw materials and cheap labor. In 1990-β006, Indonesia‘s export value was on average $ 53,321.26 million per annum with growth rate of 9.75 percent per annum. At the same time, average import value was $ 35,616.55 million per annum with an annual growth rate of 9.83 percent. Average net export was $ 17,704.71 million per annum with a growth rate of 18.11 percent per annum.
Many countries have made an effort to increase export capability and import substitution. According to Krugman (1994), a country should establish its international trade policy alternatives accurately by considering positive and negative consequences. Export promotion policy, in one hand, would encourage a country‘s foreign reserves and investments and create employment. But, on the other hand such a policy could accelerate natural resources depletion. Meanwhile, an import substitution policy could increase domestic industry performance, but some raw materials have to be imported. Destler (2005) pointed out that most countries focused on export promotion rather than import substitution. Developed countries have made serious efforts in expanding markets for their products, while less developed and developing countries focused on improving revenues to provide funds for supporting development activities, reducing budget deficits, and paying out foreign debts.
There are two groups of export commodities, i.e. natural oil and gas and non-oil and gas. Non-oil and gas exports contributions tend to increase, while the role of oil and gas exports tends to be stagnant or have lower growth (Jha, 1994; Todaro and Smith, 2003). These results also happened in Indonesia. The annual growth rate of Indonesia‘s non-oil and gas exports was on average 10.96 percent in 1990-2006. Data provided by the National Statistic Agency (BPS) show that non-oil and gas exports in 2006 reached $ 79,589.15 million. Meanwhile, oil and gas export grew by 6.88 percent per annum in the same period. In 2008, non-oil and gas export value was $ 107.8 billion and oil and gas export value was $ 28.96 billion.
practice, there was an excess supply of funding. The demand for funds from exporters was exceeded by its supply from financing institutions. Non-financial factors were related to government policies, such as regulations, protection, export quotas, and other trade barriers. In addition to that, internal industry factors related to production quality and quantity also influenced the performance of exports.
According to the International Finance Statistics (IFS), Indonesia was ranked 30th with a share of 0.83 percent of the total world export market. One of Indonesia‘s fastest growing export commodities was the crude palm oil (CPO). Export volume of CPO was on average 4.12 million tons in 1990-2006 with a growth rate of 22.97 percent per annum. Export volume of CPO reached 12.10 million tons in 2006, ten times higher if compared to export volume in 1990. Vast growing in export volume was followed by export value of CPO. In the
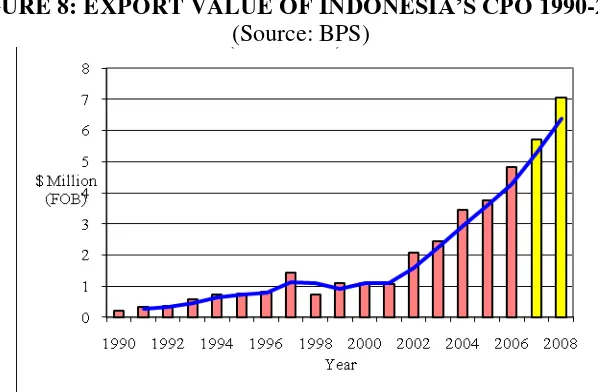
same period, annual export value of Indonesia‘s CPO grew by 27.13 percent. Export value in 2005 reached $ 4.82 billion or grew 28.24 percent compared with $ 3.76 billion in 2005. In 1990-2006, the average export value of Indonesia‘s CPO was $ 1.5β billion per annum.
The contribution of CPO‘s export value in Indonesia‘s total non-oil and gas exports tended to increase every year. In the period 1990-2006, the contribution of CPO exports was on average 4.17 percent per annum with the highest contribution of 6.15 percent of total
Indonesia‘s non-oil and gas exports in 2004. Although, there was a decrease to 5.66 percent
in β005, however, overall, there was a significant contribution of CPO‘s export value, that is
about 5 times within 17 years. These facts show the importance of CPO role in Indonesia‘s
economy and the role could be even greater in the years to come.
The main destination was India with the export volume reached 2.48 million tons or 20.51 percent of the total Indonesia‘s CPO exports (BPS, β007). CPO‘s export volume to India decreased about 2.98 percent if compared to the export volume in 2005. The decrease was caused by the dynamics of vegetable oils demand, population growth, and the world economic condition. Besides, there was a minimum standard of -carotene and a higher import tax policy on CPO imposed by the government of India. The second important
importer of Indonesia‘s CPO was the European Union with the share of β0.6 percent or equal
to 931.000 tons in 2005. Import volume of the EU increased by 19 percent from 2004 and this was caused by the increased usage of palm oil in foods. Palm oil was used more intensively by Europeans to substitute rapeseeds oil which has been used increasingly for biodiesel or bio-fuel. The other important countries included China, Ceylon, and Tanzania.
As an exporter country, Indonesia is competing with Malaysia, Nigeria, Thailand, Colombia, Ecuador, and the Ivory Coast. Malaysia was in the first place until 2005 with a total CPO production of 15.38 million tons or 45.24 percent of total world CPO production. Indonesia was in ranking two with total production of 13.80 million tons or 41.20 percent.
But, the growth rate of Indonesia‘s CPO production is significantly higher than εalaysia, i.e.
14.72 percent compared to 6.06 percent per annum, respectively. So, since 2007, Indonesia has replaced Malaysia as the biggest CPO producer in the world.
increased substantially. Liquidity problems were faced by many financial institutions, such as the bankruptcy of Lehman Brothers in 2008.
The level of consumption and imports of developed countries decreased substantially, including the consumption and imports of CPO products from developing countries. More than half of foods and non-foods packaged products in the supermarkets now contain CPO and its derivatives (Chandran, 2009). As the main producer in the world, Indonesia was influenced by the decrease of CPO demand and price. The negative impacts not only hit CPO industries and exporters, but farmers as well. In November 2008, the price of a stem of fresh palm oil (TBS) decreased to 350 rupiahs per kg. In the normal situation, the price of TBS at the farmer level was between 1,400 rupiahs to 1,600 rupiahs per kg.
CPO demand and price decreased from mid 2008 to May 2009 and then recovered. According to the Indonesian Exporter Association, CPO export volume in January 2009 reached 1.4 million tons with destination countries including India, China, and EU. In addition, according to the Indonesian Palm Oil Business Federation (GAPKI), CPO price was already stable at the beginning of 2009. Negative impacts also caused by higher dependency of Indonesia CPO industry on the world market, while domestic consumption was only limited. About 70-75 percent of Indonesia‘s CPO production was exported to China, India, and Europe (Kompas, 4 April 2009).
The Indonesia CPO producer‘s capacities were supported by abundant production
factors. Palm oil plantations were spread in various regions in Indonesia, especially in Sumatra, Java, Kalimantan, and the Papua islands. Besides, there were also potential lands for expansion by more than 50 million hectares. Workers were also available, because various jobs in palm oil plantation only required lower skills of workers. In 2003, the largest palm oil plantation was found in Riau Province, i.e. 1.38 million hectares, followed by North Sumatra Province 0.96 hectares, and South Sumatra Province 0.53 hectares.
In 2006, there were 470 palm oil factories spread in 17 provinces with a total installed capacity of 19,852 tons of TBS per hour. The majority of palm oil factories were located in Riau Province (128 units), North Sumatra Province (105 units), and South Sumatra (53 units). Effective capacity of those 470 palm oil factories was about 68 percent or 13,541 tons of TBS per hour (Directorate General of Plantation, 2006). However, until recently, these CPO industries did not have comparative advantage and were not competitive yet. Indonesia‘s CPO trading in world market was very often hampered by negative campaigns (Oil & Fats Internatonal, Dmg World Media, 2008).
The development of the CPO industry is influenced by the availability of investment funds and other factors. Sources of funds include banks and non-bank institutions, such as individual businesses or the stock exchange. Sufficient funding was also needed by CPO exporters and this increases every year following the demand. Actually, there were many palm oil downstream industries in Indonesia which have great prospects, including, cooking oil and oleo chemicals, i.e. fatty acid, fatty alcohol, stearin, glycerin, and metallic soap.
The CPO export development is strategic, because it could create employment, increase
economic growth, and improve people‘s welfare. By that, factors which are affecting the performance of CPO exports should be identified in order to determine appropriate efforts to encourage CPO exports in the future. Various related government policies and issues have also been analyzed.
LITERATURE REVIEW
Greenaway has observed related empirical issues and policies on regional and inter-industry trade arrangement in the period of 1974-1985. Research objects included the Central American Market (CACM), Latin American Free Trade Area (LAFTA), and European Community (EU). Based on econometric analysis it was found that the dominant factors in regional and inter-industry trade included strategy interventions, economic scale, and protection of neo-infant industries (Greenaway et al., 1989).
Scott (King, 1990) examined the efforts to create comparative advantages in international trade. Although many of Ricardo‘s arguments (1817) are still relevant, nevertheless, a dynamic coparative advantage theory is needed. For instance, the Japanese Model has created an appropriate comparative advantage strategy.
Poot et al. (1991) has analyzed the trade and industrialization in Indonesia in the decades of 1970s and 1980s by focusing on manufactures and small scale industry exports. The research was conducted to understand the relationship between industrialization and exports and economic growth and development. Several important issues included structural changes, regional distribution, trade orientation, relationships among manufacturing industries, differences between large and small industries, investments and utilization of medium and large industries‘ capacity, intensity of utilization of factors of production, and implications on employment creation and manufacturing development.
Lanjouw (1995) has reviewed international trade institutions including the General Agreement on Tariffs and Trade (GATT), World Trade Organization (WTO), United Nations Conference on Trade and Development (UNCTAD), and the Organization for Economic Co-operation and Development (OECD). Subjects reviewed included the role of those
organizations, international commodity trade, and regional economic integration. δanjouw‘s
idea was basically in line with Destler (2005) although he focused on trade policy of the United States of America (USA).
Several researchers have examined the impact of various variables on CPO production, price, and exports. Setyowaty (1994) has analyzed factors influencing the demand of
Indonesia‘s CPO exports to various countries by using multiple regression. Based on quality,
the Indonesia‘s CPO was found to be inferior when exported to developed countries, especially USA and Japan.
The other researchers such as Talib and Darawi (2002) have examined Malaysia‘s CPO market which was influenced by planted area, domestic consumption, exports, and imports, besides the CPO stock and price, production technology, and soybean oil price. Amiruddin (2003) has made a comparison between Malaysia and Indonesia in the context of CPO exports and prices by using an export tax indicator. In addition , Afifuddin (2004) has found that the CPO export price, exchange rate, and soybean oil price all have significant impacts on CPO exports. However, he found that the impact on export prices was negative.
Purba (1999) used an econometric model in simulating the impact of internal and external policies on CPO performance. The world and domestic prices of CPO were having positive impacts on the productivity of small scale plantation, while medium and large scale plantations were more responsive only to the world CPO price. Besides, the increase of production has a positive impact on the increase of CPO exports. Indonesia‘s CPO exports were influenced by world CPO price and exchange rate of the rupiah and the dollar.
Drajat (2001) has evaluated the performance of the plantation sector in 1994-1998 and its prospects in a free trade era in 2003-2008 by using ordinary least squares (OLS) and two stages least squares (TSLS). The reduction of value added tax could increase the performance of plantations, while the free trade area has had a negative impact. The depreciation of the rupiah against the dollars has had a positive impact and this determined the performance of plantations. However, the increase of labor wages has had a negative impact. The other finding was that the increase of fertilizer price has had a negative but limited impact on the performance of plantation exports.
Hasan et al. (2001) has analyzed the impacts of an export tax on competitive ability of Indonesia‘s CPO industry by using vector autoregressive. It was found that CPO exports have drastically decreased by the tax imposition, because of lowering the competitive ability. More than 83 percent of forecasting errors were explained by export shock itself, while only 8.6 percent and 8.4 percent were described by the export tax and export price, respectively.
Basiron (2002) has studied the prospects of global supply and demand of CPO industries in Malaysia and Indonesia. CPO has played a positive role in the supply and demand of world vegetable and fat oils. The positive role was supported by technological and economic advantages. There were various challenges in the world CPO markets including a self-sufficientcy policy in developing countries, subsidies in developed countries, establishment of trade quality standards, non-tariff barriers, and exchange rate effects.
Tambunan (Santosa, β00β) has analyzed the performance of Indonesia‘s trade in the
period of the crisis. The export commodities which have been analyzed included shoes, textiles, electronics, wood products, and automotive components. The supply side should be improved in order to increase the competitive ability of Indonesia including production capacity, technology, human resources, entrepreneurship, stock and quality of raw materials, government policies, distribution system, promotion, infrastructures, institutions, financing, supporting industries, and services. Without significant improvements, it is difficult for Indonesia in facing competition in a free trade area.
Kamaludin (Santosa et al., 2002) has studied instability in the foreign trade of Indonesia in the period of 1980-1997. An open economy policy is highly dependent on economic and trade relationships among countries. Trade instability was defined as trade fluctuations. The
Instability index of Indonesia‘s primary goods export value was relatively high, but
index was found in export value to Canada followed by Japan, USA, and Hongkong. Meanwhile, the highest instability index for export volume was found in Canada.
Kusumastuti (Santosa et al., 2002) has observed the interdependency of Indonesia‘s
economy on ASEAN‘s exports and imports. A simultaneous equation was used to analyze the
data in the period of 1969-1996. It was found that no significant relationship existed between exports to ASEAN countries and the increase of Indonesia‘s national income. Exports to ASEAN countries did not provide spread and a spill-over effect to other sectors of
Indonesia‘s economy. Indonesia‘s exports were influenced by price fluctuations and some
export commodities were agricultural products which only have a low elasticity if income. The feedback effects were found only in export to Singapore.
Santosa (Santosa et al., 2002) has analyzed the performance of Indonesia‘s non-oil and gas export to the Netherlands, England, and Germany in 1983-1995. A gravitation model was
used as a tool of analysis. The Indonesia‘s export value to those three countries was
influenced simultaneously by Indonesia‘s national income, per capita income of the three countries, commodity price, and exchange rates.
Sumiyarti (Santosa et al., 2002) has studied the relationship between exports and economic growth. The analysis was undertaken based on the expansion of the Cobb-Douglas production function and supply and demand of exports. The economic growth was only
influenced by capital stock. Japan‘s demand of Indonesia‘s products was determined by national income and a ratio between export and domestic prices. Similar phenomenon was also found in the case of exports to the USA.
Talib and Darawi (2002) have examined the CPO market in Malaysia by using an economic approach. Variables used in the model included plantation area, domestic consumption, exports, and imports, while tools of analyses were OLS and 2SLS. The
research found that εalaysia‘s economic activities, exchange rate, and world population were important factors in influencing the performance of the CPO industry. In addition to that, there were also other factors including the CPO stock and price, production technology progress, and soybean oil price.
Tan (Santosa et al., 2002) has analyzed factors affecting exports of manufactured products in the period of 1983-1997. A simultaneous model of estimation was derived from
supply and demand of manufactured export equations. The performance of Indonesia‘s
manufactured exports was influenced positively and significantly by export price, production capacity, exchange rate, and deregulation policy. On the contrary, domestic price had no impact on manufacture export.
Amiruddin (2003) compared exports and prices of CPO products between Malaysia and Indonesia. The two countries are the biggest CPO exporters in the world. Total CPO production of Malaysia and Indonesia, including CPO and processed palm oil (PPO), have reached 83.5 percent with a market share of 89.6 percent of total CPO in the world market. There were differences in the payment of export taxes between the two countries. Malaysia has imposed a higher export tax on CPO compared to Indonesia, but did not impose an export tax on PPO. In the meantime, Indonesia has imposed a relatively low rate of export tax on PPO.
support in credit channeling, especially for community plantations. Besides, the CPO industry has to expand its market share.
Afiduddin (2004) has studied the impact of CPO market on palm oil plantation in North Sumatra by using a regression and structural equation model (SEM). There was no impact of domestic CPO demand on palm oil plantation, because most producers were export-oriented. The CPO export quotas and exchange rate have positive and significant impacts on palm oil plantation. However, the domestic production and export quota of cooking oil have positive and significant impact on domestic CPO demand. In addition to that, CPO export price, exchange rate, and world soybean oil price have significant impacts on CPO export.
Zen et al. (2006) has analyzed CPO contribution in improving the social and economic conditions in Indonesia. The government has used CPO as a social and economic development tool in rural areas through community plantations. More than 900.000 hectares of palm oil plantations have been managed and provide income for more than 500.000 farmers. However, the land conversion problems still existed.
Kusuma (2006) has observed the impact of CPO on regional development in North Sumatra. The research was focused on domestic demand, export, domestic price, and CPO export price. The export market and price and domestic price have a significant impact on either plantation areas or CPO production. However, domestic price only has a significant impact on CPO production. Market structure of CPO in North Sumatra was oligopsony. The market was dominated by the integrated wholesaler groups.
In the same province, Ginting (2006) has analyzed the impact of CPO‘s downstream industry on regional development. The raw materials have a positive and significant impact on the production capacity of CPO downstream industry. Meanwhile, investments and labor costs have no impact. Nevertheless, the investments have significant impact on regional development. On the contrary, the CPO downstream industry has no impact on regional development.
Erningpraja and Kurniawan (2007) have examined factors affecting the respective price of palm oil. The respective price of CPO in 2007 was approximately $ 489.35 per ton CIF Europe, an increase of $ 11.02 per ton CIF Europe in 2006. The respective price of CPO was calculated based on a ratio of CPO and vegetable oils. CPO price tended to increase in 2008-2010, i.e. $ 522.97 per ton, $ 562.46 per ton, and $ 606.76 per ton CIF Europe, respectively.
PT. Capricorn Indonesia Consultant, Inc. (2007) has studied the investment prospects of palm oil industry in Indonesia. The role of CPO has become stronger in the world market and is able to replace the role of other vegetable oils. The price of CPO is constantly increasing in the world market. The increase was not only influenced by the increased demand for the cooking oil industry and the like, but also by the increased demand of other industries, such as biofuels. CPO has become one of the most important and prospective commodities for Indonesia in the future.
If compared to previous research, this research is more comprehensive. The analysis is started by describing plantation development in Indonesia. Analysis is then continued by the progress of production and consumption of Indonsia‘s CPO in world and domestic markets.
The performance and role of CPO exports in the Indonesia‘s economy are the next subjects. The performance of Indonesia‘s CPO export is represented by CPO export volume. Factors influencing the performance of Indonesia‘s CPO exports are derived from Setyowati (1994),
Purba (1999), Talib and Darawi (2002), Tan (Santosa et al., 2002), and Afifuddin (2004). The government policy is also included in the time-series model and represented by an export tax. The impact of the export tax on CPO export performance has already been studied by Hasan et al. (2001), Amiruddin (2003), and Ernawati (2007). The estimation model is finally completed by adding export financing and the negative campaign about environmental issues
in the CPO‘s trade in the international market.
INTERNATIONAL TRADE THEORY
International or trade economics could be categorized as classical trade theory, neoclassical, and alternative theory (Appleyard and Field, Jr., 1995). The classical trade theory was built on the mercantilism era and was developed into comparative advantage theory by David Ricardo. Topics discussed included Ricardian comparative advantage, export concentration, trade and income, resource limitation and specialization, production-possibilities frontiers, wages and exchange rates, commodity variation, transportation cost, labor productivity, and market penetration. The basic idea of classical trade theory was developed further by F. Y. Edgeworth, Eli Heckscher, and Bertil Ohlin. Edgeworth box diagram was used to analyze consumer behaviors and production equilibrium. Meanwhile, Heckscher-Ohlin Theorem discussed the natural resources abundant as a factor of production. The main ideas in neoclassical trade theory also included consumption and production benefits, minimum requirements and assumptions, and relationship between distribution and trade performance.
Various models were developed to adopt the dynamics of inter-industry trade among countries. An alternative theoy is developed by Michael V. Posner (1961) with the Imitation Lag Hypothesis and Raymon Vernon (1966) with the Product Cycle Theory. In 1960s, there were the Linder Theory developed by Staffen Burenstam Lindar (1961) which analyzes product age and industry characteristics, and the Kemp Model from Murray C. Kemp (1964) which is based on the economies of scale. With the increase of economic activities in 1970s, Paul Krugman (1979) developed a Krugman Model which is characterized by the economies of scale and monopolistic competition. Meanwhile, to explain inter-industry trade there is the Falvey Model developed by Rodney Falvey (1981) which is a development of the Heckscher-Ohlin Theorem.
TABLE 1. THE IMPACTS OF INTERNATIONAL POLICY ALTERNATIVES
Effects Tariff Export Subsidy Import Quota Voluntary Export Restraint Producer surplus Increses Increases Increases Increases
Consumer surplus Falls Falls Falls Falls
The efforts undertaken to increase the performance of exports are complex include import tariffs, relative demand supply effect on tariffs, impact of export subsidies, economic growth, and income distribution (Krugman and Obstfeld, 2003). According to Appleyard and Field, Jr. (1995), potential factors which have impact on exports in the long run are income elasticity of demand, unequal market forces, technology progress, and the role of multinational companies (transfer pricing). The government produces relevant policies which influence producer and consumer surplus, government revenue, and people‘s welfare. The sources of trade problems among countries include price instability and demand and supply of export commodities (Appleyard and Field, Jr., 1995).
PRICE FORMULATION
An investor should understand CPO price behavior, competitors, and interconnection between the world CPO price and the TBS price. The CPO price has a 5-6 years cycle, minor upward trend, and a seasonal cycle. Although it fluctuates, the middle value of CPO price is approximately $ 430 per ton cif Rotterdam. At international price, the selling price of CPO at plantation is approximately 2,800 rupiahs per kg and TBS price is approximately 530 rupiahs per kg. One cycle consists of one main peak (18-25 months) and several minor peaks. The frequency of CPO price lower than $ 403 per ton is approximately 65 percent. The seasonal price has one peak in December-January and two niches, i.e. a minor niche in April-May and a major niche in July-August (Buana and Dja‘far, β00γ).
In the world market, CPO is competing with other vegetable oils, especially soybean and rapeseed oils. The fluctuation in production or demand of one vegetable oil will influence the price of others. Vegetable oils are used for food and non-food products. The demand for food products is determined by the number of population, per capita consumption, and purchasing power of consumers. The level of consumption will be higher in developed countries. Buana (2001) has found that the maximum per capita consumption of vegetable and animal oils is different from one ethnic region to another. The health issues also encourage the reduction of animal fats consumption. Meanwhile, the demand of vegetable oils for non-food products is determined by environmental issues, energy consumption, and technology.
The domestic consumption of CPO in Indonesia is highly influenced by the consumption of cooking oil. The government is very keen to control cooking oil trading in order to maintain sufficient supply and an achievable price. The contribution of CPO in cooking oil production is as high as 80 percent, so the domestic supply of cooking oil is highly depend on the supply of CPO. The production volume of CPO in 2002 was 9 million tons, far above domestic consumption, that is only 3.5 million tons. The government control is undertaken through export tax and quota.
At an exchange rate of 8,500 rupiahs per 1 dollar, the price of CPO is $ 590 per ton cif Rotterdam and the price of cooking oil is 5,000 rupiahs per kg. When the exchange rate, for instance, reaches 15,000 rupiahs per 1 dollar as in 1998, the price of CPOl becomes $ 630 per ton cif Rotterdam, and an export rush will take place. The price of cooking oil industries is expected to reach 8,500-9,000 rupiahs per kg. In order to reduce the price to 4,000 rupiahs per kg, the government should impose an export tax of 60 percent of FOB value, so that the CPO price at the port tanks will be $ 230 per ton. The lower domestic price will encourage the producers to export the CPO (Buana dan Dja‘far, β00γ: β9).
SUSTAINABLE PALM OIL INDUSTRY
The sustainable palm oil industry is a solution for consumers who are demanding a green production supply chain of CPO (environmental issue and natural biodiversity). The initiative for a sustainable palm oil is referred to the guideline produced by the Sustainable Agriculture Network (SAN), Forest Stewardship Council (FSC), International Standard Organization (ISO) 14001 EMS, MPOA Environmental Charter, εigros Criteria, Unilever‘s
Sustainable Palm Oil Guidelines, and others (Dja‘far et al., β005). Recently, the principles
and criteria of suatainable palm oil industry have been adopted from the Roundtable on Sustainable Palm Oil (RSPO).
The RSPO is developed under an informal cooperation which is initiated by the World Wildlife Fund (WWF), Golden Hope, Migros, MPOA, Sainsbury, and Unilever. The initial meeting was conducted in London on 20 September 2002. The first formal meeting was conducted in Kuala Lumpur on 21-22 August 2003 and produced a sustainable CPO concept.
The RSPO was then declared on 8 April 2004 and registered under Article 60 of the Swiss Civil Code. The RSPO is a non-profit association with members consisting of organizations in and surrounding the supply chain of CPO. The second meeting of RSPO was conducted on 5-6 October 2004 in Jakarta. The Principle and Criteria for Sustainable Palm Oil was produced in this meeting. The third RSPO meeting was conducted in Singapore on 21-22 November 2005 and attended by more than 300 participants from 28 countries. The third meeting was also attended by the representative of certification agencies, press, researchers, and environmental and social activists. The topics discussed in the meeting were focused on the principles and criteria as references in producing CPO ant its derivatives. The RSPO guideline consists of 8 principles and 39 criteria which are to be implemented within two years of the probation period since 2006 and are subject to review.
METHODOLOGY
Data
The main data used include export volume and value of Indonesia‘s CPO, CPO export volume and value by destination countries, CPO export financing, CPO export and domestic prices, CPO production, CPO domestic consumption, other vegetable oils prices and consumption in the world market, world crude oil price, exchange rate of rupiah and dollar,
per capita GDP of the main destination countries of Indonesia‘s CPO exports, related government regulations, and negative campaigns. These data were collected from the publications of both international and national institutions including the National Statistic Agency (BPS), Indonesia Eximbank, Ministry of Industry, Ministry of Trade, and Ministry of Agriculture.
Analysis
Quantitative techniques were used in analyzing the data, i.e. descriptive statistics, trends, and econometrics (test of statistics between two means and multiple regressions). The descriptive statistics were used to describe the fluctuations of CPO exports and factors affecting it. A moving average trend was used to understand data movement and tendencies and to make a forecast. The test of statistics between two means was implemented to compare the productivity of CPO production between Indonesia and Malaysia. This tool was also
utilized to compare the performance of Indonesia‘s CPO exports between periods. The CPO producers in Malaysia are assumed to have higher productivity than CPO producers in Indonesia.
Multiple regressions were used to test the impact of various variables on the
performance of Indonesia‘s CPO exports. For this purpose, an econometric model was built with reference to Gujarati (1995, 2006), Pindyck dan Rubinfeld (1998), Thomas (1993,
(thousands ton), x5t exchange rate (rupiahs per 1 dollar), x6t per capita gross domestic product (GDP) of India (dollar), x7t per capita GDP of the Netherlands (dollar), x8t per capita GDP of Malaysia (dollar), x9t per capita GDP of China (dollar), x10t CPO financing in Indonesia (billion rupiahs), x11t deregulation policy (dummy variable), x12t
world crude oil price (dollar per barrel), x13t other vegetable oils price in the world market (dollar per ton), x14t negative campaign (dummy variable), s 0, 1, 2, γ, …, time lag, and
According to the Bogor Research Center for Land and Agroclimate, total potential land for palm oil plantations in Indonesia is approximately 31.8 million hectares in 2006. The land potential is mainly located in Sumatra island (38.65 percent), Kalimantan island (38.42 percent), and Papua island (20.09 percent). In addition to that, there is also potential land for palm oil plantation in Sulawesi island (1.85 percent) and Java island (0.99 percent). In 2006, the largest plantation was found in Riau Province, that is 1,383,477 hectares, followed by North Sumatra Province (964,257 hectares). The other provinces with significant land area of palm oil plantation are South Sumatra (532,365 hectares), West Kalimantan (466,901 hectares), and Jambi (466,709 hectares).
The growth of palm oil plantation area is very fast in the period of 2000-2005, that is 20.5 percent per annum. This growth rate is faster than the previous period of 1990-1997. In 2000, the total area of palm oil plantation was 4.2 million hectares. The area was then increased to 6.07 mullion hectares in 2006.
If compared to the other CPO producer countries, Indonesia has had comparative advantages, such as abundant area and fertile lands and suitable geographical conditions. Although, there are other factors which affect the growth and productivity of palm oil plants including technical aspects of agronomy (Risza, 1994).
TABLE 2. COMPARATIVE ADVANTAGES OF CPO PRODUCERS
No. Country
According to Pahan (2007), the most appropriate strategy used often by CPO producers to increase their market share is low cost leadership. Palm oil plants are perennial crops which have vegetated growth periods at the beginning, so the investments are categorized as long term investments. In approximately 30-36 months, the expenses are only for cultivation activites. The break even point will be reached on average within 9 years (Pahan, 2007). Based on that condition, the palm oil business requires an economic scale of a minimum of 6,000 hectares together with processing capacity of a factory, number of workers, and transportation costs.
The product of palm oil at the plantation level is TBS (the stem of the fresh palm oil bunch). The TBS is processed to produce intermediate product, i.e. crude palm oil (CPO) and palm kernel oil (PKO). Both CPO and PKO can be further processed to produce various products. The TBS contains about 2 percent of free fatty acid (FFA) when harvested and this continues to increase. A high level of FFA will reduce the CPO quality and price. The maximum tolerance for CPO standard export is 5 percent. For this reason, the TBS should not be stored more than 24 hours in the field.
Productivity of TBS will increase sharply once the age of palm oil plants has reached 3-7 years which is known as the young plant period. Maximum production will be reached at 15 years which is called the prime age period. Then, the production will decline as the plants become old and replanting is required.
The capacity of a processing factory is determined by the productivity of palm oil plants. In the peak of production, total TBS produced will reach 10-13 percent of the whole year‘s production. The CPO and PKO extracts are unique every day and influenced by the quality of TBS, the performance of machines, and synchronization among processing units. According to Pahan (2007), there are 3 types of palm oil factories. They are (1) Mini mill
with total processing capacity of 5 tons of TBS per hour; (2) Regular mill with total processing capacity of 30, 45, 60, and 90 tons TBS per hour; and (3) Interim line mill with total processing capacity of 30 tons of TBS per hour.
Various final products of CPO include cooking oil, margarine, dry oil for snacks and fast foods, shortening, non-dairy creamers, and ice cream. The nutrient contain of CPO is very good for human consumption including calories, vitamins, digestion, essential and free fatty acids, and low cholesterol. CPO contains low cholesterol, i.e. 3 mg per kg. This amount of cholesterol is similar to the other vegetable oils but is much lower than in animal oils. For example, there is 220 mg of cholesterol per kg butter produced from animal oil.
According to the Oil World, the use of CPO for food products competes with soybean oil (Pahan, 2007). Apart from that, the use of CPO for non-food products is competing with fatty acid produced from cow fat (tallow). However, total consumption of CPO and PKO in the world market are increasing rapidly every year. In 2003, total consumption of CPO and PKO was 19.13 percent of total world oil consumption. In 2005, total consumption of CPO and PKO increased to 23.53 percent of total world oil consumption. Animal oils production tended to decrease.
In 2008, Indonesia becamethe biggest CPO producer in the world replacing Malaysia. This fact had been predicted by Pahan (β007). Total production of Indonesia‘s CPO in β005 was 12.6 million tons or equal to 38.77 percent of total production of CPO in the world (32.5 million tons) and increasing rapidly.
Indonesia has a tropical climate which is appropriate for palm oil plants. Indonesia‘s
Cameroon, Zaire, Ivory Coast, Kenya, and Ghana. Meanwhile, in the context of the plantation area, the potential land for palm oil plantation in Indonesia is larger than in Malaysia, but competes with Brazil, Colombia, Papua New Guinea, and Cameroon.
The availability of labor is an important requirement in optimizing CPO production. Palm oil plantations are labor intensive activities which require a lot of labor. Besides, labor skills and wages are the other factors which determinethe comparative advantages of palm oil producers. If compared to the other countries, Indonesia, India, Cameroon, Zaire, and Ghana are classified as the countries with superior labors for palm oil plantations (FAO Country Tables 1992).
TABLE 3. COMPARISSON OF COMPARATIVE ADVANTAGE ON LABORS BETWEEN PALM OIL PRODUCERS
Source: FAO Country Tables 1992 (Pahan, 2007).
Government support is essential to create a conducive climate for upstream and downstream palm oil industries. For instance, since 1980s, the Government of Indonesia has provided opportunities for cooking oil factories to have their own palm oil plantations in order to secure raw material supplies. In addition to that, the Ministry of Agriculture has established palm oil as one of the strategic agriculture commodities.
The government efforts on palm oil industries are facilitated by the provision of soft loans from the Bank of Indonesia to both national private plantations and community plantations. Besides, the banks also provide working capital and investment credits for national palm oil industries. The plantation area and CPO and PKO production have increased vastly and also the domestic and foreign trading of CPO and PKO.
The other factor which influences CPO production is environmental movements. Actions and campaigns are mostly related to the land clearing for the new palm oil plantation and expansion of the area. These activities very often impede the activities of palm oil industries. To overcome such kinds of problems, palm oil producers have undertake positive action by establishing principles and criteria as guidelines for palm oil industries which consider sustainable development. The efforts of palm oil producers are recognized as the Roundtable Sustainable Palm Oil (RSPO).
With different kinds of effort, world CPO supply is increase rapidly following the increase in demand. In 1987-2007, world CPO production had increased from 7,743,000 tons to 38,163,000 tons (World Oil) or an increase of γ9β.87 percent. εalaysia‘s CPO production
was increased from 4,5γγ,000 tons to 15,740,000 tons, while Indonesia‘s CPO production
equal to 44.02 percent of total world CPO production in 2007, while Malaysia contributes 41.24 percent.
The CPO production in Indonesia grew more than 10 times or 1,117.39 percent in the period of 1987-2007. The increase of CPO production is supported by the vast increase of plantation area and productivity. The plantation area has increased from 425,000 hectares in 1987 to 4,540,000 hectares in 2007. Meanwhile, the productivity has also increased from 3.25 tons per hectare to 3.70 tons per hectare in the same period. However, the productivity of palm oil plants in Indonesia is consistently lower than in other countries. Productivity of palm oil plants in Malaysia is 4.15 tons per hectare and in Colombia is 3.90 tons per hectare.
TABLE 4. PRODUCTION, PLANTATION AREA, AND PRODUCTIVITY OF WORLD PALM OIL IN 1987 AND 2007
Total production of Indonesia‘s CPO is 1γ.γ9 million ton in β006 with a total plantation
area of 6.07 million hectares. The CPO/TBS ratio is relatively low, i.e. 22.21 percent. As a comparison, total plantation area in Malaysia in 2006 is only 3 million hectares, but is able to produce CPO as much as 15 milion tons. To increase the productivity, Indonesia‘s CPO producers have significantly increased the CPO/TBS ratio and also improved post harvets management.
The role of large scale private and community plantations in producing CPO have increased in Indonesia. On the other hand, the contribution of state-owned plantations was stagnant. Total CPO production of private and community plantations have increased five times in 2006 if compared to 1995. Total CPO production of private plantations alone have increased from 1.9 million tons in 1995 to 6.3 million tons in 2006. Meanwhile, total production of community plantations have also increased from 1 million tons to 5.1 million tons in the same period. Total CPO production of state-owned plantations were only slightly increased from 1.6 million tons in 1995 to 1.9 million tons in 2006.
TABLE 5. INDONESIA’S CPO PRODUCTION IN 1990-2006
Year Plantation (ha) TBS Production (ton) CPO Production (ton) CPO/TBS Ratio (%)
1990 1,126,677 11,488,629 2,412,612 21.00
1991 1,310,996 12,530,568 2,657,600 21.21
1992 1,467,470 14,646,861 3,266,250 22.30
1993 1,613,187 16,937,866 3,421,449 20.20
1994 1,804,149 18,995,555 4,008,062 21.10
1995 2,024,986 21,031,315 4,479,670 21.30
1996 2,249,514 23,106,877 4,898,658 21.20
1998 2,788,783 27,116,125 5,640,154 20.80
1999 3,172,163 29,292,190 6,004,899 20.50
2000 3,769,609 37,527,233 7,580,501 20.20
2001 3,974,337 39,646,224 7,968,891 20.10
2002 4,116,646 40,183,207 9,024,000 22.46
2003 4,819,867 48,921,650 10,958,450 22.40
2004 5,675,430 58,519,359 12,991,298 22.20
2005 6,125,430 56,782,736 13,173,595 22.20
2006 6,074,926 61,739,473 13,390,807 22.21
Source: Ministry of Agriculture Republic Indonesia and GAPKI.
CPO Export and Import
Indonesia is the main competitor for Malaysia in the world CPO market. The growth
rate of Indonesia‘s CPO export is on average β8.7 percent per annum in 1996-2006. Total
export volume of Indonesia‘s CPO has increased from 1.7 million tons in 1996 to 11.1
million tons in 2006. In the same period, the export value has also increased substantially from $ 825.4 million to $ 4.3 billion.
TABLE 6. INDONESIA’S CPO AND PKO EXPORT VOLUME AND VALUE IN 1996-2006
Year CPO PKO
Volume (ton) Value ($ 000) Volume (ton) Value ($ 000)
1996 1,671,957 825,415 341,318 235,168
1997 2,967,589 1,446,100 502,979 294,255
1998 1,479,278 745,277 347,009 195,447
1999 3,298,986 1,114,242 597,842 347,975
2000 4,110,044 1,087,291 578,824 239,120
2001 4,903,218 1,080,906 581,926 146,259
2002 6,333,708 2,092,404 738,416 256,234
2003 6,386,410 2,454,626 659,894 264,678
2004 8,661,647 3,441,776 904,327 502,681
2005 10,376,190 3,756,284 1,043,196 587,746
2006 11,100,120 4,255,797 1,152,813 562,283
Source: National Statistic Agency (BPS).
There are several main importers of Indonesia‘s CPO include the Netherlands, Malaysia, India, China, Spain, Germany, USA, Italia, Singapore, and Turkey. In addition to that, there are other potential countries for export expansion such as Egypt, Kenya, Greece, Pakistan, Bangladesh, Brazil, England, Myanmar, Saudi Arabia, Canada, and Australia. In the future, Indonesia should expand its CPO export markets to reduce demand dependency on certain countries.
The most important importer is India with the share of 42 percent of total Indonesia‘s CPO exports in 2005. The EU is the second largest importer with the proportion of 20.6 percent. However, the highest growth of imports is found in China, Ceylon, and Tanzania. In 2005, CPO export volume to China had reached 511,000 tons or increased by 41.55 percent from the previous export volume. India and China are very important importers because both countries are having large populations.
TABLE 7. MAIN DESTINATION OF INDONESIA’S CPO EXPORT IN 2003-2005
No. Country Year (000 ton)
1. India 1,533 1,746 1,905
2. European Union 617 791 931
3. China 298 361 511
4. Malaysia 321 493 344
5. Ceylon - 13 202
6. Tanzania - 45 128
7. Others 313 528 502
Source:Oil World Monthly 2005.
Indonesia also imports some CPO and PKO to meet domestic demand. Import volume and value of the two products tended to decrease in the period of 1996-2006. In 1990, Indonesia imported 26,183 tons of CPO with an import value of $ 7.7 million. Import volume then increased to 49,785 tons with a value of $ 48.1 million in 1995. However, in 2005, import volume of CPO decreased to only 3,775 tons with an import value of $ 915,000. In 2006, import volume of CPO increased again to 10,975 tons with an import value of $ 1.7 million.
FIGURE 2: EXPORTS AND IMPORTS OF INDONESIA’S CPO IN 1995-2006 (Source: PT. Capricorn Indonesia Consultant Inc.)
The equilibrium of CPO exports and imports is determined by CPO price in the world market. The CPO price has always fluctuated and tend to increase, especially in 2007. The average CPO price in the world market in 1986 was approximately $ 257 per ton and increased significantly to $742 per ton in 2007. Meanwhile, the lowest CPO price in the period of 1986-2007 occurred in 2001.
CPO Domestic Consumption
Indonesia is one of the most populated countries in the world. So, Indonesia has potential as a market for CPO products. Most of the domestic CPO has been absorbed by the cooking oil industry. In addition, some quantities of CPO products are used by olechemical and biodiesel industries. In total, there were 70 cooking oil factories in Indonesia in 2006 with a total capacity of 10 million tons. Most of those cooking oil factories are located in North Sumatra (19 factories) and Jakarta (12 factories). There are also cooking oil factories in East Java, West Java, and Lampung. The other important consumers of domestic CPO are margarine/shortening, soap and detergents, and olechemical industries.
Domestic consumption of CPO in Indonesia was relatively constant in the period of 1995-2006. Total domestic consumption of CPO in 2006 was 2.3 million tons which is not much different from total consumption in 1995 (3.3 million tons). The highest domestic consumption took place in 1998 (4.2 million tons), while the lowest domestic consumption happened in 2005 (1.5 million tons).
TABLE 8. DOMESTIC CONSUMPTION OF INDONESIA’S CPO AND PKO IN 1995-2006
Year Domestic Consumption (ton)
CPO PKO
1995 3,264,431 634,903
1996 3,334,254 746,490
1997 2,504,538 729,513
1998 4,178,493 937,239
1999 2,707,561 796,078
2000 3,474,249 1,180,095
2001 3,065,815 1,076,721
2002 2,696,744 956,081
2003 4,058,438 1,446,272
2004 2,173,062 1,562,556
2005 1,496,633 1,571,583
2006 2,290,698 1,909,313
Source: BPS.
The impact of the global crisis has affected Indonesia‘s exports including CPO. To anticipate the impact, the government has provided regulations to try to create a conducive climate for palm oil industries. However, the existing regulations are not sufficient yet to support the CPO industry in the long run (Kompas, 4 April 2009). The Minister of Trade has launched various regulations to increase export performance such as Regulation No.
43/M-DAG/PER/10/β007 on the Certificate of Origin for Indonesia‘s Exported Goods.
As for the CPO trading, the fundamental policy is fixing of export price. According to the Ministry of Trade Decree No. 20/M-DAG/Per/5/007, the standard export price of
Indonesia‘s CPO is approximately 1.2-15.3 percent. The standard export price is dynamic according to the fluctuation of CPO export volume. The government also has established an export tax which was imposed since 3 September 2007. The export tax is 10 percent if CPO export price maximum $ 850 per ton and 15 percent if the price is higher to a maximum $ 1,100 per ton. Afterwards, the export tax will become 20 percent until CPO export price is $ 1,200 per ton. Finally, the export tax is 25 percent if the export price reaches $ 1,300 per ton.
The export tax is a creative policy, but it is only effective in the short run. There are many ways that could be undertaken in order to manage Indonesia‘s CPO trading without an export tax. For example, the government could increase or control domestic CPO by imposing a domestic market obligation (DMO) policy. This policy is generally accepted by either producers or consumers. The progressive tax or tariff is an obstacle for CPO exporters, because the tax burden is higher. On the other hand, the government should provide incentives for CPO producers. By comparison, the tax burden for CPO producers in Malaysia is lower than in Indonesia. In practice, many CPO producers often postpone their shipping of CPO abroad if the export tax is relatively high. The high export tax will also encourage CPO smuggling, because producers tend to try to avoid a higher tax burden.
Other than exports, the government also establishes regulations on imports As the main CPO producer in the world, Indonesia did not provide special treatment to block CPO imports (barriers to entry). Import tax for CPO is zero percent for several years although there is a 10 percent income tax for all palm oil products. However, only limited amounts of the tax collected are used for the development of the palm oil industry.
The CPO exports or imports trend is not greatly influenced by the world and domestic demand. The increase of CPO price is mainly caused by the constanly high demand from cooking oil industries. Apart from that, the utilization of CPO as an alternative source of energy, especially biodiesel, also provides significant impact on CPO demand. The developed countries including USA, Japan, South Korean, and EU begun to expand their investment in palm oil plantation.
TABLE 9. DOMESTIC AND INTERNATIONAL PRICE OF INDONESIA’S CPO IN 2001-2007
Year Domestic Price (Rp per kg) International Price ($ per MT)
2001 2,084.90 275.66
of this momentum to develop the palm oil derivative products and not only CPO. However, the government regulations are crucially important to establish Indonesia as the main palm oil producer in the world as well as its derivative industries (Amri and Yulianto, 2008). The researchers from the Research Center for Palm Oil (PPKS) in Medan, North Sumatra, have emphasized that the government should produce an integrated policy. The export tax should be reallocated to develop palm oil industries. As a comparison, the Government of Malaysia has consistently used CPO export tax of 15 ringgits per ton to support research on palm oil development.
At the beginning of 2007, the Government of Indonesia implemented DMO to secure domestic supply and stabilize the CPO price. Two big producers, Sinar Mas and Astra for example, are required to sell 20 percent of their CPO production in the domestic market. Nevertheless, the DMO policy was not effective, because the government was not firm in enforcing the policy. In addition, the CPO producers have to obey the floor price policy for the domestic market. The government should implement a reward and punishment approach in CPO policy enhancement. Besides, policy formulation should be undertaken by involving relevant stakeholders. Previously, the formulation of the CPO export tax by the Ministry of Finance was conducted without the input of GAPKI and other palm oil associations. Furthermore, the National Palm Oil Council has not provided a significant contribution to the development of the palm oil industry in Indonesia. The implementation of the CPO export tax was not effective in controlling the domestic price of CPO, because that policy is often inconsistent. Most of CPO producers have signed forward trading contracts with foreign buyers.
As a consequence, the bargaining power of Indonesia‘s CPO producers is weak in the world market. The performance of Indonesia‘s CPO export is extremely influenced by global
issues. International consumers often require tight conditions for CPO. For instance, CPO exporters are facing non-_tariff barriers implemented in destination countries. The Government of India requires CPO with a minimum -caroten of 500 ppm. This requirement is difficult to fulfill by Indonesia‘s exporters, because most of the CPO received in the final consumers contains only around 400 ppm of -caroten. Low -caroten is mainly caused by a bad handling of CPO from producers to final consumers. The other requirement is the content of FFA.
CPO EXPORT PERFORMANCE
CPO Export Volume
The Indonesia‘s CPO export performance is described by export volume and value.
Since 1999, CPO export volume always increased by different percentages. Before 1999, there were three decreases of CPO export volume, i.e. in 1992, 1995, and 1998. In 2007, CPO export volume had reached 13.1 million tons or about 8.26 percent higher than export volume in 2006 (12.1 million tons). The behavior of CPO export volume is not linear, the exponential smoothing is the most suitable trend method used to forecast the export volume. Although tending to under-estimate, the growth rate of export volume of Indonesia‘s CPO was faster after 1998. The export volume was projected to increase 9 percent to become 14.3 million tons in 2008.
FIGURE 4: EXPORT VOLUME OF INDONESIA’S CPO 1990-2007 (Source BPS)
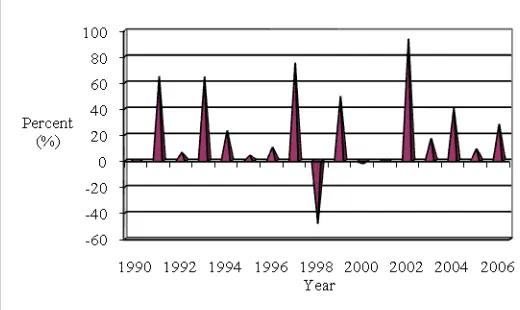
The best performance of Indonesia‘s CPO export in the period of 1990-2007 was in 1999 where the export volume increased by 123.01 percent. The second best performance is found in 1997 and 1993 where the CPO export volumes increased 77.49 percent and 58.41 percent, respectively. However, it is important to notice that the increase of CPO export volume is slower in the last three years. There are at least two factors which contribute to the lower rate of CPO export volume. First, there is an accumulation of world palm oil stocks, especially in Indonesia and Malaysia. Second, in the middle of 2007, the global economic crisis begun and this lowered the purchasing power in the main importer countries of
Indonesia‘s CPO, especially in Europe. However, the fluctuation of CPO export volume is a
usual and repetitious phenomenon of previous periods.
In the similar span of time, the worst CPO export performance occurred in 1998 when CPO export volume decreased 50.15 percent. The decrease of export volume was also found in 1992 (11.77 percent) and 1995 (22.45 percent). The interesting fact is that in the crisis period of 1997-1998, there was an extreme fluctuation of Indonesia‘s CPO export volume. A significant decrease (50.15 percent) happened in 1997, but in 1998, there was a sharp increase of CPO export volume (123.01 percent). This fact has indicated that the performance of CPO exports is very sensitive to domestic economy conditions.
FIGURE 5: PERCENTAGE CHANGE OF INDONESIA’S CPO EXPORT VOLUME
India is the most important destination for Indonesia‘s CPO export. Total volume of
CPO exported to India reached 2.8 million tons or equal to β0.51 percent of total Indonesia‘s CPO export in 2006 (12.1 million tons). This amount decreased compared to export volume in 2004 (2.8 million tons) and 2005 (2.6 million tons). The other two important importers are China and the Netherlands. Export volume of Indonesia‘s CPO to China is growing rapidly. In 2002, total export volume to China was 0.5 million tons and increased to 1.8 million tons
or 14.54 percent of total Indonesia‘s CPO export volume in β006. εeanwhile, total export to
the Netherlands in 2006 was 1.2 million tons or 10.02 percent. The percentage of CPO exports to the other countries is less than one percent. Asian countries are still the most important destinations for Indonesia‘s CPO exports.
The Indonesia‘s CPO export concentration has shifted from European countries to
Asian countries. This shift is a logical consequence of faster economic growth and population in Asian countries. CPO consumption is highly related to the economic growth and population size, because more than half of consumer goods in the market are produced by using CPO as raw material, for both food and non-food products. This is possible because CPO can be categorized as a multifunction vegetable oil (Chandran, 2009).
Recently, many countries have become the destinations of Indonesia‘s CPO exports. Indonesia‘s CPO has been accepted widely in the midst of negative issues and negative
campaigns in the world market. However, continued increase of market expansion and production does not follow CPO price control in the world market. Rotterdam is still used as a standard of CPO price in the world market. The Government of Indonesia has made every effort to have its own price reference (Kompas, 24 April 2009).
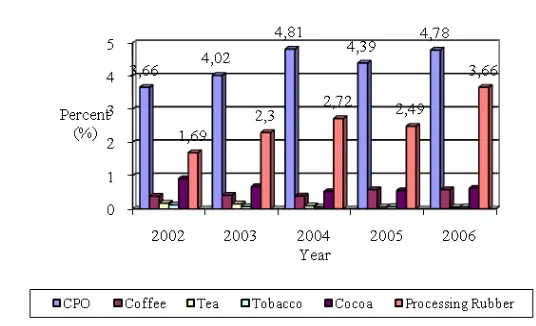
FIGURE 7: GROWTH RATE OF EXPORT VOLUME OF PLANTATION COMMODITIES IN INDONESIA 2003-2006