Full Terms & Conditions of access and use can be found at
http://www.tandfonline.com/action/journalInformation?journalCode=vjeb20
Download by: [Universitas Maritim Raja Ali Haji] Date: 11 January 2016, At: 22:29
Journal of Education for Business
ISSN: 0883-2323 (Print) 1940-3356 (Online) Journal homepage: http://www.tandfonline.com/loi/vjeb20
Technologies Across Our Curriculum: A Study of
Technology Integration in the Classroom
Fattaneh G. Cauley , K. Damon Aiken & L. Keith Whitney
To cite this article: Fattaneh G. Cauley , K. Damon Aiken & L. Keith Whitney (2009) Technologies Across Our Curriculum: A Study of Technology Integration in the Classroom, Journal of
Education for Business, 85:2, 114-118, DOI: 10.1080/08832320903258600
To link to this article: http://dx.doi.org/10.1080/08832320903258600
Published online: 07 Aug 2010.
Submit your article to this journal
Article views: 196
View related articles
ISSN: 0883-2323
DOI: 10.1080/08832320903258600
Technologies Across Our Curriculum: A Study
of Technology Integration in the Classroom
Fattaneh G. Cauley
Seaver College, Pepperdine University, Malibu, California, USA
K. Damon Aiken
Eastern Washington University, Spokane, Washington, USA
L. Keith Whitney
Seaver College, Pepperdine University, Malibu, California, USA
The availability of microcomputers and specialty software has dramatically changed the class-room instruction in many areas of business education. In this study, the authors investigated the effectiveness of the technology-enhanced instruction in their classrooms, where they had suc-cessfully integrated the use of technology in their courses. The instruments of the experiments were a survey to derive a computer comfort scale and an Excel-based assessment to determine computer proficiency. The analysis shows that increased comfort levels (i.e., decreases in ap-prehension as well as increases in enjoyment and confidence) relate positively to an objective skills-based computer-proficiency test as well as subjective self-reports of computer expertise.
Keywords: Computer comfort scale, Computer proficiency, Factor analysis, Technology in classrooms
The use of technology in classrooms has become a major component of today’s business education, where computers and specialty software are common in teaching many courses. The adoption of technology in the business curriculum and, in particular, the quantitative courses, was the natural outcome of the movement that initially started in teaching statistics, one of the commonly required courses in almost all business programs (Bell, 2000; Moore, 1997). As the role of comput-ers in the classroom has expanded, it has become increasingly important to assess this transformation to determine whether the technology is used correctly and provides the intended results (Furr, Ragsdale, & Horton, 2005).
The purpose of the present study was to examine the com-fort level of the students in using the computer and specialty software to analyze business problems. We had a unique op-portunity to conduct this research because the undergraduate business students at Seaver College, Pepperdine University,
Correspondence should be addressed to Fattaneh Cauley, Seaver Col-lege, Pepperdine University, Business Administration Division, 24255 Pacific Coast Highway, Malibu, CA 90263, USA. E-mail: fattaneh. cauley@pepperdine.edu
have been required since the early 2000s to take two lower division courses, computer science, statistical analysis, and an upper division course, quantitative analysis, using lap-top computers. We developed a survey to derive a Computer Comfort Scale (CCS) and employed an Excel-based assess-ment to determine computer proficiency (CP). The survey and the test were administered to the 168 undergraduate stu-dents in the above courses. A factor analysis resulted in three factors, with coefficient alphas ranging from .75 to .87. Sub-sequent analyses of the results confirmed the CCS as an adequate instrument to measure student comfort levels in computer use.
The first wave of the modern era in the use of technology in business education occurred when calculators replaced the ubiquitous slide rule in the 1970s. Almost simultane-ously, batch processing of data through the utilization of simple Fortran-based programs written for mainframe com-puters facilitated problem modeling and data analysis in the business disciplines. A computer science for business class was in virtually every college’s business major. The second wave occurred in the mid-1980s, when the microcomputer revolution in education arrived. By the early 1990s, the mi-crocomputer had emerged as the tool of choice for word
TECHNOLOGIES ACROSS OUR CURRICULUM 115
processing, financial analysis, and data analysis in the so-cial sciences and business. The third wave came later in the 1990s when the World Wide Web and the Internet com-bined with omnipresent microcomputers to empower teach-ers and their students to utilize a new communication gate-way to database content from libraries, governmental en-tities, various privately funded Web sites, and companies themselves.
Throughout the three decades, many educators argued for the replacement of hand-held calculators, pencil and pad, and the short-term memorization with computer technolo-gies and new pedagotechnolo-gies in the classroom (Deden & Carter, 1996; Dolence & Norris, 1995). Early on, it was recognized that the widespread use of information technology would re-sult in the integration of higher education and business and industry (Skolnik, 1998). The process of integrating technol-ogy in the teaching of quantitative courses in the schools of business became more pertinent when an INFORMS task-force highlighted the mismatch between traditional MS/OR course topics and the skills used in the workplace. The report encouraged the MS/OR educators to establish a business con-text for their analytical material as well as use spreadsheets as the delivery vehicle for traditional MS/OR algorithms (INFORMS Taskforce, 1997). The process was accelerated when research showed that the industry reacted negatively to overly quantitative MBA programs with poor computer skills (Bell, 2000).
Many educators advocated that adopting an approach to teaching statistics and other quantitative courses that incorpo-rated spreadsheet-based, example-driven problems derived from the students’ own world and from the functional areas of business would change the prevailing student attitude that such courses were boring and irrelevant to the roles that the majority of business graduates would play in the business world (Warner, 2001). At the same time, many authors pi-oneered textbooks that emphasized development of student skills in modeling while facilitating the student’s practical understanding of the logic and power of statistical analysis of data and other quantitative methods available for prob-lem solution (Moore & McCabe, 2006; Winston & Albright, 2008).
In schools of business, in particular in the teaching of the quantitative courses, the integration of computers in the class-rooms is intertwined with specialty software. Therefore, the success of adopting the technology is highly dependent on the students’ feeling comfortable with the use of the technol-ogy tools. Research has shown that as students are exposed to computer technology in the classroom they learn to be comfortable with its use and express preference for using it in the future (Spinelli, 2001); the student comfort with computer use plays an important role in the development of proficiency in computer skills that are valued beyond college (Efaw, Hampton, & Martinez, 2004; Mackinnon & Vibert, 2002); the use of technology in the classroom has had a positive effect on overall intellectual development and
edu-cational experience of the student (Nelson & Kuh, 2005). It is therefore vital to develop an instrument that can provide an assessment of student comfort level in use of specialty tools in solving business problems, in which the instrument can join the other assessment tools in evaluating the success of the curriculum changes and identify potential problems for early intervention.
In this article, we have shown that the assessment tool CCS, can be used to break students into PC-comfort groups, ranging from barely comfortables to greatly comfortables. Moreover, in the analysis section it is shown that the PC-comfort groups show significant differences in their CP scores as well as factors such as computer self-rated ex-pertise.
METHOD
Instruments
The instruments used in the study were a survey to derive a CCS and an Excel-based assessment to determine CP. The CCS was loosely based on a survey called Computer Atti-tude Scales, which is considered a good standard for measur-ing attitudes toward technology use in a variety of settmeasur-ings (Loyd & Gressard, 1984). The CCS contained some mea-sures along similar factors as the Computer Attitude Scales, but also included measures to determine the students’ com-fort level in computer use and specialty software for solving business problems. The CCS contained 25 items, and each item was rated on a 7-point Likert-type scale ranging from 1 (Strongly Disagree) to 4 (Neither Agree nor Disagree) to 7 (Strongly Agree). Some of the items were positively worded and some were negatively worded, wherein the latter was considered as reverse coded for scoring. Also nine attitudi-nal, usage-related, and demographic questions were attached to the end of CCS. Aside from class standing and gender, the demographics questions in general aimed to determine the degree of access to computers in the students’ background. They were then asked to provide self-ratings of expertise and present computer activities.
The skills-based CP assessment was designed to measure the students’ competency in using Excel as it can be em-ployed in analyzing business questions. The CP assessment consisted of 30 questions, all of which would have been dis-cussed in one or more of the three courses. The CP assessment was administered using Skills Assessment Manager (SAM) software. Students logged in to the SAM Web site on the day of data collection and employed the simulation technology to answer the assessment questions. Each question simu-lated a screen in the live application on which it was based and required interaction from the student. An automated grading tool recorded the results of the CP assessments on submission.
Participants and Data Collection
A total of 168 students participated in the present research. The participants were students enrolled in three courses: computer science, statistics, and quantitative analysis. The class standing of students enrolled in the three courses ranged from freshman and sophomore (computer science and statis-tics) to junior and senior (quantitative analysis); furthermore, there was an overlap of class standing in all three courses. It should be noted that, if a student starts as a freshman at Seaver College, he or she would complete the above three courses in computer classrooms. The students that had transferred from other institutions would complete at least one (quantitative analysis) and, in many instances, two or all three of the above courses in computer classrooms. Therefore, all students en-rolled in all sections of the three courses were targeted. The students participated on a voluntary basis and were assured complete anonymity.
The data were collected from all classes in regular class time during the same week. In the classroom, prior to the start of data collection, a statement regarding the volun-tary nature of the participation and the promise of complete anonymity was read. Next, the instructions on how the data would be collected were read aloud, and the students had the opportunity to ask clarifying questions about the instruc-tions. Then, each student was handed at random a packet that contained a paper copy of the CCS. To safeguard the anonymity of the participating students and also to corre-late the CCS and the online CP assessment, each copy of the CCS inside the packet was tagged with a set of numbers that the receiving student could use to log in to take the CP assessment.
Data Analyses
To confirm the structure of the CCS, the 25 survey items were subjected to exploratory factor analysis. This process was designed to describe and summarize data sets by grouping together variables that are correlated (Tabachnick & Fidell, 2005). All analysis was performed in SPSS (version 14.0).
In a reiterative process, variables were carefully and specifically chosen to reveal underlying processes and rela-tionships. In this instance, variables were first removed from the survey according to an improved reliability qualification. If the overall scale alpha was to improve after dropping the variable, then the variable was singularly dropped. Next, vari-ables were dropped if they showed cross loadings above 0.30. The iterative process was stopped when dropping variables no longer had a positive effect on the percentage of variance explained. After numerous iterations to purify the scale, 13 items remained.
Consequently, the principal component factor analysis with varimax rotation and Kaiser Normalization resulted in three foundational components. It should be noted that the varimax rotation method provides orthogonal factors; thus, the rotation process yields a more interpretable solu-tion without changing underlying mathematical properties (Tabachnick & Fidell, 2005).
The first component, referred to as the apprehension fac-tor, contained five items that represented a negative outlook in working with computers, such as apprehension and unease. Among the high-loading variables were reverse-coded items such as “Computers make me feel uneasy” and “Computers scare me somewhat.” The second component was referred to as the enjoyment factor and contained four items that
TABLE 1
Variables in the Final Computer Comfort Scale (CCS) and the Scale Alphas of the Three Factors
Final CCS Apprehension Enjoyment Confidence
Computers make me feel uneasy. (r) .836 — —
Computers make me feel uncomfortable. (r) .831 — —
I get a sinking feeling when I think of trying to use a computer. (r) .769 — —
Computers scare me somewhat. (r) .766 — —
I am no good with computers. (r) .692 — —
Once I start to work with my computer, I find it hard to stop. — .806 — My friends think I spend too much time on the computer. — .795 —
I enjoy talking with others about computers. — .704 —
I think working with computers would be enjoyable and stimulating.
— .631 —
I feel secure in working in Excel. — — .776
I get good grades in computer courses. .338 — .725
I am at ease analyzing data. — — .675
Generally, I feel okay about trying new problems on computers. .384 — .637
Note.Questions in the final CCS were rated on a 7-point Likert scale, reverse coded (r), factor loadings below .300 are not shown, and Varimax with Kaiser normalization was used for the rotation method.
TECHNOLOGIES ACROSS OUR CURRICULUM 117
TABLE 2
Statistics for Final Computer Comfort Scale (CCS) and the Three Factors
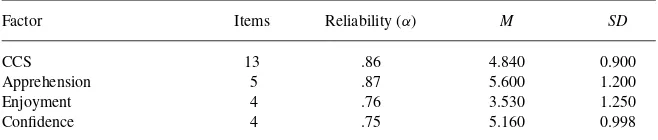
Factor Items Reliability (α) M SD
CCS 13 .86 4.840 0.900
Apprehension 5 .87 5.600 1.200
Enjoyment 4 .76 3.530 1.250
Confidence 4 .75 5.160 0.998
Note, Statistics for final CCS and the three factors obtained through factor analysis. Analyses were performed using SPSS (version 14.0); responses were rated on a 7-point Likert-type scale.
represented positive feelings toward working with ers, such as “I enjoy talking with others about comput-ers” and “My friends think I spend too much time on the computer.” The last component, the confidence factor, in-cluded four items. The factor related measures of poise, self-confidence, and self-assuredness by subjects in using computers to solve business problems. Among high-loading variables were items such as “I feel secure in working in Excel” and “I am at ease analyzing data.”
Together, the three factors explained almost 64% of the to-tal variance. The reliability alpha for the revised CCS was.86, and the coefficient alphas for the apprehension, enjoyment, and confidence subscales were.87,.76, and.75, respectively. Table 1 shows the final CCS instrument and resultant factor loadings; the reliability coefficients and descriptive statistics across the three factors are reported in Table 2.
Next, to delineate the PC-uncomfortable subjects from the PC-comfortable subjects, the percentiles of the CCS mean scores were used to break subjects into three equal groups. The groups were then labeled thebarely comfortables, the
comfortables, and thegreatly comfortables. The CCS means for the barely comfortables fell below 5.0 with SD of 6, and for the comfortables was between 5.0–5.4 with SD of 2; the greatly comfortables showed CCS averages above 5.4 with SD of 4.
RESULTS AND DISCUSSION
The initial analysis investigated the adequacy of the CCS as a measurement instrument by testing the PC-comfort groups using analysis of variance (ANOVA) procedures. As
expected, the three PC-comfort groups showed significant differences in their means,F(2, 161)=3.05,p<.000. More
notably, the PC-comfort groups showed a significant posi-tive linear trend across their CP mean scores,F(1, 161)=
14.10,p<.000, revealing that greater levels of comfort with
PCs relate to increases in objective, skills-based proficiency scores (see Table 3).
Additionally, using the data from the attitudinal questions, the three PC-comfort groups showed significant differences in their degrees of self-rated computer expertise,F(2, 160)
=23.80,p<.000, as well as their reported years of
experi-ence with PCs,F(2, 162)=14.20,p<.000. In essence, the
CCS not only served to delineate groups of participants in terms of their self-assurance and confidence levels towards use of computers, it also revealed precise between-group dif-ferences, which helped to further validate the CCS as an adequate instrument.
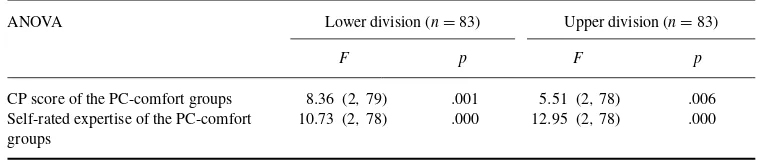
Next, we considered the class standing of the students and investigated the influence on the PC-comfort groups. Due to small cell sizes, the participating students were divided into two classes, the lower division (freshmen and sopho-mores), and the upper division (juniors and seniors). A series of ANOVA procedures were performed and the results are summarized in Table 4. The three PC-comfort groups showed statistically significant differences in their CP scores for both class standings. Statistically significant differences also were observed in the degrees of self-rated computer expertise of the PC-comfort groups of both class standings. This result further supports the validity of CCS to explain the groups of subjects with regard to their PC-comfort levels. However, a comparison of the mean CP scores for the two classes did not
TABLE 3
Statistics for Computer Proficiency (CP) Test by PC-Comfort Groups
PC-comfort groups n M SD
Barely comfortables 56 61.20 20.48
Comfortables 54 69.70 17.23
Greatly comfortables 57 79.30 15.32
Note. Analysis of the assessment tool Computer Comfort Scale was used to break subjects into three PC-comfort groups. Analyses were performed using SPSS (version 14.0); responseswere rated on a 7-point Likert-type scale.
TABLE 4
Summary of ANOVAs for Class Standing
ANOVA Lower division (n=83) Upper division (n=83)
F p F p
CP score of the PC-comfort groups 8.36 (2,79) .001 5.51 (2,78) .006 Self-rated expertise of the PC-comfort
groups
10.73 (2,78) .000 12.95 (2,78) .000
Note.Analysis of the assessment tool, the Computer Comfort Scale, was used to break subjects into three PC-Comfort Groups. Analyses were performed using SPSS (version 14.0). Self-rated expertise was rated on a 5-point Likert-type scale. ANOVA=analysis of variance. CP=computer proficiency.
show a statistically significant difference, and a chi square test of independence showed no relationship between the class standings and PC-comfort groups.
Finally, consistent with past studies (Kuh & Hu, 2001), significant gender differences emerged in analyses of the data. For instance, we observed significant gender differences in CCS means. The mean among male participants was 5.0 (SD=.88), and the female mean was 4.5 (SD=.87),t(165)
=3.1,p<.002. Additionally, female participants reported
lower scores for self-rated computer expertise. They showed a mean of 3.1 (SD=.61)—generally seeing themselves as neither a novice nor an expert on this 5-point scale. Male par-ticipants reported greater expertise, with a mean of 3.4 (SD=
.79)—leaning toward being “somewhat of an expert.” These differences proved to be statistically significant,t(161)=2.6,
p <.01. Interestingly, we found no statistically significant
differences in the CP scores of female and male students. This finding implies that whereas female business students seem to be less comfortable, more apprehensive and less con-fident with use of PCs, they seemingly have no reason to be (i.e., they are not less proficient in their skills compared with male students).
CONCLUSIONS
As information technology has become an important element in the business world, collegiate schools of business have re-sponded by increasing the use of computers and specialty software in the classrooms. The success of these programs lies with the students feeling comfortable using the technol-ogy tools during college years and beyond. In this paper an assessment tool for determining student comfort level was introduced and discussed. The CCS has shown promise in delineating the student’s PC-comfort level among our stu-dents in classes in which the instruction relies heavily on use of technology. In addition, the results show that the students’ CCS and CP scores show significant relation, which confirms the CCS as an adequate instrument.
REFERENCES
Bell, P. C. (2000). Teaching business statistics with Microsoft Excel. In-forms: Transactions on Education,1(1), 18–26.
Deden, A., & Carter, V. K. (1996). Using technologies to enhance students’ skills.New Directions for Higher Education,24, 81–92.
Dolence, M., & Norris, D. (1995).Transforming higher education: A vision for learning in the 21st century.Ann Arbor, MI: Society for College and University Planning.
Efaw, J., Hampton, S., & Martinez, S. (2004). Teaching and learning with laptop computers in the classroom.Education Quarterly, 27(3), 10–18.
Furr, P. F., Ragsdale, R., & Horton, S. G. (2005). Technology’s non-neutrality: past lessons can help guide today’s classrooms.Journal of Education and Information Technologies,10, 277–287.
INFORMS Taskforce. (1997). Informs, business school education task force, operating subcommittee 1997, OR/MS and MBAs.OR/MS Today,24(1), 36–41.
Kuh, G. D., & Hu, S. (2001). The relationship between computer and in-formation technology use, selected learning and personal development outcomes, and other college experiences.Journal of College Student De-velopment,42, 217–232.
Loyd, B. H., & Gressard, C. (1984). Reliability and factorial validity of computer attitude scales.Journal of Education and Psychological Mea-surement,44, 501–505.
Mackinnon G. R., & Vibert C. (2002). Judging the constructive impacts of communication education study: A business education study.Journal of Education and Information Technologies,7, 127–135.
Moore, D. S. (1997). New pedagogy and new content: The case of statistics. International Statistics Review,65, 123–165.
Moore, D. S., & McCabe, G. P. (2006).Introduction to the practice of statistics(5th ed.). New York: W. H. Freeman.
Nelson, T. F. L., & Kuh, G. D. (2005). Student experiences with information technology and their relationship to other aspects of student engagement. Research in Higher Education,46, 211–233.
Skolnik, M. L. (1998). Higher education in the 21st century.Futures,30, 635–650.
Spinelli, M. A. (2001). The use of technology in teaching business statistics. Journal of Education for Business,77, 41–44.
Tabachnick, B. G., & Fidell, L. S. (2005).Using multivariate statistics(5th ed.). Boston: Allyn & Bacon.
Warner, C. B., & Meehan, A. M. (2001). Microsoft Excel as a tool for teaching basic statistics. Teaching of Psychology, 28, 295– 298.
Winston, W. L., & Albright, S. C. (2008).Practical management science (Rev. 3rd ed.). Mason, OH: South-Western Cengage Learning.