DBS Group Holdings Ltd Incorporated in the Republic of Singapore Company Registration Number: 199901152M
To: Shareholders
The DBS Group Holdings Ltd (“DBSH” or “the Company”) Board of Directors report unaudited financial results for the first quarter ended March 31, 2005.
The Directors have declared a gross interim dividend of 11 cents for each DBSH non-voting convertible preference share (“CPS”), each DBSH non-voting redeemable CPS, and for each DBSH ordinary share. All interim dividends will be paid less 20% Singapore income tax.
The interim dividends will be payable on June 7, 2005. Notice is hereby given that the Share Transfer Books and Register of Members of the Company for ordinary shares will be closed on May 25, 2005 to May 26, 2005, both dates inclusive. Duly completed transfers received by the Company's Registrar, Barbinder & Co Pte Ltd of 8 Cross Street #11-00 PWC Building, Singapore 048424 up to 5.00 p.m. on May 24, 2005 will be registered to determine shareholders' entitlement to the interim dividends. In respect of ordinary shares in the securities accounts with The Central Depository (Pte) Limited (“CDP”), the interim dividends will be paid by DBSH to CDP, which will in turn distribute the dividend entitlements to shareholders.
By order of the Board Heng Lee Cheng (Ms) Group Secretary April 29, 2005 Singapore
Performance Summary
Unaudited Financial Results
for the First Quarter ended
March 31, 2005
Contents
Page
Financial Highlights 2
Adoption of New and Revised Accounting Standards 3
Financial Review 3
Net Interest Income and Net Interest Margin 6
Non-Interest Income 7
Operating Expenses 8
Provision Charge 8
Balance Sheet 9
Asset Quality 9
Customer Loans 11
Deposits 12
Capital Adequacy Ratio 13
Unrealised Valuation Surpluses 13
Geographical Segment Analysis 14
Business Segment Analysis 15
Comparatives 16
Appendix I: Unaudited Consolidated Profit and Loss Account Appendix II: Unaudited Consolidated Balance Sheet
Appendix III: Unaudited Balance Sheet of DBS Group Holdings Ltd Appendix IV: Unaudited Statements of Changes in Shareholders’ Equity Appendix V: Unaudited Consolidated Cash Flow Statement
Appendix VI: Selected Notes to the Accounts 1. Issuance of Ordinary Shares
2. Loan and Investment Exposures to Malaysia, Indonesia, Thailand, Korea, The Philippines (Regional Countries), Hong Kong and China
3. Non-Performing Loans and Provisions 4. Daily Earnings at Risk and Trading Income
Financial Highlights
DBS Group Holdings Ltd (“DBSH”) prepares its consolidated DBSH Group (“Group”) financial statements in accordance with Singapore Financial Reporting Standards (“FRS”).
In $ millions
1st Qtr 2005
1st Qtr 2004
+/(-) %
4th Qtr 2004
+/(-) % For the period
Operating income 1,072 1,270 (16) 1,027 4
Operating profit before provisions and goodwill amortisation 563 756 (26) 486 16
Net profit attributable to equity holders of the parent (before
goodwill amortisation) 412 592 (30) 426 (3)
Net profit attributable to equity holders of the parent 412 482 (15) 316 30
At period-end
Equity attributable to equity holders of the parent 16,848 15,298 10 16,422 3
Customer loans 1/ 71,060 65,344 9 69,664 2
Customer deposits 115,931 111,938 4 113,206 2
Total assets 182,272 176,487 3 175,469 4
Per share (in $)
Basic earnings excluding goodwill amortisation 2/ 1.09 1.59 (31) 1.13 (4)
Basic earnings 2/ 1.09 1.29 (16) 0.84 30
Diluted earnings 2/ 1.06 1.25 (15) 0.81 31
Net asset value at period-end 3/
(i) based on existing ordinary share capital 10.99 9.97 10 10.71 3
(ii) assuming non-voting convertible preference shares (“CPS”) and non-voting redeemable CPS are converted to ordinary
shares 10.80 9.83 10 10.53 3
Performance ratios
(%)
1st Qtr 2005
1st Qtr 2004
4th Qtr 2004 On a GAAP basis
Return on assets 2/ 0.92 1.15 0.74
Return on equity 2/ 3/ 9.91 12.82 7.76
Excluding goodwill amortisation
Return on assets 2/ 0.92 1.41 1.00
Return on equity 2/ 3/ 9.91 15.75 10.46
Efficiency and revenue mix ratios
Cost-to-income ratio (excluding goodwill amortisation) 47.5 40.5 52.7
As a percentage of total operating income:
- net interest income 61.9 49.9 61.9
- non-interest income 38.1 50.1 38.1
Capital adequacy ratios (at period-end)
- Tier 1 capital 10.9 10.4 11.3
- Total capital 15.3 14.5 15.8
Notes:
1/ After deducting cumulative provisions.
Adoption of New and Revised Accounting Standards
The Council on Corporate Disclosure and Governance (“CCDG”) recently adopted several new and revised Financial Reporting Standards (“FRS”), which are effective January 1, 2005 for DBSH Group. The key changes include the following:
• FRS 39 Financial Instruments: Recognition and Measurement (revised)
• FRS 102 Share-based Payment
• FRS 103 Business Combinations
• Interpretation of FRS (“INT FRS”) 12 Consolidation – Special Purpose Entities (revised)
• FRS 1 Presentation of Financial Statements (revised)
The impact to DBSH Group include: (a) fair value accounting for certain financial instruments including derivatives under FRS 39; (b) share option expensing under FRS 102; and (c) discontinuation of goodwill amortisation under FRS 103. Except for the prospective application of FRS 39 and FRS 103, the other accounting standard changes are applied retrospectively, with the comparative financial results restated to conform to the new accounting standards.
Please see Appendix VI, note 5 for an analysis of the impact to the Group results.
Financial Review
DBSH Group’s net profit attributable to equity holders of the parent (“net profit”) was $412 million for first quarter 2005, down 15% over first quarter 2004, but was 30% higher over fourth quarter 2004. With the adoption of FRS 103, goodwill amortisation ceases to be charged to the profit and loss account with effect from first quarter 2005. On a comparable basis, net profit before goodwill amortisation in first quarter 2005 declined 30% from first quarter 2004 and 3% from fourth quarter 2004. The year-on-year decline was mainly due to lower net gains from treasury-related activities and investment securities. Compared to fourth quarter 2004, operating profit rose 16% due to a 4% increase in operating income and a 6% decline in operating expenses. The increase was offset by higher provisions as fourth quarter 2004 benefited from write-backs in provisions for securities and general provisions.
• Operating income of $1.072 billion was 16% lower than first quarter 2004, due to a 36% decline in non-interest income from lower treasury gains, mitigated by higher net non-interest income. Compared to fourth quarter 2004, both net interest and non-interest income rose 4%.
• Operating expenses was down 1% over first quarter 2004 to $509 million in first quarter 2005, mainly due to lower revenue-related expenses as commission expenses paid to remisiers were reduced in tandem with market volumes. Compared to operating expenses incurred in the previous quarter, the 6% decline in operating expenses in first quarter 2005 was mainly due to lower spending on advertising and promotions for retail products, and a decrease in technology and revenue-related expenses.
• Cost-to-income ratio was 47.5% for first quarter 2005, compared to 40.5% for first quarter 2004 and 52.7% for fourth quarter 2004.
Profit and Loss Account 1/
In $ millions
1st Qtr 2005
1st Qtr 2004
+/(-) %
4th Qtr 2004
+/(-) %
Net interest income 664 634 5 636 4
Non-interest income 408 636 (36) 391 4
Operating income 1,072 1,270 (16) 1,027 4
Operating expenses (509) (514) (1) (541) (6)
Operating profit before provisions 2/ 563 756 (26) 486 16
Provisions (62) (50) 24 31 NM
Operating profit 2/ 501 706 (29) 517 (3)
Share of profits less losses of associated
and joint venture companies 15 18 (17) 15
-Net profit before taxation 2/ 516 724 (29) 532 (3)
Taxation (91) (119) (24) (93) (2)
Net profit after taxation 2/ 425 605 (30) 439 (3)
Minority interests (13) (13) - (13)
-Net profit attributable to equity holders of the parent
(before goodwill amortisation) 412 592 (30) 426 (3)
Goodwill amortisation - (110) (100) (110) (100)
Net profit attributable to equity holders of the parent 412 482 (15) 316 30 NM: Not meaningful
Notes:
Hong Kong Country Results
For first quarter 2005, net profit after taxation for Hong Kong operations on a Singapore GAAP basis declined 27% from first quarter 2004 to $121 million. The decline was mainly due to lower operating income and higher operating expenses, partly offset by lower provision charges. Compared with fourth quarter 2004, net profit after tax declined 6% due to lower operating income, partly offset by lower operating expenses and lower provision charges. DBS Bank (Hong Kong) Limited divested its stake in Banco de Oro Universal Bank, a bank in the Philippines, recording a $12 million gain in fourth quarter 2004, and a $11 million gain in first quarter 2005.
• Net interest income was down 9% from first quarter 2004 mainly due to the narrower spread between the HKD Prime rate and HIBOR 1/, a run off in higher yielding assets and competitive price pressures on loan yields. This was partly offset by an increase in customer loans. Compared to fourth quarter 2004, net interest income decreased 2% as the spread between the HKD Prime rate and HIBOR continued to narrow.
• The adoption of FRS39 resulted in mark to market losses on derivatives that do not qualify as hedges. Non-interest income therefore declined 29% from first quarter 2004 and 20% from fourth quarter 2004. Moreover, lower income from sales of treasury investment products and lower fee income were recorded in first quarter 2005.
• Operating expenses were 6% higher compared to first quarter 2004 mainly due to increased headcount and salary increments. In fourth quarter 2004, advertising and promotional expenditures were higher.
• Provision charge decreased 72% from first quarter 2004 reflecting the stronger economic environment and property market. The adoption of revised MAS 612 resulted in additional general provisions in fourth quarter 2004 and a write-back in first quarter 2005.
Profit and Loss Account (Based on Singapore Generally Accepted Accounting Principles)2/ In $ millions
1st Qtr 2005
1st Qtr 2004
+/(-) %
4th Qtr 2004
+/(-) %
Net interest income 200 219 (9) 205 (2)
Non-interest income 99 139 (29) 124 (20)
Operating income 299 358 (16) 329 (9)
Operating expenses (151) (142) 6 (158) (4)
Operating profit before provisions 148 216 (31) 171 (13)
Provisions (7) (25) (72) (23) (70)
Operating profit 141 191 (26) 148 (5)
Net profit before taxation 143 194 (26) 150 (5)
Net profit after taxation 121 165 (27) 129 (6)
Notes:
1/ HIBOR: Hong Kong Interbank Offer Rate
Net Interest Income and Net Interest Margin
Exhibit 1
Group Net Interest Income and Net Interest Margin
2 ,6 4 5
2 ,3 7 5 2 ,5 6 6
6 3 4 6 5 1 6 4 5 6 3 6 6 6 4
1 .9 9
1 .7 8 1 .7 9 1 .7 9 1 .7 9 1 .8 3 1 .7 5 1 .7 6
0 5 0 0 1 , 0 0 0 1 , 5 0 0 2 , 0 0 0 2 , 5 0 0 3 , 0 0 0
2 0 0 2 2 0 0 3 2 0 0 4 1 Q 0 4 2 Q 0 4 3 Q 0 4 4 Q 0 4 1 Q 0 5 0 1 2 3
N e t In te r e s t In c o m e N e t In te r e s t M a r g i n ( % )
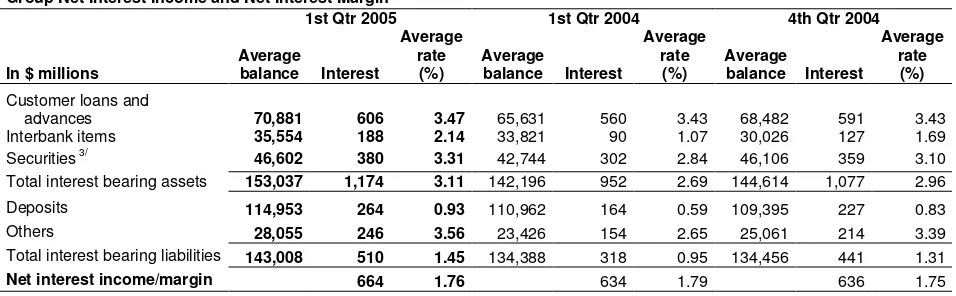
Net interest income for first quarter 2005 at $664 million was up 5% year-on-year, or 9% higher if DBS Thai Danu Bank Public Company Limited (“DTDB”) 1/net interest income was excluded from first quarter 2004. Compared to fourth quarter 2004, net interest income improved 4%.
• The increase in net interest income was largely due to growth in the volume of interest bearing assets, as end-period customer loans grew 14% year-on-year (excluding DTDB) and 2% compared to fourth quarter 2004.
[image:8.595.52.296.115.264.2] [image:8.595.51.529.462.610.2]• Net interest margin for first quarter 2005 was 1.76%, lower than 1.79% in first quarter 2004 but marginally higher than the 1.75% reported in fourth quarter 2004. There was continued pricing pressure on mortgage loans, while deposit volumes grew and costs of interbank-pegged deposits increased. These were offset by higher yields for interbank assets, securities and floating-rate corporate loans.
Table 1
Group Net Interest Income and Net Interest Margin 2/
1st Qtr 2005 1st Qtr 2004 4th Qtr 2004
In $ millions
Average
balance Interest
Average rate
(%)
Average
balance Interest
Average rate (%)
Average
balance Interest
Average rate
(%) Customer loans and
advances 70,881 606 3.47 65,631 560 3.43 68,482 591 3.43
Interbank items 35,554 188 2.14 33,821 90 1.07 30,026 127 1.69
Securities 3/ 46,602 380 3.31 42,744 302 2.84 46,106 359 3.10
Total interest bearing assets 153,037 1,174 3.11 142,196 952 2.69 144,614 1,077 2.96
Deposits 114,953 264 0.93 110,962 164 0.59 109,395 227 0.83
Others 28,055 246 3.56 23,426 154 2.65 25,061 214 3.39
Total interest bearing liabilities 143,008 510 1.45 134,388 318 0.95 134,456 441 1.31
Net interest income/margin 664 1.76 634 1.79 636 1.75
Notes:
1/ DBS Thai Danu Bank Public Company Limited (DTDB) was deconsolidated on June 25, 2004.
Non-Interest Income
Table 2
Group Non-Interest Income
In $ millions
1st Qtr 2005
1st Qtr
2004 +/(-)%
4th Qtr 2004
+/(-) %
Fee and commission income
Stockbroking 47 69 (32) 45 4
Investment banking 23 26 (12) 35 (34)
Trade and remittances 39 38 3 41 (5)
Loan related 52 52 - 39 33
Deposit related 19 21 (10) 20 (5)
Credit card 18 22 (18) 22 (18)
Fund management 10 11 (9) 10
Wealth management (unit trust distribution and bancassurance) 37 34 9 32 16
Others 8 8 - 10 (20)
Total 253 281 (10) 254 (0)
Dividend and rental income 13 13 - 17 (24)
Other income
Net gain on treasury related activities
(including structured investment products) 112 252 (56) 93 20
Net gain on investment securities 25 86 (71) 25
Net gain on fixed assets 3 2 50 - NM
Others 2 2 - 2
Total 142 342 (58) 120 18
Total non-interest income 408 636 (36) 391 4
Non-interest income as a percentage of operating income (%) 38.1 50.1 38.1 NM: Not meaningful
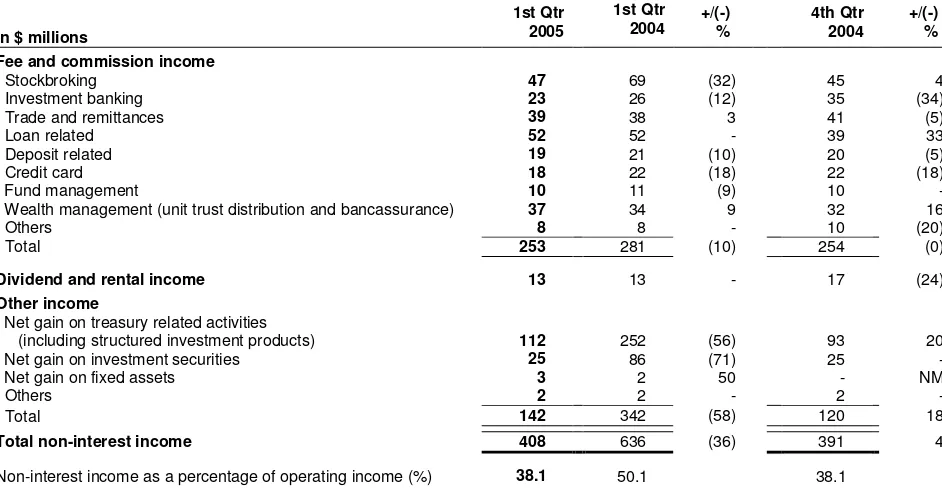
Non-interest income in first quarter 2005 was $408 million, a 36% decline from first quarter 2004, but improved 4% from fourth quarter 2004.
• Fee and commission income was $253 million for first quarter 2005, a 10% decline year-on-year. This was mainly attributable to lower stockbroking income, which was affected by the thinner trading volumes in first quarter 2005. Compared to fourth quarter 2004, fee and commission income was flat. The higher loan syndication fees and wealth management income were offset by lower investment banking income as the previous quarter included investment banking fees from lead-managing real estate investment trusts.
• Year-on-year, other income declined 58% to $142 million in first quarter 2005, driven by lower net gain on treasury activities, as lower profits were recorded on foreign exchange and derivatives products. Net gain on investment securities was also lower in first quarter 2005 as a $46 million gain from the redemption of investment funds managed by third parties was included in first quarter 2004. Compared to fourth quarter 2004, other income improved 18%, as net gain on treasury-related activities was higher.
Operating Expenses
Table 3
Group Operating Expenses
In $ millions
1st Qtr 2005
1st Qtr 2004
+/(-) %
4th Qtr 2004
+/(-) %
Staff costs 265 257 3 259 2
Occupancy expenses 43 46 (7) 41 5
Technology-related expenses 74 77 (4) 82 (10)
Revenue-related expenses 47 54 (13) 55 (15)
Others 80 80 - 104 (23)
Total operating expenses 509 514 (1) 541 (6)
Cost-to-income ratio (%)
47.5 40.5 52.7
Staff headcount number (at period-end) 11,649 12,173 11,454
Operating expenses for first quarter 2005 was $509 million, a decline of 1% year-on-year, and was 6% lower compared to fourth quarter 2004.
• Year-on-year, staff costs rose 3%, mainly due to salary increments. In first quarter 2005, employee share options expenses were recognised as staff costs with the adoption of FRS 102 on Share-based Payment. Retrospective changes to staff costs were made to previous quarters. Compared to first quarter 2004, revenue-related expenses were lower as commission expenses paid to remisiers declined in tandem with business volume.
• Compared to fourth quarter 2004, staff costs rose 2% due to salary increments and increased headcount. Staff headcount at end March 2005 was 11,649, a 2% increase over end December 2004. The increase in staff costs was offset by lower spending on advertising and promotions for retail products, and a decrease in technology and revenue-related expenses.
[image:10.595.52.533.432.576.2]Provision Charge
Table 4
Group Provision Charge
In $ millions
1st Qtr 2005
1st Qtr 2004
+/(-) %
4th Qtr 2004
+/(-) % Specific provision (“SP”)
Loans
Singapore 22 17 29 26 (15)
Hong Kong 11 17 (35) 1 NM
Other countries 10 (5) NM 9 11
Sub-Total 43 29 48 36 19
Securities, properties and other assets 4 1 NM (53) NM
Total Specific Provision 47 30 57 (17) NM
1
General provision 15 20 (25) (14) NM
Total provision charge 62 50 24 (31) NM
SP (loans) / Average loan (basis point) 24 17 21
NM: Not meaningful
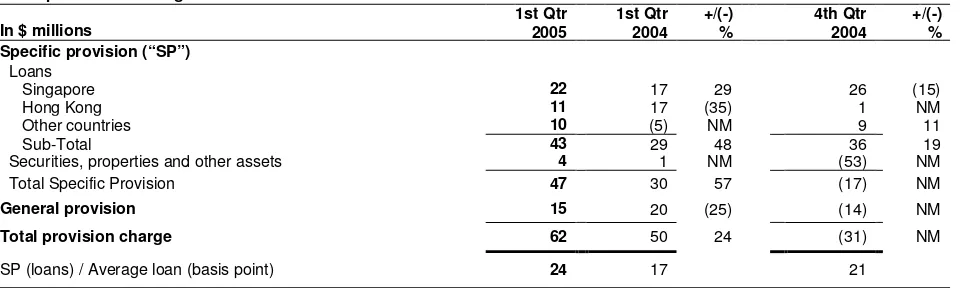
Total provision charge for first quarter 2005 was $62 million, compared to $50 million charge for first quarter 2004, and a net write-back of $31 million for fourth quarter 2004.
• Year-on-year, specific provision charge for loans increased 48% to $43 million mainly due to lower loan recoveries. In fourth quarter 2004, the $53 million write-back in specific provision for securities, properties and other assets was due to improved valuations.
Balance Sheet
Table 5
Group Key Balance Sheet Items
In $ millions
Mar 31 2005 Dec 31 2004 Mar 31 2004
Total assets 182,272 175,469 176,487
Customer loans 1/ 71,060 69,664 65,344
Customer deposits 115,931 113,206 111,938
Loan-to-deposit ratio (%) 61.3 61.5 58.4
Loan and non-trading debt securities-to-deposit ratio (%) 81.4 82.0 78.4
Note:
1/ After deducting cumulative provisions.
At March 31, 2005, total assets were $182 billion.
• Compared to end December 2004, customer loans grew 2% to $71.1 billion, led by increases in housing loans and loans granted to building and construction, as well as manufacturing sectors. Customer deposits grew 2% to $115.9 billion, largely accounted for by fixed and current deposits.
• The Group’s loan-to-deposit ratio at end March 2005 was 61.3%. Including non-trading debt securities, the ratio of loan and non-trading debt securities to deposits was 81.4%.
Asset Quality
Exhibit 2
Group Non-Performing Loans
Table 6
Group Geographical NPL Rate (Based on MAS standard)
(%) Mar 31 2005 Dec 31 2004 Mar 31 2004
Singapore 2.3 2.2 2.7
Hong Kong 1.8 2.0 2.6
Regional countries2/
(excl. DTDB) 4.0 5.6 14.7
DTDB NA NA 26.1
Other countries 4.9 5.0 7.8
3 , 3 5 9
1 , 9 2 8 1 , 9 1 9 1 , 9 3 4 2 , 1 8 2 4 , 2 2 4
3 , 7 8 0
1 , 9 1 9
4.6
2.4 6 . 1
5.2
2.5 3.0 2.6 2 . 5
0 2 , 0 0 0 4 , 0 0 0 6 , 0 0 0
D e c 0 2
D e c 0 3
D e c 0 4
M a r 0 4
J u n 0 4
S e p 0 4
D e c 0 4
M a r 0 5
- 1 0 -5 0 5 1 0
S 'p o re H o n g K o n g 5 R C ( e xc l D T D B ) D T D B O th e r C o u n trie s N P L /L o a n s
NA : Not applicable Notes:
1/ NPL rate is computed based on total non-bank customer NPLs (excluding non-performing debt securities and contingent items) divided by total gross non-bank customer loans.
2/ Regional countries (“RC”) include Malaysia, Indonesia, Thailand, Korea and the Philippines.
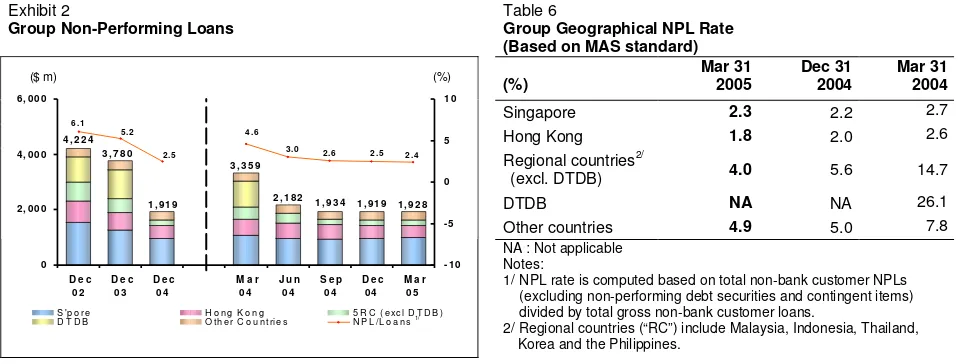
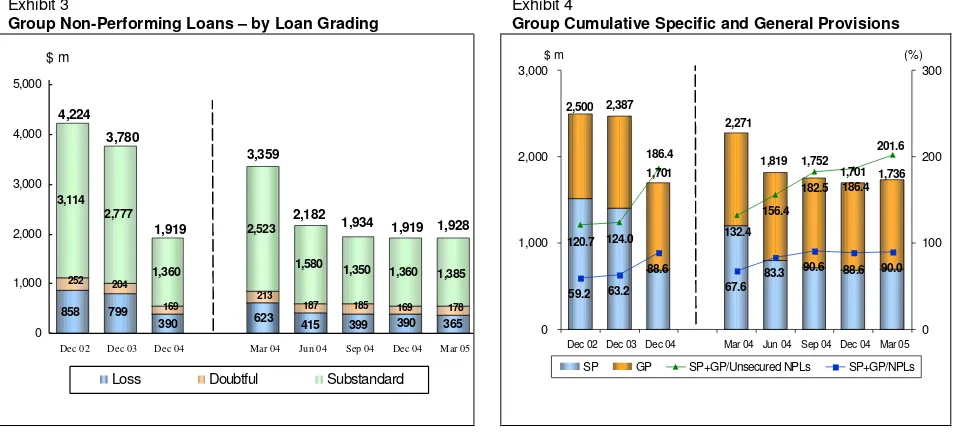
• Non-performing loans (“NPLs”) remained stable at $1.9 billion at end March 2005. Out of the $1.9 billion NPLs, $0.6 billion or 30% were restructured NPLs.
• Singapore NPLs were $1 billion and accounted for 51% of the Group’s NPLs, while Hong Kong NPLs of $0.5 billion accounted for 24%.
• The ratio of NPLs to the total non-bank loans (“NPL rate”) improved from 2.5% at end December 2004 to 2.4% at end March 2005. The NPL rates for Hong Kong, regional countries and other countries operations improved to 1.8%, 4.0% and 4.9% respectively, at end March 2005 due to a higher loan base.
($ m) (%)
Loan Grading
Of the total $1.9 billion NPLs at end March 2005, 72% were classified as substandard, 9% as doubtful and the remaining 19% in the loss category. 55% of the NPLs were secured by collateral.
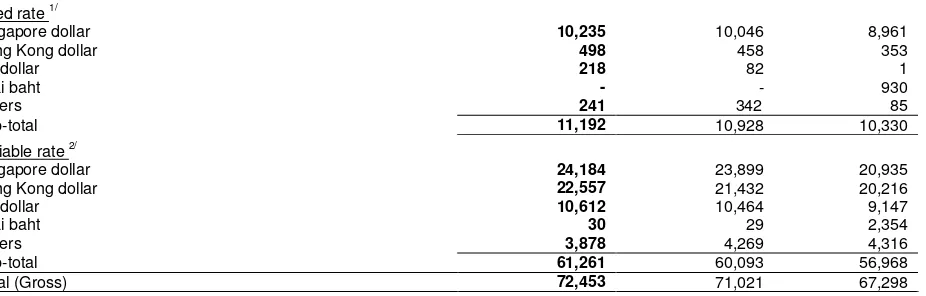
Cumulative Specific and General Provisions
Total cumulative specific and general provisions at end March 2005 were 201.6% of unsecured NPLs, and 90.0% of total NPLs.
Exhibit 3
Group Non-Performing Loans – by Loan Grading
Exhibit 4
Group Cumulative Specific and General Provisions
$ m 858 3,114 2,777 1,360 2,523 1,580 1,350 1,360 799 365 390 399 415 623 390 169 252 204 213
187 185 169 178
1,385 1,928 1,919 1,934 2,182 3,359 1,919 3,780 4,224 0 1,000 2,000 3,000 4,000 5,000
Dec 02 Dec 03 Dec 04 Mar 04 Jun 04 Sep 04 Dec 04 Mar 05
Loss Doubtful Substandard
1,736 2,500 2,387 1,701 2,271 1,819 1,752 1,701
120.7 124.0 132.4
156.4 182.5
59.2 63.2 88.6
67.6
83.3 90.6 90.0
186.4 201.6 186.4 88.6 0 1,000 2,000 3,000
Dec 02 Dec 03 Dec 04 Mar 04 Jun 04 Sep 04 Dec 04 Mar 05 0 100 200 300
SP GP SP+GP/Unsecured NPLs SP+GP/NPLs
[image:12.595.52.529.231.448.2]Restructured Loans
Table 7
Loans that were restructured and classified
Mar 31, 2005 Dec 31, 2004 Mar 31, 2004
In $ millions NPLs
Specific provisions NPLs Specific Provisions NPLs Specific provisions
Substandard 531 106 351 34 991 116
Doubtful 11 11 10 10 70 54
Loss 45 44 58 58 188 188
Total 587 161 419 102 1,249 358
Table 8
Group Customer Loans
In $ millions
Mar 31 2005
Dec 31 2004
Mar 31 2004
Gross 72,453 71,021 67,298
Less:
Specific provisions 570 554 1,019
General provisions 823 803 935
Net total 71,060 69,664 65,344
Excluding DTDB:
Gross 63,842
Less:
Specific provisions 660
General provisions 753
Net total 62,429
Analysed by Industry
Manufacturing 7,697 7,268 6,912
Building & Construction 8,725 6,902 7,941
Housing Loans 24,412 24,091 22,888
General Commerce 7,486 7,297 7,069
Transportation, Storage & Communications 5,203 5,259 5,090
Financial Institutions, Investment & Holding Companies 6,212 7,467 4,771 Professionals & Private Individuals (except Housing Loans) 7,047 7,038 7,305
Others 5,671 5,699 5,322
Total (Gross) 72,453 71,021 67,298
Excluding DTDB:
Manufacturing 5,993
Building & Construction 7,680
Housing Loans 22,523
General Commerce 6,353
Transportation, Storage & Communications 4,917
Financial Institutions, Investment & Holding Companies 4,710
Professionals & Private Individuals (except Housing Loans) 6,943
Others 4,723
Total (Gross) 63,842
Analysed by Currency and Fixed / Variable Rates Fixed rate 1/
Singapore dollar 10,235 10,046 8,961
Hong Kong dollar 498 458 353
US dollar 218 82 1
Thai baht - - 930
Others 241 342 85
Sub-total 11,192 10,928 10,330
Variable rate 2/
Singapore dollar 24,184 23,899 20,935
Hong Kong dollar 22,557 21,432 20,216
US dollar 10,612 10,464 9,147
Thai baht 30 29 2,354
Others 3,878 4,269 4,316
Sub-total 61,261 60,093 56,968
Total (Gross) 72,453 71,021 67,298
Notes:
Table 9
Total Group Deposits
In $ millions
Mar 31 2005
Dec 31 2004
Mar 31 2004
Deposits of non-bank customers 115,931 113,206 111,938
Deposits and balances of banks 13,708 10,939 14,062
Total 129,639 124,145 126,000
Excluding DTDB:
Deposits of non-bank customers 108,584
Deposits and balances of banks 13,869
Total 122,453
Table 10
Group Customer Deposits
In $ millions
Mar 31 2005
Dec 31 2004
Mar 31 2004
Analysed by Currency
Singapore dollar 65,046 62,052 61,254
US dollar 24,071 23,709 21,909
Hong Kong dollar 18,180 17,900 17,150
Thai baht 18 29 3,382
Others 8,616 9,516 8,243
Total 115,931 113,206 111,938
Analysed by Product
Savings accounts (include S$ autosave) 48,823 49,697 49,361
Current accounts 13,077 11,694 12,890
Fixed deposits 48,839 45,767 44,403
Other deposits 5,192 6,048 5,284
Capital Adequacy Ratio
Exhibit 5
Group Capital Adequacy Ratio
11.3 10.9
4.0 4.5 4.4
10.3 10.5 11.3 10.4 11.6 11.8
4.6 4.5 4.1
5.2 3.6
15.5 15.1 15.8
14.5 15.6 15.4 15.8 15.3
0 5 10 15 20 Dec 02 Dec 03 Dec 04 Mar 04 Jun 04 Sep 04 Dec 04 Mar 05
Tier 1 Tier 2
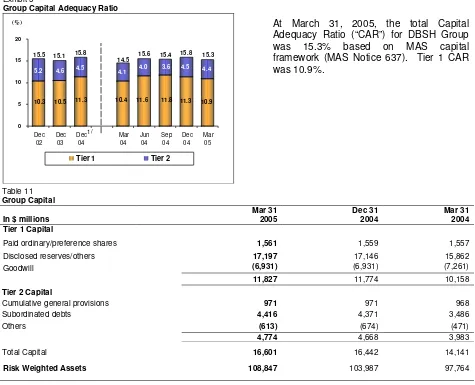
[image:15.595.53.528.92.477.2]At March 31, 2005, the total Capital Adequacy Ratio (“CAR”) for DBSH Group was 15.3% based on MAS capital framework (MAS Notice 637). Tier 1 CAR was 10.9%.
Table 11 Group Capital
In $ millions
Mar 31 2005 Dec 31 2004 Mar 31 2004 Tier 1 Capital
Paid ordinary/preference shares 1,561 1,559 1,557
Disclosed reserves/others 17,197 17,146 15,862
Goodwill (6,931) (6,931) (7,261)
11,827 11,774 10,158
Tier 2 Capital
Cumulative general provisions 971 971 968
Subordinated debts 4,416 4,371 3,486
Others (613) (674) (471)
4,774 4,668 3,983
Total Capital 16,601 16,442 14,141
Risk Weighted Assets 108,847 103,987 97,764
Note:
1/ With effect from 2004, ratios were computed based on MAS Notice 637. Comparatives for 2003 and before were not restated and were computed using the Bank for International Settlements (“BIS”) guidelines.
Unrealised Valuation Surpluses
Table 12
Group Unrealised Valuation Surpluses
In $ millions
Mar 31 2005 Dec 31 2004 Mar 31 2004
Properties 734 653 438
Quoted investments 60 531 672
Total 794 1,184 1,110
Unrealised valuation surpluses in properties and quoted investment securities not recognised in the financial statements amounted to $0.8 billion at end March 2005. The decline in the surpluses in quoted investments was mainly due to the recognition of fair value changes in available-for-sale investments in balance sheet reserves with the adoption of FRS 39 in first quarter 2005.
(%)
[image:15.595.54.526.561.623.2]Geographical Segment Analysis
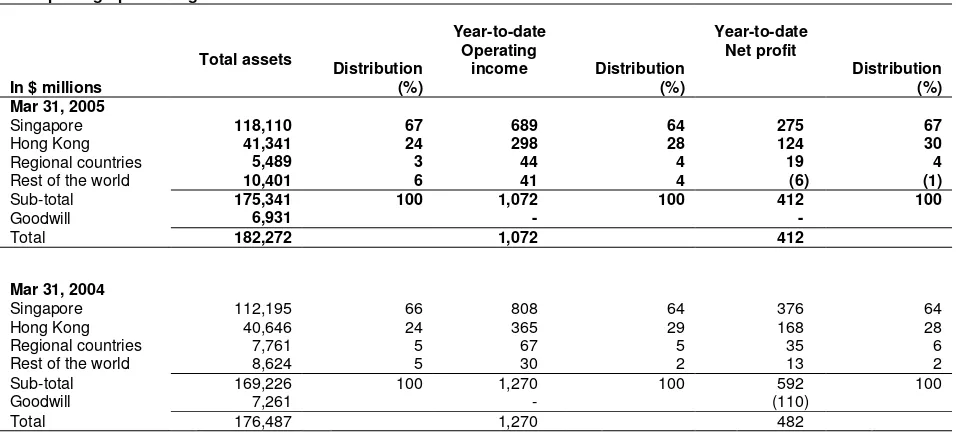
[image:16.595.51.529.176.393.2]The following table analyses total assets, operating income and net profit by geographical segments. Unless otherwise stated, the analysis of geographical segments is generally based on the location of the office recording the transactions. The total assets, operating income and net profit are stated after elimination of inter-group assets and revenues.
Table 13
Group Geographical Segments
In $ millions
Total assets
Distribution (%)
Year-to-date Operating
income Distribution
(%)
Year-to-date Net profit
Distribution (%) Mar 31, 2005
Singapore 118,110 67 689 64 275 67
Hong Kong 41,341 24 298 28 124 30
Regional countries 5,489 3 44 4 19 4
Rest of the world 10,401 6 41 4 (6) (1)
Sub-total 175,341 100 1,072 100 412 100
Goodwill 6,931 -
-Total 182,272 1,072 412
Mar 31, 2004
Singapore 112,195 66 808 64 376 64
Hong Kong 40,646 24 365 29 168 28
Regional countries 7,761 5 67 5 35 6
Rest of the world 8,624 5 30 2 13 2
Sub-total 169,226 100 1,270 100 592 100
Goodwill 7,261 - (110)
Total 176,487 1,270 482
DBSH Group operates in four main geographical areas :
• “Singapore”,which includes the operations of the Asian Currency Unit.
• “Hong Kong”, which includes branch and subsidiary operations in Hong Kong.
• “Regional countries”, which includes branch and subsidiary operations in Malaysia, Indonesia, Thailand, South Korea and the Philippines.
Business Segment Analysis
The business segment results represent the customer segments of the respective businesses and are determined by:
• Income and direct expenses attributable to each customer and other segment; and
• Management accounting policies relating to the allocation of indirect expenses and funds transfer pricing between the central treasury unit and customer/other segments.
The various customer segments are described below, along with a description of the change in net profit after taxation for first quarter 2005 over first quarter 2004.
• Consumer Banking
Consumer Banking provides individual customers with a diverse range of banking and related financial services. The products and services offered to customers include current and savings accounts, loans and home finance, cards, payments and investment products.
The increase in net profit after taxation ($30 million, 25%) was mainly due to higher net interest income resulting from increased deposit volumes and better deposit margins.
• Enterprise Banking
Enterprise Banking provides financial services and products to small and medium-sized businesses. The products and services offered to customers include credit facilities (overdraft, factoring/accounts receivable purchase, trade services and financing, commercial/industrial property financing, hire purchase and government financing and assistance schemes), deposit, payment and collection services and treasury products.
The increase in net profit after taxation ($5 million, 6%) was mainly attributable to strong loan and deposit growth and lower provisions from improved asset quality.
• Corporate and Investment Banking
Corporate and Investment Banking provides tailored and unique financial solutions to large corporate and institutional clients. The products and services offered to customers include direct lending, corporate finance and advisory banking services for mergers and acquisitions, capital raising through debt and equity markets, capital restructuring, syndicated finance, securities and fiduciary services, cash management and trade services, and private equity.
The decrease in net profit after taxation ($37 million, 35%) was mainly due to higher provisions including general provisions on higher customer loan volumes.
• Global Financial Markets
Global Financial Markets provides treasury services to corporations, institutional and private investors, financial institutions and other market participants. It is primarily involved in market making, structuring, equity and debt sales and trading across a broad range of financial products including foreign exchange, interest rate/credit/equity and other structured derivatives. Income from financial products and services relating to other customer segments, e.g. Consumer Banking, Enterprise Banking and Corporate and Investment Banking, is reflected in the respective customer segments.
Global Financial Markets also provides equity services through DBS Vickers Securities (“DBSV”). DBSV offers a wide range of services including research, sales and trading for institutional, corporate and private clients and share placement.
The other segments of the analysis are:
• Central Treasury Unit
Central Treasury Unit is responsible for the management of the Group's asset and liability interest rate positions and investment of the Group's excess liquidity and shareholders’ funds.
The decrease in net profit after taxation ($40 million, 49%) was due to lower gapping income resulting from flattening of interest rate yield curves and first quarter 2004 benefiting from profit on sales of bonds.
• Central Operations
Central Operations encompasses a range of activities resulting from central corporate decisions and the related income and expenses not attributed to business segments. These include funding costs of DBSH Group’s associated and subsidiary companies and gains/losses on properties. Private banking activities and asset management activities are included in this segment.
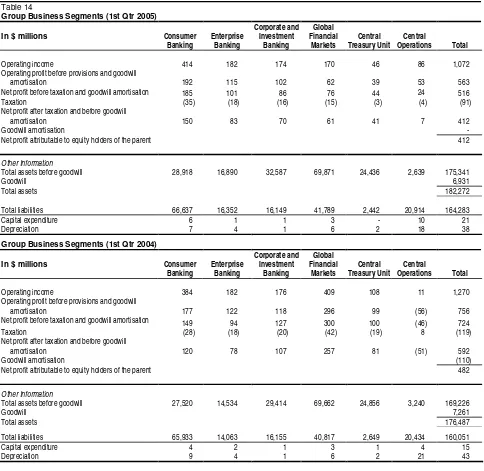
[image:18.595.46.530.247.718.2]The following table analyses the results, total assets and total liabilities by business segments: Table 14
Group Business Segments (1st Qtr 2005)
In $ millions Consumer
Banking
Enterprise Banking
Corporate and Investment
Banking
Global Financial
Markets
Central Treasury Unit
Central
Operations Total
Operating income 414 182 174 170 46 86 1,072
Operating profit before provisions and goodwill
amortisation 192 115 102 62 39 53 563
Net profit before taxation and goodwill amortisation 185 101 86 76 44 24 516
Taxation (35) (18) (16) (15) (3) (4) (91)
Net profit after taxation and before goodwill
amortisation 150 83 70 61 41 7 412
Goodwill amortisation
-Net profit attributable to equity holders of the parent 412
Other Information
Total assets before goodwill 28,918 16,890 32,587 69,871 24,436 2,639 175,341
Goodwill 6,931
Total assets 182,272
Total liabilities 66,637 16,352 16,149 41,789 2,442 20,914 164,283
Capital expenditure 6 1 1 3 - 10 21
Depreciation 7 4 1 6 2 18 38
Group Business Segments (1st Qtr 2004)
In $ millions Consumer
Banking
Enterprise Banking
Corporate and Investment
Banking
Global Financial
Markets
Central Treasury Unit
Central
Operations Total
Operating income 384 182 176 409 108 11 1,270
Operating profit before provisions and goodwill
amortisation 177 122 118 296 99 (56) 756
Net profit before taxation and goodwill amortisation 149 94 127 300 100 (46) 724
Taxation (28) (18) (20) (42) (19) 8 (119)
Net profit after taxation and before goodwill
amortisation 120 78 107 257 81 (51) 592
Goodwill amortisation (110)
Net profit attributable to equity holders of the parent 482
Other Information
Total assets before goodwill 27,520 14,534 29,414 69,662 24,856 3,240 169,226
Goodwill 7,261
Total assets 176,487
Total liabilities 65,933 14,063 16,155 40,817 2,649 20,434 160,051
Capital expenditure 4 2 1 3 1 4 15
Depreciation 9 4 1 6 2 21 43
DBS GROUP HOLDINGS LTD AND ITS SUBSIDIARY COMPANIES
Unaudited Consolidated Profit and Loss Account
1/In $ millions
1st Qtr 2005
1st Qtr 2004
+/(-) %
4th Qtr 2004
+/(-) %
Interest income 1,174 952 23 1,077 9
Less: Interest expense 510 318 60 441 16
Net interest income 664 634 5 636 4
Fee and commission income 253 281 (10) 254 (0)
Dividend income 5 5 - 9 (44)
Rental income 8 8 - 8
-Other income 142 342 (58) 120 18
Operating income 1,072 1,270 (16) 1,027 4
Less: Staff costs 265 257 3 259 2
Depreciation 38 43 (12) 33 15
Other operating expenses 206 214 (4) 249 (17)
Goodwill amortisation - 110 (100) 110 (100)
Operating expenses 509 624 (18) 651 (22)
Operating profit before provisions 563 646 (13) 376 50
Less: Provision for loan losses and diminution in value of other assets 62 50 24 (31) NM
Operating profit 501 596 (16) 407 23
Add: Share of profits less losses of associated and joint venture
companies 15 18 (17) 15
-Net profit before taxation 516 614 (16) 422 22
Less: Taxation 87 115 (24) 89 (2)
Share of taxation of associated and joint venture companies 4 4 - 4
-Net profit after taxation 425 495 (14) 329 29
Attributable to:
Equity holders of the parent 412 482 (15) 316 30
Minority interest 13 13 - 13
-425 495 (14) 329 29
NM: Not meaningful Note:
DBS GROUP HOLDINGS LTD AND ITS SUBSIDIARY COMPANIES
Unaudited Consolidated Balance Sheet as at
1/Mar 31 Dec 31 Mar 31
In $ millions 2005 2004 2004
Equity Attributable to Equity Holders of the Parent
Share capital 1,561 1,559 1,557
Share premium account 2,223 2,208 2,178 Treasury shares (117) (126) (132) Non-distributable reserves 6,716 6,628 6,509 Revenue reserve 6,465 6,153 5,186
16,848 16,422 15,298
Minority Interests 1,141 1,128 1,138
TOTAL EQUITY 17,989 17,550 16,436
LIABILITIES
Deposits and balances of banks 13,708 10,939 14,062 Deposits and other accounts of
non-bank customers 115,931 113,206 111,938
Bills payable 390 350 738
Current taxation 688 631 603
Deferred tax liabilities 61 63 94 Other liabilities 19,074 18,833 20,904 Other borrowings and debt
securities in issue 2/ 7,706 7,533 6,089
- due within one year 3,045 3,054 2,051 - due after one year 4,661 4,479 4,038
Subordinated term debts
(unsecured) 6,725 6,364 5,623
- due within one year - - 25
- due after one year 6,725 6,364 5,598
TOTAL EQUITY AND LIABILITIES 182,272 175,469 176,487
OFF BALANCE SHEET ITEMS
Contingent liabilities 7,633 8,529 7,296
Commitments 75,964 70,774 68,612
Financial derivatives 1,570,828 1,518,507 1,413,541
Notes:
1/ Figures for prior periods have been restated to reflect the adoption of new and revised accounting standards (Appendix VI, note 5).
2/ Includes secured amount of $1,826 million as at March 31, 2005 (December 31, 2004: $1,814 million; March 31, 2004: $1,385 million). These are mainly secured by properties and securities.
Mar 31 Dec 31 Mar 31
In $ millions 2005 2004 2004
ASSETS
Cash, and balances and
placements with central banks 9,935 10,479 11,987 Singapore Government securities
and treasury bills 11,470 11,194 13,192 Trading securities 14,347 11,695 11,142 Balances, placements with, and
loans and advances to banks 27,851 25,168 26,977 Bills receivable from non-bank
customers 2,629 2,333 2,185
Loans and advances to non-bank
customers 68,431 67,331 63,159
Investment securities 24,420 24,208 23,711 Associated and joint venture
companies 541 517 543
Goodwill 6,931 6,931 7,261
Fixed assets 1,785 1,798 1,958
Deferred tax assets 91 103 119
Other assets 13,841 13,712 14,253
DBS GROUP HOLDINGS LTD AND ITS SUBSIDIARY COMPANIES
Unaudited Balance Sheet of DBS Group Holdings Ltd as at
1/Mar 31 Dec 31 Mar 31
In $ millions 2005 2004 2004
EQUITY
Share capital 1,561 1,559 1,557 Share premium account 2,223 2,208 2,178 Capital redemption reserve 28 28 28 Share option plan reserve 37 35 16 Revenue reserve 2,999 3,000 3,001
TOTAL EQUITY 6,848 6,830 6,780
LIABILITIES
Current liabilities 5 5 9
Deferred tax liabilities # # #
TOTAL EQUITY AND
LIABILITIES 6,853 6,835 6,789
Other Information
Net asset value per ordinary share ($)
4.54 4.50 4.49
(i) Based on existing ordinary share capital
(ii) Assuming non-voting convertible preference shares (“CPS”) and non-voting redeemable CPS are
converted to ordinary shares 4.39 4.36 4.34
Notes:
1/ Figures for prior periods have been restated to reflect the adoption of new and revised accounting standards (Appendix VI, note 5). 2/ #: Insignificant
Mar 31 Dec 31 Mar 31
In $ millions 2005 2004 2004
ASSETS
Balances, placements with, and loans and advances to non-bank
customers 3 3 3
Subsidiary companies 6,850 6,832 6,786
DBS GROUP HOLDINGS LTD AND ITS SUBSIDIARY COMPANIES
Unaudited Consolidated Statement of Changes in Shareholders' Equity
2/In $ millions
Share Capital
Share Premium
Treasury Shares
Non-distributable Reserves
Revenue Reserve
Minority
Interests Total Equity
Balance at January 1, 2005 1,559 2,208 - 6,585 6,150 1,128 17,630
Adjustment due to change in
accounting policy (126) 43 3 (80)
Balance at January 1, 2005
(restated) 1,559 2,208 (126) 6,628 6,153 1,128 17,550
On adoption of FRS 39 at January
1, 2005 292 (100) 192
Exercise of share options pursuant
to the DBSH Share Option Plan 2 13 15
Net exchange translation
adjustments during the period 6 6
Share of associated companies’
Capital Reserves 2 2
Cost of share-based payments 2 9 (1) 10
Net unrealised loss on financial
instruments (211) (211)
Net profit after taxation 412 13 425
Balance at March 31, 2005 1,561 1/ 2,223 (117) 6,716 6,465 1,141 17,989
Balance at January 1, 2004 1,556 2,171 - 6,499 4,670 1,125 16,021
Adjustment due to change in
accounting policy (138) 11 34 (93)
Balance at January 1, 2004
(restated) 1,556 2,171 (138) 6,510 4,704 1,125 15,928
Exercise of share options pursuant
to the DBSH Share Option Plan 1 7 8
Net exchange translation
adjustments during the period (9) (9)
Cost of share-based payments 6 8 14
Net profit after taxation 482 13 495
DBS GROUP HOLDINGS LTD AND ITS SUBSIDIARY COMPANIES
Unaudited Statement of Changes in Shareholders' Equity of DBS Group Holdings Ltd
2/In $ millions
Share Capital
Share Premium
Share Option Plan Reserve
Capital Redemption Reserve
Revenue Reserve
Total Equity
Balance at January 1, 2005 1,559 2,208 - 28 3,000 6,795
Adjustment due to change in accounting policy 35 35
Balance at January 1, 2005 (restated) 1,559 2,208 35 28 3,000 6.830
Exercise of share options pursuant to the DBSH Share Option
Plan 2 13 15
Cost of share-based payments 2 2 4
Net profit after taxation (1) (1)
Balance at March 31, 2005 1,5611/ 2,223 37 28 2,999 6,848
Balance at January 1, 2004 1,556 2,171 - 28 3,001 6,756
Adjustment due to change in accounting policy 9 9
Balance at January 1, 2004 (restated) 1,556 2,171 9 28 3,001 6,765
Exercise of share options pursuant to the DBSH Share Option
Plan 1 7 8
Cost of share-based payments 7 7
Net profit after taxation # #
Balance at March 31, 2004 1,557 2,178 16 28 3,001 6,780
Notes:
1/ During the financial period ended March 31, 2005, DBSH issued 1,226,690 ordinary shares upon the exercise of options granted pursuant to the DBSH Share Option Plan. 2/ Figures for prior periods have been restated to reflect the adoption of new and revised accounting standards (Appendix VI, note 5).
DBS GROUP HOLDINGS LTD AND ITS SUBSIDIARY COMPANIES
Unaudited Consolidated Cash Flow Statement
1/In $ millions
1st Qtr 2005
1st Qtr 2004
Cash flows from operating activities
Net profit before taxation 516 614
Adjustments for non-cash items:
Provision for possible loan losses and diminution in value of other assets 62 50
Depreciation of fixed assets 38 43
Goodwill amortisation - 110
Share of profits of associated and joint venture companies (15) (18)
Net gain on disposal of fixed assets (3) (2)
Net gain on disposal of investment securities (25) (86)
Operating profit before changes in operating assets & liabilities 573 711
Increase in:
Deposits and other accounts of non-bank customers 2,725 3,897
Deposits and balances of banks 2,769 6,565
Other liabilities including bills payable 277 5,469
(Increase)/Decrease in:
Singapore Government securities and treasury bills (276) (1,754)
Trading securities (2,652) (4,709)
Accounts receivable and other assets (173) (2,142)
Balances, placements with, and loans and advances to other banks (2,683) 493 Loans and advances to non-bank customers including bills receivable (1,456) (1,041)
Net cash (used in)/generated from operating activities (1) (896) 7,489
Cash flows from investing activities
Dividends from associated companies 11 9
Purchase of fixed assets (21) (15)
Net increase in investment securities (201) (939)
Proceeds from disposal of fixed assets 4 22
Net cash used in investing activities (2) (207) (923)
Cash flows from financing activities
Increase in share capital and share premium 17 8
Net increase in debt securities and borrowings 534 415
Net cash generated from financing activities (3) 551 423
Exchange translation adjustments (4) 8 (9)
Net change in cash, and balances and placements with central banks (1)+(2)+(3)+(4) (544) 6,980
Cash, and balances and placements with central banks as at January 1 10,479 5,007
Cash, and balances and placements with central banks as at March 31 9,935 11,987
Note:
DBS GROUP HOLDINGS LTD AND ITS SUBSIDIARY COMPANIES
Selected Notes to the Accounts
1. Issuance of Ordinary Shares
There were 1,492,730,436 issued and fully paid-up ordinary shares at December 31, 2004. During the quarter ended March 31, 2005, 1,226,690 ordinary shares were issued upon the exercise of executive share options, bringing the total outstanding number of ordinary shares to 1,493,957,126 at March 31, 2005. The weighted average number of ordinary shares was 1,493,263,408 for the quarter ended March 31, 2005.
Details of issue of new ordinary shares of $1.00 each are as follows:
Particulars
Number of new ordinary shares issued between
January 1, 2005 and March 31, 2005
Number of new ordinary shares that would have been issued upon the conversion/exercise of all outstanding non-voting convertible preference
shares (“CPS”)/non-voting redeemable CPS/executive share options
Mar 31, 2005 Dec 31, 2004 Mar 31, 2004
Conversion of non-voting CPS - 120,436 120,436 120,436
Conversion of non-voting redeemable CPS - 66,475,374 66,475,374 66,475,374
Exercise of executive share options 1,226,690 47,944,623 46,749,383 52,018,883
2.
Loan and Investment Exposures to Malaysia, Indonesia, Thailand, Korea, The
Philippines (Regional Countries), Hong Kong and China
At March 31, 2005, DBSH Group has exposures to certain countries in the Asia Pacific Region. The exposures are determined based on the location of the credit risk of the customers and counter-parties regardless of where the transactions are booked.
The Group’s net exposure in the 5 Regional Countries was $13.1 billion at March 31, 2005. Exposure to the 5 Regional Countries amounted to 7.2% of the Group’s Total Assets.
The DBSH Group’s exposures (assets and non-performing loans) to the Regional Countries, Hong Kong and China at March 31, 2005 are as follows:
Loans and debt securities Net Exposure
In $ millions
Assets in Bank
Central Banks &
Govt. Securities
Non-Bank 1/ Investments
Less: Intercompany
Loans/ Investments in
Financial Subsidiaries/
Overseas
Branches Amount
As a % of Total
Assets NPLs2/
(a) (b) (c) (d) (e) (f)=(a+b (g)
+c+d-e)
Total Regional Countries 6,880 2,082 4,956 1,449 2,290 13,077 7.2% 198
Malaysia 2,303 258 1,994 81 1,423 3,213 1.8% 139
DBS GROUP HOLDINGS LTD AND ITS SUBSIDIARY COMPANIES
2.
Loan and Investment Exposures to Malaysia, Indonesia, Thailand, Korea, The
Philippines (Regional Countries), Hong Kong and China (Continued)
The DBSH Group’s exposures (assets and non-performing loans) to the Regional Countries, Hong Kong and China at December 31, 2004 are as follows:
Loans and debt securities Net Exposure
In $ millions
Assets in Bank
Central Banks &
Govt. Securities
Non-Bank 1/
Investments
Less: Intercompany
Loans/ Investments in
Financial Subsidiaries/
Overseas
Branches Amount
As a % of Total
Assets NPLs2/
(a) (b) (c) (d) (e) (f)=(a+b (g)
+c+d-e)
Total Regional Countries 6,092 1,999 3,808 1,307 2,137 11,069 6.3% 195
Malaysia 2,064 255 1,794 81 1,357 2,837 1.6% 136
Indonesia 464 285 673 68 165 1,325 0.7% 25 Thailand 184 49 81 406 39 681 0.4% 34 Korea 3,194 1,230 1,144 18 575 5,011 2.9% -The Philippines 186 180 116 734 1 1,215 0.7% # Hong Kong 3,628 2,500 24,842 11,323 13,431 28,862 16.5% 471
China 2,114 73 1,137 66 821 2,569 1.5% 71
TOTAL 11,834 4,572 29,787 12,696 16,389 42,500 24.2% 737
The DBSH Group’s exposures (assets and non-performing loans) to the Regional Countries, Hong Kong and China at March 31, 2004 are as follows:
Loans and debt securities Net Exposure
In $ millions
Assets in Bank
Central Banks &
Govt. Securities
Non-Bank 1/
Investments
Less: Intercompany
Loans/ Investments in
Financial Subsidiaries/
Overseas
Branches Amount
As a % of Total
Assets NPLs2/
(a) (b) (c) (d) (e) (f)=(a+b (g)
+c+d-e)
Total Regional Countries 4,885 1,585 6,909 933 1,762 12,550 7.1% 1,386
Malaysia 1,154 35 1,362 88 1,015 1,624 0.9% 212
Indonesia 223 181 524 71 202 797 0.4% 36
Thailand (excluding DTDB) 265 17 143 63 217 271 0.2% 186
Korea 3,185 834 1,294 2 327 4,988 2.8%
-The Philippines 43 184 96 561 1 883 0.5% 5
DTDB 3/ 15 334 3,490 148 - 3,987 2.3% 947
Hong Kong 3,742 3,006 23,668 11,796 13,724 28,488 16.1% 584
China 1,202 32 991 56 502 1,779 1.0% 118
TOTAL 9,829 4,623 31,568 12,785 15,988 42,817 24.2% 2,088
Notes:
1/ Non-bank loans include loans to government and quasi-government entities.
DBS GROUP HOLDINGS LTD AND ITS SUBSIDIARY COMPANIES
3. Non-Performing Loans and Provisions
At March 31, 2005, DBSH Group’s total non-performing loans (“NPLs”) amounted to $1.928 billion. Out of the total NPLs of $1.928 billion, $1.067 billion (55%) were secured by collateral.
Details of DBSH Group’s NPLs and provisions at March 31, 2005 are as follows:
In $ millions Singapore
Hong Kong
Regional Countries2/
Other
Countries Total
Non-Performing Loans 979 457 198 294 1,928
- Substandard 689 333 121 242 1,385
- Doubtful 95 54 2 27 178
- Loss 195 70 75 25 365
NPLs as a % of Group total assets 0.5% 0.3% 0.1% 0.2% 1.1%
Non-bank NPLs as a % of non-bank loans in the
respective countries 1/ 2.3% 1.8% 4.0% 4.9% 2.4%
Total Cumulative Provisions 936 448 171 181 1,736
- Specific provisions 384 152 94 70 700
- General provisions 552 296 77 111 1,036
Total Cumulative Provisions as a % of:
- Group total assets 0.5% 0.2% 0.1% 0.1% 1.0%
- NPLs in the respective countries 96% 98% 87% 61% 90%
- Unsecured NPLs in the respective countries 215% 265% 162% 120% 202%
Details of DBSH Group’s NPLs and provisions at December 31, 2004 are as follows:
In $ millions Singapore
Hong Kong
Regional Countries2/
Other
Countries Total
Non-Performing Loans 958 471 195 295 1,919
- Substandard 674 341 107 238 1,360
- Doubtful 80 51 - 38 169
- Loss 204 79 88 19 390
NPLs as a % of Group total assets 0.5% 0.3% 0.1% 0.2% 1.1%
Non-bank NPLs as a % of non-bank loans in the
respective countries 1/ 2.2% 2.0% 5.6% 5.0% 2.5%
Total Cumulative Provisions 905 443 155 198 1,701
- Specific provisions 359 159 92 76 686
- General provisions 546 284 63 122 1,015
Total Cumulative Provisions as a % of:
- Group total assets 0.5% 0.3% 0.1% 0.1% 1.0%
- NPLs in the respective countries 94% 94% 80% 67% 89%
- Unsecured NPLs in the respective countries 221% 257% 149% 87% 186%
Notes:
DBS GROUP HOLDINGS LTD AND ITS SUBSIDIARY COMPANIES
3. Non-Performing Loans and Provisions (Continued)
Details of DBSH Group’s NPLs and provisions at March 31, 2004 are as follows:
Regional Countries2/
In $ millions Singapore
Hong
Kong DTDB 3/ Others
Other
Countries Total
Non-Performing Loans 1,060 584 947 439 329 3,359
- Substandard 766 432 761 302 262 2,523
- Doubtful 68 37 22 46 40 213
- Loss 226 115 164 91 27 623
NPLs as a % of Group total assets 0.6% 0.3% 0.5% 0.3% 0.2% 1.9%
Non-bank NPLs as a % of non-bank loans
in the respective countries 1/ 2.7% 2.6% 26.1% 14.7% 7.8% 4.6%
Total Cumulative Provisions 765 413 541 383 169 2,271
- Specific provisions 388 180 359 184 88 1,199
- General provisions 377 233 182 199 81 1,072
Total Cumulative Provisions as a % of:
- Group total assets 0.5% 0.2% 0.3% 0.2% 0.1% 1.3%
- NPLs in the respective countries 72% 71% 57% 87% 51% 68%
- Unsecured NPLs in the respective countries 191% 197% 118% 116% 54% 132%
Notes:
1/ Computed based on total non-bank customer NPLs (excluding non-performing debt securities and contingent items) divided by total gross non-bank customer loans. 2/ Regional countries include Malaysia, Indonesia, Thailand, Korea and the Philippines
3/ Includes special general provision for regional exposures and additional specific provision for DBS Thai Danu Public Company Limited (“DTDB”)’s loans.
Analysis of Non-Performing Loans by Industry
The following table shows the industry breakdown of the non-performing loans of DBSH Group:
March 31, 2005 December 31, 2004 March 31, 2004
In $ millions NPLs
Specific
Provisions NPLs
Specific
Provisions NPLs
Specific Provisions
Customer loans
Manufacturing 406 172 365 175 802 324
Building and Construction 177 55 237 58 354 87
Housing Loans 242 67 253 67 307 83
General Commerce 238 98 186 75 500 254
Transportation, Storage and
Communications 25 9 27 10 73 9
Financial Institutions, Investment and
Holding Companies 193 56 201 58 145 51
Professionals and Private Individuals
(except Housing Loans) 245 108 239 105 280 127
Others 244 72 255 78 635 153
Sub-total 1,770 637 1,763 626 3,096 1,088
Debt securities 138 53 138 52 172 78
Contingent items 20 10 18 8 91 33
DBS GROUP HOLDINGS LTD AND ITS SUBSIDIARY COMPANIES
3. Non-Performing Loans and Provisions (Continued)
Analysis of Non-Performing Loans by Period Overdue
In $ millions March 31, 2005 December 31, 2004 March 31, 2004
Non-default 800 744 1,427
Default loans 1,128 1,175 1,932
Less than 3 months 303 339 477
3 to 6 months 143 157 223
Over 6 months 682 679 1,232
DBS GROUP HOLDINGS LTD AND ITS SUBSIDIARY COMPANIES
4. Daily Earnings at Risk and Trading Income
The Group uses a Daily Earnings at Risk (“DEaR”) measure as one mechanism for controlling trading risk. The DEaR is calculated using a one-day time horizon and a 99% confidence interval. The following table shows the period-end, average, high and low DEaR for the trading risk exposure of the DBSH Group for the period from April 1, 2004 to March 31, 2005.
April 1, 2004 to March 31, 2005 In $ millions As at March 31, 2005 Average High 1/ Low 1/
Interest rate 28.4 29.2 39.8 22.9
FX 8.0 6.2 15.6 2.7
Equity 6.4 6.2 14.6 3.1
Diversification effect (15.8) (14.6) -
-Total 27.0 27.0 38.4 20.7
Note:
1/ The high (& low) DEaR figures reported for each risk class did not necessarily occur on the same day as the high (& low) reported for total. A corresponding diversification effect cannot be calculated and is therefore omitted from the table.
The charts below provide the range of DEaR and the daily distribution of trading income in the trading portfolio for the period from April 1, 2004 to March 31, 2005.
Daily Distribution of Group Trading Income
0 5 10 15 20 25 30 35 40 45 50
No. of days
Gr ou p D Ea R for Tr a din g Book
0 5 10 15 20 25 30 35 40 45 > 1 8 -1 9 > 1 9 -2 0 > 2 0 -2 1 > 2 1 -2 2 > 2 2 -2 3 > 2 3 -2 4 > 2 4 -2 5 > 2 5 -2 6 > 2 6 -2 7 > 2 7 -2 8 > 2 8 -2 9 > 2 9 -3 0 > 3 0 -3 1 > 3 1 -3 2 > 3 2 -3 3 > 3 3 -3 4 > 3 4 -3 5 > 3 5 -3 6 > 3 6 -3 7 > 3 7 -3 8 > 3 8 -3 9 > 3 9 -4 0
D Ea R ( $ m illion s)
DBS GROUP HOLDINGS LTD AND ITS SUBSIDIARY COMPANIES
5.
Adoption of New and Revised Accounting Standards
Financial Reporting Standards (“FRS”) 39, Financial Instruments: Recognition and Measurement
The implementation of FRS 39 had a significant impact on certain financial assets and liabilities. An opening adjustment was made, representing unrealised gains or losses on certain financial assets and financial liabilities including derivatives to be measured at fair value on January 1, 2005. The differences between carrying amount and fair value were adjusted to revaluation and revenue reserves.
FRS 39 is applied prospectively, and the comparative figures for 2004 are not restated as prescribed by the Standard. On January 1, 2005, the following transitional adjustments were made:
In $ millions
Revaluation reserves as at
January 1, 2005
Revenue reserves as at
January 1,
2005 Total
+/(-) $’m $’m $’m
Fair valuation of:
- Investments (bonds and equities) 292 29 321
- Derivatives - (123) (123)
292 (94) 198
Hedge accounting - (6) (6)
292 (100) 192
Note:
1/ Figures above are shown net of taxes.
FRS 102, Share-based Payment
FRS 102 requires an expense to be recognised where DBSH Group pays for goods or services using shares or other equity instruments (equity-settled transactions), or using other assets equivalent in value to a given number of shares or other equity instruments (cash-settled transactions).
DBSH Group is required to expense off share options and shares awarded to staff and directors under its share-based incentive plans (namely DBSH Share Option Plan; DBSH Performance Share Plan; DBSH Employee Share Plan) with a corresponding increase in equity. This resulted in reductions of $10 million and $32 million to revenue reserves, and increases in equity by $11 million and $43 million as at January 1, 2004 and as at January 1, 2005 respectively.
FRS 103, Business Combinations
The effect of the adoption of FRS 103 is that upon acquisition of subsidiaries or business undertakings, DBSH Group will include items like intangible assets and contingent liabilities as part of the identifiable assets and liabilities acquired, at their fair values as at the acquisition date. There were no major acquisitions by DBSH Group in first quarter 2005.
DBS GROUP HOLDINGS LTD AND ITS SUBSIDIARY COMPANIES
Interpretation of FRS (“INT FRS”) 12, Consolidation – Special Purpose Entities
The revised INT FRS 12 has been amended to mandate the consolidation of employee benefit trusts set up for the purpose of an entity’s share-based payment arrangement(s). Arising from consolidation of these trusts, the DBSH shares held by the trusts will be accounted for as “Treasury Shares” in accordance with FRS 32 “Financial Instruments: Disclosure and Presentation”. The impact of INT FRS 12 is as follows:
• the reversal of prior period provisions on Treasury Shares of $44 million and $35 million in revenue reserves as at January 1, 2004 and January 1, 2005 respectively.
• the recognition of $126 million of DBSH Group Holdings Ltd shares held by the employee benefit trusts for the purposes of DBSH Group’s Performance Share Plan and Employee Share Plan as at January 1, 2005 (January 1, 2004: $138 million). These shares are netted against the equity of DBSH Group.
FRS 1, Presentation of Financial Statements
The revised FRS 1 requires disclosure on the face of the income statement of the following:
• the profit or loss for the period, and
• the allocation of this amount between that attributable to minority interest and that attributable to equity holders of the parent.
A similar requirement has been added for the statement of changes in equity. FRS 1 also requires disclosure, on the face of the statement of changes in equity, of total income and expenses for the period, showing separately the amounts attributable to equity holders of the parent and to minority interest.