To: Shareholders
The DBS Group Holdings Ltd (“DBSH” or “the Company”) Board of Directors report unaudited financial results for the second quarter ended June 30, 2004.
The Directors have declared a gross interim dividend of 18 cents for each DBSH non-voting convertible preference share (“CPS”), each DBSH non-voting redeemable CPS, and for each DBSH ordinary share. All interim dividends will be paid less 20% Singapore income tax. Details of the interim dividends in respect of the first half of the financial year ended June 30 are as follows:
In $ millions 2004 2003
DBSH Non-voting CPS
Interim dividend of 18 cents less 20% tax (2003: 14 cents less 22% tax) (a) 2
DBSH Non-voting redeemable CPS
Interim dividend of 18 cents less 20% tax (2003: 14 cents less 22% tax) 10 7
DBSH Ordinary share
Interim dividend of 18 cents less 20% tax (2003: 14 cents less 22% tax) 215 161
(a) Amounts under $500,000
The interim dividends will be payable on August 27, 2004. Notice is hereby given that the Share Transfer Books and Register of Members of the Company for ordinary shares will be closed from August 17, 2004 to August 18, 2004, both dates inclusive. Duly completed transfers received by the Company's Registrar, Barbinder & Co Pte Ltd of 8 Cross Street #11-00 PWC Building, Singapore 048424 up to 5.00 p.m. on August 16, 2004 will be registered to determine shareholders' entitlement to the interim dividends. In respect of ordinary shares in the securities accounts with The Central Depository (Pte) Limited (“CDP”), the interim dividends will be paid by DBSH to CDP, which will in turn distribute the dividend entitlements to shareholders.
By order of the Board Heng Lee Cheng (Ms) Group Secretary July 30, 2004 Singapore
Performance Summary
Contents
Page
Financial Highlights 2
Financial Review 3
Net Interest Income and Net Interest Margin 5
Non-Interest Income 6
Operating Expenses 7
Provision Charge 7
Balance Sheet 8
Asset Quality 8
Customer Loans 10
Deposits 11
Capital Adequacy Ratio 12
Unrealised Valuation Surpluses 12
Geographical Segment Analysis 13
Business Segment Analysis 14
Comparatives 15
Appendix I: Unaudited Consolidated Profit and Loss Account Appendix II: Unaudited Consolidated Balance Sheet
Appendix III: Unaudited Balance Sheet of DBS Group Holdings Ltd Appendix IV: Unaudited Statements of Changes in Shareholders’ Equity Appendix V: Unaudited Consolidated Cash Flow Statement
Appendix VI: Selected Notes to the Accounts 1. Issuance of Ordinary Shares
2. Loan and Investment Exposures to Malaysia, Indonesia, Thailand, Korea, The Philippines (Regional Countries), Hong Kong and China
3. Non-Performing Loans and Provisions 4. Financial Derivatives
Financial Highlights
DBS Group Holdings Ltd (“DBSH”) prepares its consolidated DBSH Group (“Group”) financial statements in accordance with Singapore Financial Reporting Standards (“FRS”).
On June 25, 2004, DBS Bank Ltd, a wholly owned subsidiary company of DBSH, disposed its 59% equity stake in DBS Thai Danu Bank Public Company Limited (“DTDB”) in exchange for a 16% interest in the Thai Military Bank Public Company Limited (“TMB”). At June 30, 2004, the financial statements of DBSH Group took into account the effect of this transaction and DTDB ceased to be consolidated as a subsidiary company of DBS Bank Ltd. The impact on the Group financial statements is summarised in Appendix VI Note 6.
In $ millions
2nd Qtr 2004
2nd Qtr 2003
+/(-) %
1st Qtr 2004
1st Half 2004
1st Half 2003
+/(-) % For the period
Operating income 1,553 984 58 1,266 2,819 2,032 39 Operating profit before goodwill amortisation
and provisions 1,071 525 104 763 1,834 1,131 62 Net profit before taxation 972 241 303 621 1,593 635 151 Net profit attributable to members 847 171 395 488 1,335 442 202 Net profit attributable to members (excluding
goodwill amortisation) 957 278 244 598 1,555 655 137
At period-end
Shareholders' funds 16,047 14,513 11 15,383 16,047 14,513 11 Interest bearing assets 141,290 134,165 5 147,542 141,290 134,165 5 Customer loans 1/ 65,053 62,714 4 65,344 65,053 62,714 4 Customer deposits 108,179 105,514 3 111,938 108,179 105,514 3 Total assets 168,182 158,501 6 176,574 168,182 158,501 6
Per share (in $)
Basic earnings excluding goodwill
amortisation 2/ 1.56 0.74 111 1.60 1.75 0.88 99 Basic earnings 2/ 1.26 0.45 180 1.31 1.45 0.59 146 Diluted earnings 2/ 1.22 0.44 177 1.26 1.40 0.57 146 Net asset value at period-end
(i) based on existing ordinary share capital 10.47 9.49 10 10.03 10.47 9.49 10 (ii) assuming non-voting convertible
preference shares (“CPS”) and non-voting redeemable CPS are converted to
ordinary shares 10.31 9.33 11 9.88 10.31 9.33 11
Performance ratios
(%)
2nd Qtr 2004
2nd Qtr 2003
1st Qtr 2004
1st Half 2004
1st Half 2003 On a GAAP basis
Return on assets 2/ 1.09 0.43 1.16 1.31 0.57 Return on equity 2/ 12.08 4.71 12.89 14.04 6.15
Excluding goodwill amortisation
Return on assets 2/ 1.34 0.70 1.42 1.57 0.85 Return on equity 2/ 14.87 7.63 15.80 16.89 9.12
Efficiency and revenue mix ratios
Cost-to-income ratio (excluding goodwill
amortisation) 31.0 46.6 39.7 34.9 44.3
As a percentage of total operating income:
- net interest income 41.9 56.9 50.1 45.6 57.0 - non-interest income 58.1 43.1 49.9 54.4 43.0
Capital adequacy ratios (at period-end) 3/
Financial Review
DBSH Group’s net profit attributable to members (“NPAM”) was $847 million for second quarter 2004, up 395% over second quarter 2003 and 74% over first quarter 2004. The results included a $187 million gain from sale of the Group’s 10% stake in Wing Lung Bank and a $310 million gain from the sale of the Group’s 59% stake in DTDB. Excluding these one-time gains totalling $497 million, Group NPAM was $350 million, an increase of 105% over second quarter 2003. This increase was driven by growth in operating income combined with a decline in provision charge. Compared to first quarter 2004, Group NPAM, excluding the one-time gains, declined 28% due to lower non-interest income.
• Operating income of $1.056 billion (excluding one-time gains) rose 7% over second quarter 2003 led by 16% growth in net interest income from higher loan volumes, increased investment in debt securities and a rise in interbank interest rates. Compared to first quarter 2004, operating income (excluding one-time gains) declined 17%, largely due to lower treasury income and fees from stockbroking activities.
• Operating expenses rose 5% over second quarter 2003 but declined 4% from first quarter 2004. Changes in expenses were mainly due to variable staff costs, which varied in tandem with revenue generation activity. Second quarter 2004 also saw increases in other expenses from higher promotion and marketing activities.
• Cost-to-income ratio (excluding goodwill amortisation and one-time gains) was 45.6% for second quarter 2004. Compared to second quarter 2003, cost-to-income ratio was lower by 1 percentage point. Compared to first quarter 2004, cost-to-income ratio was higher as the decline in operating expenses was smaller than the decline in operating income.
• Provision charge of $11 million was 94% lower compared to second quarter 2003, and 78% lower compared to first quarter 2004. The lower provision charge was mainly due to improving credit quality and property valuation. It also included partial release of special general provision following the sale and de-consolidation of DTDB.
Profit and Loss Account 1/
In $ millions
2nd Qtr 2004
2nd Qtr 2003
+/(-) %
1st Qtr 2004
1st Half 2004
1st Half 2003
+/(-) %
Net interest income 651 560 16 634 1,285 1,159 11 Non-interest income 902 424 113 632 1,534 873 76
Operating income 1,553 984 58 1,266 2,819 2,032 39
Operating expenses (482) (459) 5 (503) (985) (901) 9
Operating profit before goodwill
amortisation and provisions 1,071 525 104 763 1,834 1,131 62 Goodwill amortisation (110) (107) 3 (110) (220) (213) 3
Operating profit before provisions 961 418 130 653 1,614 918 76 Provisions (11) (187) (94) (50) (61) (305) (80)
Operating profit 950 231 311 603 1,553 613 153
Share of profits less losses of associated
and joint venture companies 22 10 120 18 40 22 82
Net profit before taxation 972 241 303 621 1,593 635 151 Taxation (112) (55) 104 (120) (232) (165) 41 Minority interests (13) (15) (13) (13) (26) (28) (7)
Net profit attributable to members 847 171 395 488 1,335 442 202
NPAM excluding goodwill amortisation 957 278 244 598 1,555 655 137
Note:
1/ Excluding one-timegains of $497 million, the following profit and loss items would have been:
In $ millions
2nd Qtr 2004
2nd Qtr 2003
+/(-) %
1st Qtr 2004
1st Half 2004
1st Half 2003
+/(-) %
Non-interest income 405 424 (4) 632 1,037 873 19
Operating profit before goodwill amortisation and
provisions 574 525 9 763 1,337 1,131 18
DBS Bank (Hong Kong) Limited
For second quarter 2004, net profit after taxation for DBS Bank (Hong Kong) Limited grew 80% over second quarter 2003 to $142 million. The increase was mainly due to higher operating income and lower provision charge. Compared to first quarter 2004, net profit after taxation declined 7% mainly due to lower operating income and an increase in provision charge.
• Net interest income was up 9% over second quarter 2003 mainly attributable to the wider spread between the Prime rate and HIBOR1/. Gross loans increased 8% or HK$7 billion. Compared to first quarter 2004, net interest income decreased 1% due to a narrowing of the Prime-HIBOR1/ spread, despite a 4% increase in gross loans.
• Non-interest income in second quarter 2004 rose 14% over second quarter 2003 due to stronger sales of treasury investment products, unit trusts and higher loan related fees. Non-interest income decreased 12% from first quarter 2004 mainly due to lower sales of treasury investment products.
• Compared to second quarter 2003 and first quarter 2004, operating expenses were marginally lower.
• Provision charge decreased 53% compared to a year ago, following the rebound in Hong Kong’s economy. But provision charge was 16% higher than first quarter 2004. Higher general provision was made on increased loan outstanding while lower write-backs and recoveries led to a higher specific provision charge.
Profit and Loss Account (Based on Hong Kong Generally Accepted Accounting Principles)2/ 3/ In $ millions
2nd Qtr 2004
2nd Qtr 2003
+/(-) %
1st Qtr 2004
1st Half 2004
1st Half 2003
+/(-) %
Net interest income 215 198 9 218 433 392 10 Non-interest income 97 85 14 110 207 167 24
Operating income 312 283 10 328 640 559 14 Operating expenses (125) (126) (1) (126) (251) (238) 5
Operating profit before provisions 187 157 19 202 389 321 21 Provisions (29) (62) (53) (25) (54) (104) (48)
Operating profit 158 95 66 177 335 217 54
Net profit before taxation 163 95 72 180 343 217 58
Net profit after taxation 142 79 80 153 295 179 65
Notes:
1/ HIBOR: Hong Kong Interbank Offer Rate
2/ The exchange rate used for all comparative periods is HK$1 = S$0.2204586.
3/ In the preparation of the consolidated DBSH Group accounts, appropriate adjustments were made to bring DBS Bank (Hong Kong) Limited accounts in line with Singapore Financial Reporting Standards (“FRS”). Under FRS, the contribution from DBS Bank (Hong Kong) Limited was as follows:
In $ millions
2nd Qtr 2004
2nd Qtr 2003
+/(-) %
1st Qtr 2004
1st Half 2004
1st Half 2003
+/(-) %
Net profit before taxation 171 77 122 175 346 195 77
Net profit after taxation 150 69 117 148 298 165 81
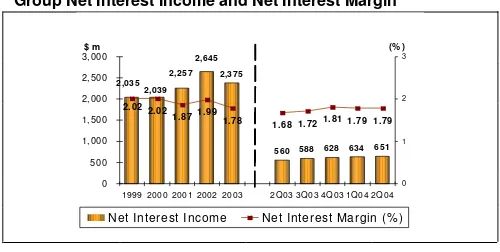
Net Interest Income and Net Interest Margin
Exhibit 1
Group Net Interest Income and Net Interest Margin
2,375
588 628 634 651 560
2,645 2,257 2,039 2,035
2.021.871.99
1.78 1.68 1.721.81 1.79 1.79 2.02
0 500 1,000 1,500 2,000 2,500 3,000
1999 2000 2001 2002 2003 2Q03 3Q03 4Q03 1Q04 2Q04
$ m
0 1 2 3
(% )
Net Interest Income Net Interest Margin (% )
Net interest income grew 16% over second quarter 2003 and 3% over first quarter 2004 to $651 million in second quarter 2004.
• The increase in net interest income was largely due to growth in interest bearing assets and continuing efforts in re-balancing the Group’s asset composition by deploying funds away from the lower yielding interbank market to higher yielding customer loans and debt securities. Excluding DTDB in comparative periods, gross customer loans rose 8% over end June 2003 and 4% over end March 2004 to $67 billion.
[image:7.595.49.299.115.241.2] [image:7.595.52.528.415.715.2]• Net interest margin for second quarter 2004 was 1.79%, higher than 1.68% in second quarter 2003 and virtually unchanged compared to first quarter 2004. Average interest margins on interbank assets and securities improved but customer loan margins remained under pressure.
Table 1
Group Net Interest Income and Net Interest Margin 1/
2nd Qtr 2004 2nd Qtr 2003 1st Qtr 2004
In $ millions
Average
balance Interest
Average rate
(%)
Average
balance Interest
Average rate (%)
Average
balance Interest
Average rate
(%)
Customer loans and
advances 67,112 567 3.40 61,821 602 3.91 65,631 560 3.43
Interbank items 32,906 100 1.22 41,298 91 0.88 33,821 90 1.07
Securities 2/
46,292 330 2.87 30,570 199 2.61 42,744 302 2.84
Total interest bearing assets 146,310 997 2.74 133,689 892 2.68 142,196 952 2.69 Total interest bearing liabilities 137,031 346 1.01 125,026 332 1.06 134,388 318 0.95
Net interest income/margin 651 1.79 560 1.68 634 1.79
1st Half 2004 1st Half 2003
In $ millions
Average
balance Interest
Average rate
(%)
Average
balance Interest
Average rate (%)
Customer loans and
advances 66,518 1,128 3.41 61,424 1,210 3.97
Interbank items 32,936 189 1.16 40,783 202 1.00
Securities 2/
44,329 632 2.87 28,909 393 2.74
Total interest bearing assets 143,783 1,949 2.73 131,116 1,805 2.78 Total interest bearing liabilities 135,326 664 0.99 122,387 646 1.06
Net interest income/margin 1,285 1.79 1,159 1.78
Notes:
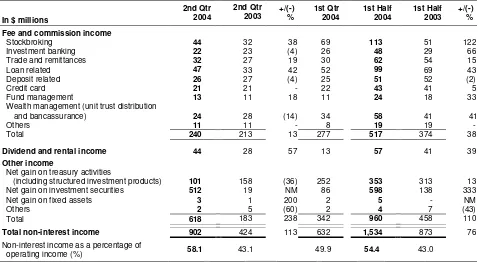
Non-Interest Income
Table 2Group Non-Interest Income
In $ millions
2nd Qtr 2004
2nd Qtr
2003 +/(-)%
1st Qtr 2004
1st Half 2004
1st Half 2003
+/(-) %
Fee and commission income
Stockbroking 44 32 38 69 113 51 122
Investment banking 22 23 (4) 26 48 29 66
Trade and remittances 32 27 19 30 62 54 15
Loan related 47 33 42 52 99 69 43
Deposit related 26 27 (4) 25 51 52 (2)
Credit card 21 21 - 22 43 41 5
Fund management 13 11 18 11 24 18 33
Wealth management (unit trust distribution
and bancassurance) 24 28 (14) 34 58 41 41
Others 11 11 - 8 19 19
Total 240 213 13 277 517 374 38
Dividend and rental income 44 28 57 13 57 41 39
Other income
Net gain on treasury activities
(including structured investment products) 101 158 (36) 252 353 313 13
Net gain on investment securities 512 19 NM 86 598 138 333
Net gain on fixed assets 3 1 200 2 5 - NM
Others 2 5 (60) 2 4 7 (43)
Total 618 183 238 342 960 458 110
Total non-interest income 902 424 113 632 1,534 873 76
Non-interest income as a percentage of
operating income (%) 58.1 43.1 49.9 54.4 43.0
NM: Not meaningful
Non-interest income increased 113%, boosted by a $187 million gain from the sale of investment in Wing Lung Bank and a $310 million gain from the sale of a controlling stake in DTDB. These one-time gains were included under “Net gain on investment securities”. Excluding the $497 million gain, non-interest income for second quarter 2004 was 4% lower compared to second quarter 2003 and 36% below first quarter 2004 mainly due to lower Other Income.
• Compared to same quarter last year, fee and commission income rose 13% to $240 million in second quarter 2004, principally due to higher stockbroking fees following recovery in regional equity markets, and strong growth in loan related fees from increased volume of loan syndication activity. Compared to first quarter 2004, fee and commission income was lower mainly due to market uncertainty prevailing in second quarter 2004, resulting in a decline in equity market volumes and wealth management sales.
• Other income (excluding one-time gains) declined to $121 million in second quarter 2004, a fall of 34% from same quarter last year and 65% from previous quarter. Net gain from treasury activities was lower, including bonds and interest rate derivatives trading, as interest rate uncertainty resulted in a difficult trading environment. The first quarter 2004 net gain on investment securities included $46 million gain from the redemption of investment funds previously managed by third parties.
Operating Expenses
Table 3Group Operating Expenses
In $ millions
2nd Qtr 2004
2nd Qtr 2003
+/(-) %
1st Qtr 2004
1st Half 2004
1st Half 2003
+/(-) %
Staff costs 226 210 8 250 476 429 11
Occupancy expenses 46 51 (10) 46 92 99 (7)
Technology-related expenses 79 74 7 77 156 145 8
Revenue-related expenses 48 49 (2) 54 102 82 24
Others 83 75 11 76 159 146 9
Total operating expenses 482 459 5 503 985 901 9
Cost-to-income ratio (%) (excluding goodwill
amortisation) 31.0 46.6 39.7 34.9 44.3 Staff headcount number (at period-end) 10,838 11,948 12,173 10,838 11,948
• Excluding goodwill amortisation, operating expenses for second quarter 2004 increased 5% to $482 million over second quarter 2003. Staff costs increased 8% to $226 million due to higher bonus accrual in line with the stronger bottom-line performance this year. Other expenses rose 11% on increased investment spending on advertising and marketing for retail products and higher travelling expenses.
• Compared to first quarter 2004, operating expensesdeclined 4% mainly due to lower bonus accruals. Revenue-related expenses, which include commission paid to remisiers and sales commissions, fell 11% following lower business volumes and revenue-related activity.
• The staff headcount at end June 2004 was 10,838. The de-consolidation of DTDB reduced headcount by 1,611 in second quarter 2004.
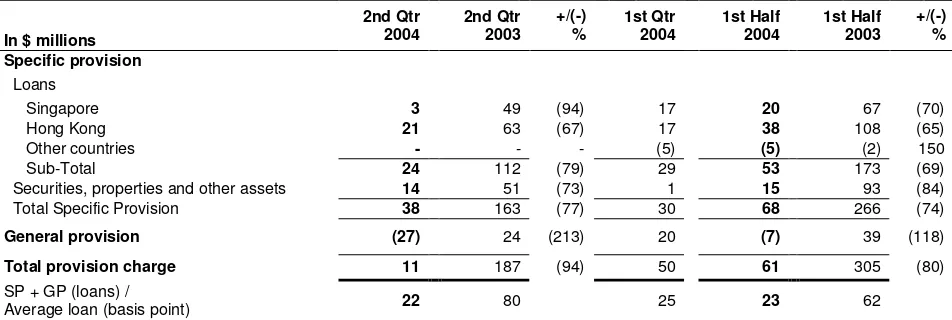
Provision Charge Table 4
Group Provision Charge
In $ millions
2nd Qtr 2004
2nd Qtr 2003
+/(-) %
1st Qtr 2004
1st Half 2004
1st Half 2003
+/(-) % Specific provision
Loans
Singapore 3 49 (94) 17 20 67 (70)
Hong Kong 21 63 (67) 17 38 108 (65)
Other countries - - - (5) (5) (2) 150
Sub-Total 24 112 (79) 29 53 173 (69)
Securities, properties and other assets 14 51 (73) 1 15 93 (84)
Total Specific Provision 38 163 (77) 30 68 266 (74)
General provision (27) 24 (213) 20 (7) 39 (118)
Total provision charge 11 187 (94) 50 61 305 (80)
SP + GP (loans) /
Average loan (basis point) 22 80 25 23 62
Provision charge was $11 million for second quarter 2004, down 94% from second quarter 2003 and 78% from first quarter 2004.
• Specific provision for loan losses fell 79% to $24 million due to an improvement in the overall credit quality of the portfolios. Specific provision for properties and other assets was 73% lower as additional provision for valuation shortfall was set aside for properties in Hong Kong in second quarter 2003.
[image:9.595.50.526.445.605.2]Balance Sheet
Table 5
Group Key Balance Sheet Items
In $ millions
Jun 30 2004 Mar 31 2004 Dec 31 2003 Jun 30 2003
Total assets 168,182 176,574 159,595 158,501
Customer loans 1/ 65,053 65,344 64,335 62,714
Customer deposits 108,179 111,938 108,041 105,514
Loan-to-deposit ratio (%) 60.1 58.4 59.5 59.4
Loan and non-trading debt securities-to-deposit ratio (%) 81.0 78.4 79.7 76.9
Note:
1/ After deducting cumulative provisions.
At the end of June 2004, total assets were $168 billion.
• Compared to end March 2004, customer loans were virtually unchanged. Excluding DTDB in comparative periods, customer loans grew 4% over end March 2004, arising from increases across all industry sectors, including a 3% growth in housing loans. Customer deposits decreased to $108 billion.
• The Group’s loan-to-deposit ratio at the end of June 2004 improved to 60.1%. Including DBSH Group’s portfolio of non-trading debt securities, the ratio of loan and non-trading debt securities to deposits was 81%.
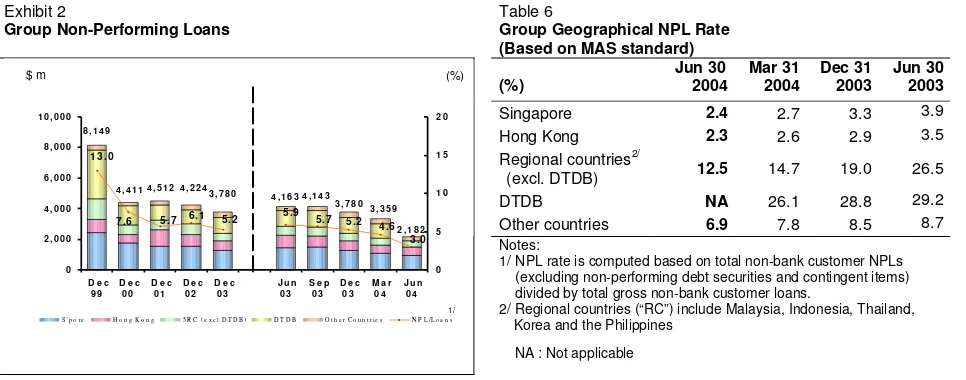
Asset Quality
Exhibit 2
Group Non-Performing Loans
Table 6
Group Geographical NPL Rate (Based on MAS standard)
(%) Jun 30 2004 Mar 31 2004 Dec 31 2003 Jun 30 2003
Singapore 2.4 2.7 3.3 3.9
Hong Kong 2.3 2.6 2.9 3.5
Regional countries2/
(excl. DTDB) 12.5 14.7 19.0 26.5
DTDB NA 26.1 28.8 29.2
Other countries 6.9 7.8 8.5 8.7
4 , 2 2 4
2 , 1 8 2 3 , 3 5 9 3 , 7 8 0 4 , 1 4 3 4 , 1 6 3 3 , 7 8 0 8 , 1 4 9
4 , 4 1 1 4 , 5 1 2
3 .0
5.2 5.2 4.6
1 3 . 0
7.6 5.7 6.1 5 .9 5.7
0 2 , 0 0 0 4 , 0 0 0 6 , 0 0 0 8 , 0 0 0 1 0 , 0 0 0
D e c 9 9
D e c 0 0
D e c 0 1
D e c 0 2
D e c 0 3
J u n 0 3
S e p 0 3
D e c 0 3
M a r 0 4
J u n 0 4 0 5 1 0 1 5 2 0
S ' p o r e H o n g K o n g 5 R C ( e x c l D T D B ) D T D B O t h e r C o u n t r ie s N P L / L o a n s
Notes:
1/ NPL rate is computed based on total non-bank customer NPLs (excluding non-performing debt securities and contingent items) divided by total gross non-bank customer loans.
2/ Regional countries (“RC”) include Malaysia, Indonesia, Thailand, Korea and the Philippines
NA : Not applicable
• The volume of non-performing loans (“NPLs”) declined 35% from end of March 2004 to $2.2 billion at the end of June 2004. Excluding DTDB’s NPLs, the Group’s NPLs was 10% lower. Out of the $2.2 billion NPLs, $0.5 billion or 23% were restructured NPLs.
• Singapore’s NPLs was $1 billion and accounted for 44% of the Group’s NPLs, while Hong Kong’s NPLs of $0.5 billion accounted for 25%.
• The ratio of NPLs to the total non-bank loans (“NPL rate”) further improved from 4.6% at the end of March 2004 to 3% at the end of June 2004. The NPL rates for Singapore, Hong Kong and regional countries operations improved to 2.4%, 2.3% and 12.5% respectively, at the end of June 2004 due to a reduction in non-bank NPLs and a higher loan base.
(%) $ m
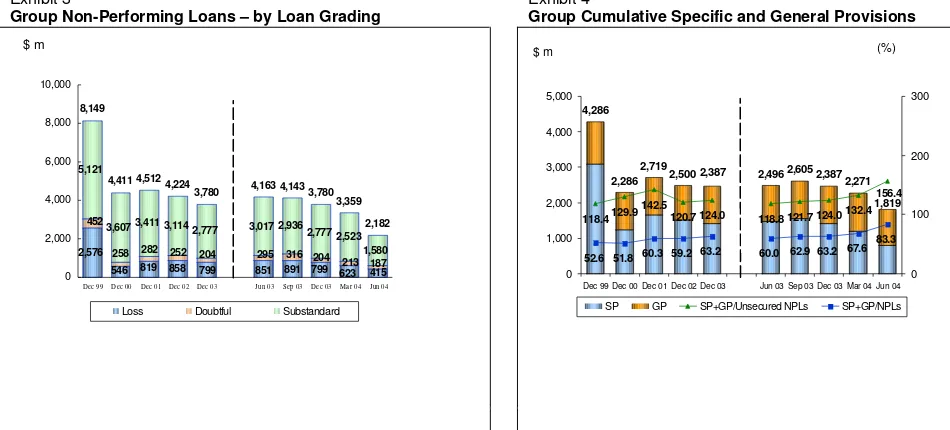
Loan Grading
Of the total $2.2 billion NPLs at the end of June 2004, 72% were classified as substandard, 9% as doubtful and the remaining 19% in the loss category. 47% of the NPLs were secured by collateral.
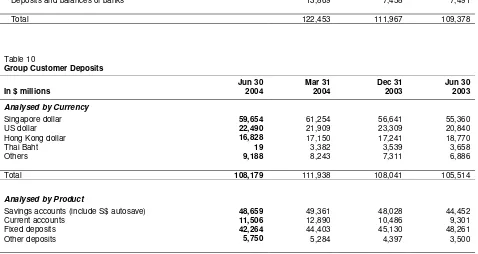
Cumulative Specific and General Provisions
Total cumulative specific and general provisions at the end of June 2004 were 156% of unsecured NPLs, and 83% of total NPLs.
Exhibit 3
Group Non-Performing Loans – by Loan Grading
Exhibit 4
Group Cumulative Specific and General Provisions
1,819 2,387
2,271 4,286
2,286 2,719
2,500 2,387 2,496 2,605
118.4129.9 142.5
120.7 124.0 118.8 121.7 124.0132.4
52.6 51.8 60.3 59.2 63.2 60.0 63.2 67.6 83.3 156.4
62.9
0 1,000 2,000 3,000 4,000 5,000
Dec 99 Dec 00 Dec 01 Dec 02 Dec 03 Jun 03 Sep 03 Dec 03 Mar 04 Jun 04 0 100 200 300
SP GP SP+GP/Unsecured NPLs SP+GP/NPLs
$ m
2,576 282 5,121
3,607 3,411 3,114 2,777 3,017 2,936
1,580 546 819 858 799 851 891 799 623 415187
213 452
258 252 204 295 316 204 2,777 2,5232,182 3,780 4,143 4,163 3,780 4,224 4,512 4,411 8,149
3,359
0 2,000 4,000 6,000 8,000 10,000
Dec 99 Dec 00 Dec 01 Dec 02 Dec 03 Jun 03 Sep 03 Dec 03 Mar 04 Jun 04
Loss Doubtful Substandard
[image:11.595.51.526.198.413.2]Restructured Loans
Table 7
Loans that were restructured and classified
Jun 30, 2004 Mar 31, 2004 Dec 31, 2003 Jun 30, 2003
In $ millions NPLs
Specific
provisions NPLs
Specific
provisions NPLs
Specific
provisions NPLs
Specific provisions
Substandard 416 41 991 116 1,094 125 1,260 138
Doubtful 19 17 70 54 70 54 73 56
Loss 77 76 188 188 245 243 301 301
Total 512 134 1,249 358 1,409 422 1,634 495
Table 8
Group Customer Loans
In $ millions
Jun 30 2004
Mar 31 2004
Dec 31 2003
Jun 30 2003
Gross 66,588 67,298 66,414 64,905
Less:
Specific provisions 652 1,019 1,151 1,273
General provisions 883 935 928 918
Net total 65,053 65,344 64,335 62,714
Excluding DTDB:
Gross 63,842 62,938 61,566
Less:
Specific provisions 660 773 890
General provisions 753 745 736
Net total 62,429 61,420 59,940
Analysed by Industry
Manufacturing 6,262 6,912 6,434 6,791
Building & Construction 7,847 7,941 7,907 7,555
Housing Loans 23,089 22,888 22,603 22,082
General Commerce 6,547 7,069 6,634 6,057
Transportation, Storage & Communications 5,122 5,090 4,821 4,869
Financial Institutions, Investment & Holding Companies 5,038 4,771 5,020 4,547 Professionals & Private Individuals (except Housing Loans) 7,240 7,305 7,393 7,320
Others 5,443 5,322 5,602 5,684
Total (Gross) 66,588 67,298 66,414 64,905
Excluding DTDB:
Manufacturing 5,993 5,423 5,760
Building & Construction 7,680 7,679 7,341
Housing Loans 22,523 22,232 21,739
General Commerce 6,353 5,927 5,368
Transportation, Storage & Communications 4,917 4,658 4,716
Financial Institutions, Investment & Holding Companies 4,710 4,940 4,479 Professionals & Private Individuals (except Housing Loans) 6,943 7,054 7,038
Others 4,723 5,025 5,125
Total (Gross) 63,842 62,938 61,566
Analysed by Currency and Fixed / Variable Rates Fixed rate 1/
Singapore dollar 9,424 8,961 8,867 8,381
Hong Kong dollar 245 353 262 479
US dollar 1 1 4 3
Thai Baht - 930 945 785
Others 187 85 96 67
Sub-total 9,857 10,330 10,174 9,715
Variable rate 2/
Singapore dollar 21,577 20,935 21,026 21,305
Hong Kong dollar 21,434 20,216 20,089 20,478
US dollar 10,028 9,147 8,658 8,773
Thai Baht 21 2,354 2,393 2,395
Others 3,671 4,316 4,074 2,239
Sub-total 56,731 56,968 56,240 55,190
Total (Gross) 66,588 67,298 66,414 64,905
Notes:
1/ Fixed rate loans refer to long-term loans where the interest rates are fixed for the initial 1 to 3 years for certain mortgage loans, and over the entire loan period for other loans.
Table 9
Total Group Deposits
In $ millions
Jun 30 2004
Mar 31 2004
Dec 31 2003
Jun 30 2003
Deposits of non-bank customers 108,179 111,938 108,041 105,514
Deposits and balances of banks 10,286 14,062 7,497 7,512
Total 118,465 126,000 115,538 113,026
Excluding DTDB:
Deposits of non-bank customers 108,584 104,509 101,887
Deposits and balances of banks 13,869 7,458 7,491
Total 122,453 111,967 109,378
Table 10
Group Customer Deposits
In $ millions
Jun 30 2004
Mar 31 2004
Dec 31 2003
Jun 30 2003
Analysed by Currency
Singapore dollar 59,654 61,254 56,641 55,360
US dollar 22,490 21,909 23,309 20,840
Hong Kong dollar 16,828 17,150 17,241 18,770
Thai Baht 19 3,382 3,539 3,658
Others 9,188 8,243 7,311 6,886
Total 108,179 111,938 108,041 105,514
Analysed by Product
Savings accounts (include S$ autosave) 48,659 49,361 48,028 44,452
Current accounts 11,506 12,890 10,486 9,301
Fixed deposits 42,264 44,403 45,130 48,261
Other deposits 5,750 5,284 4,397 3,500
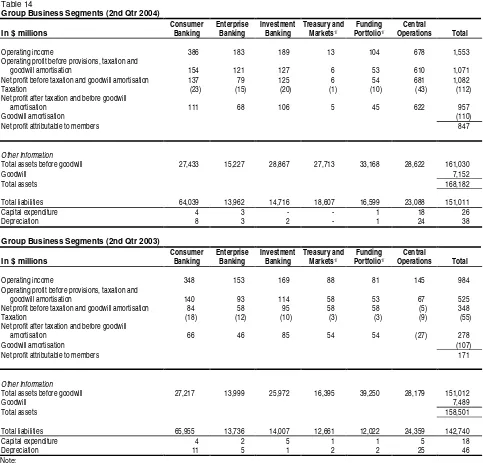
[image:13.595.52.530.203.457.2]Capital Adequacy Ratio
Exhibit 5Group Capital Adequacy Ratio
10.5 10.5 10.4 11.6
4.7 4.6 4.1 4.0
15.7 14.4 10.5 10.3 12.2 9.7 4.5 5.2 5.2 4.6 3.5 4.5 15.6 19.2 18.9 17.4
15.5 15.1 14.2 15.2 15.1 14.5
0 5 10 15 20 25 Dec 99 Dec 00 Dec 01 Dec 02 Dec 03 Jun 03 Sep 03 Dec 03 Mar 04 Jun 04
Tier I Tier II
[image:14.595.50.528.100.496.2]The new MAS capital framework (MAS Notice 637) was issued on May 28, 2004. Under this new framework, the total Capital Adequacy Ratio (“CAR”) for the DBSH Group at end of June 2004 was 15.6%, of which Tier 1 CAR was 11.6%.
Table 11
Group Capital
In $ millions
Jun 30
2004 2/ Mar 31
2004 2/ Dec 31
2003
Jun 30 2003 Tier I Capital
Paid ordinary/preference shares 1,557 1,557 1,556 1,556
Disclosed reserves/others 16,806 15,862 15,439 15,118
Goodwill (7,152) (7,261) (7,371) (7,606)
11,211 10,158 9,624 9,068
Tier II Capital
Cumulative general provisions 914 968 768 709
Subordinated debts 3,571 3,486 3,531 3,659
Others (657) (471) (38) (153)
3,828 3,983 4,261 4,215
Total Capital 15,039 14,141 13,885 13,283
Risk Weighted Assets 96,641 97,764 92,067 93,865
Notes:
1/ Compared to end December 2001, the reduction in the Tier I CAR ratio was primarily due to the deduction of additional goodwill with DBS' purchase of the DBS Diamond Holdings Limited minority interest.
2/ Ratios for 2004 were computed based on the revised MAS capital framework issued on May 28, 2004. Comparatives for 2003 were not restated to the new basis and were computed using Bank for International Settlements (“BIS”) guidelines.
Unrealised Valuation Surpluses
Table 12
Group Unrealised Valuation Surpluses
In $ millions
Jun 30 2004 Mar 31 2004 Dec 31 2003 Jun 30 2003
Properties 538 438 424 409
Quoted investments 182 672 436 442
Total 720 1,110 860 851
Unrealised valuation surpluses in properties and quoted investment securities not recognised in the accounts amounted to $0.7 billion at the end of June 2004.
(%)
1/
[image:14.595.50.528.614.680.2]Geographical Segment Analysis
[image:15.595.51.528.164.468.2]The following table analyses total assets, operating income and net profit attributable to members by geographical segments. Unless otherwise stated, the analysis of geographical segments is generally based on the location of the office recording the transactions.
Table 13
Group Geographical Segments
In $ millions
Total assets
Distribution (%)
Year-to-date Operating
income Distribution
(%)
Year-to-date Net profit attributable to
members Distribution
(%) Jun 30, 2004
Singapore 108,193 67 1,916 68 1,135 73
Hong Kong 40,069 25 703 25 324 21
Regional countries 3,276 2 136 5 69 4
Rest of the world 9,492 6 64 2 27 2
Sub-total 161,030 100 2,819 100 1,555 100
Goodwill 7,152 - (220)
Total 168,182 2,819 1,335
Dec 31, 2003
Singapore 1/
97,655 64 2,496 60 850 58
Hong Kong 39,101 26 1,335 32 486 33
Regional countries 1/ 6,813 4 271 6 81 6
Rest of the world 8,655 6 96 2 38 3
Sub-total 152,224 100 4,198 100 1,455 100
Goodwill 7,371 - (430)
Total 159,595 4,198 1,025
Jun 30, 2003
Singapore 1/ 98,514 65 1,278 63 439 67
Hong Kong 39,340 26 601 30 161 25
Regional countries 1/
6,703 5 112 5 35 5
Rest of the world 6,455 4 41 2 20 3
Sub-total 151,012 100 2,032 100 655 100
Goodwill 7,489 - (213)
Total 158,501 2,032 442
Note:
1/ Special general provisions for exposures outside Singapore and additional provisions for DTDB's loans are booked in Singapore.
DBSH Group operates in four main geographical areas :
• “Singapore”,which includes the operations of the Asian Currency Unit.
• “Hong Kong”, which includes branch and subsidiary operations in Hong Kong.
• “Regional countries”, which includes branch and subsidiary operations in Malaysia, Indonesia, Thailand, South Korea and the Philippines.
• “Rest of the world”, which are mainly branch operations in China, India, Taiwan, United States and United Kingdom.
Business Segment Analysis
The business segment results represent the customer segments of the respective businesses and are determined by:
• Income and direct expenses attributable to each customer and other segment; and
• Management accounting policies relating to the allocation of indirect expenses and funds transfer pricing between the central treasury unit and the customer/other segments.
The various customer segments are described below, along with a description of the change in net profit after taxation for second quarter 2004 over second quarter 2003.
• Consumer Banking
Consumer Banking focuses on providing products and services to individual customers. The products and services offered to customers include credit facilities (mortgage, personal loans, etc.), credit cards, deposit collection, remittance services and asset management products.
The increase in net profit after taxation ($45 million, 68%) was largely due to higher interest income, fee income from cards and sales of investment products, and lower provisions as a result of improving credit quality and asset valuation.
• Enterprise Banking
Enterprise Banking focuses on providing products and services to small and medium enterprises. The products and services offered to customers include credit facilities (overdraft, factoring/accounts receivable purchase, trade financing, commercial/industrial property financing, hire purchase and government financing and assistance schemes), deposit, payment and collection services and treasury products.
The increase in net profit after taxation ($22 million, 48%) was mainly attributable to higher interest income resulting from increased volumes, fee income from treasury product sales, loan and trade related activities, capital markets and transactional activities.
• Investment Banking
Investment Banking caters to the business needs of large corporate customers and financial institutions. The products and services offered to customers include direct lending, advisory banking services, bond issuance, equity financing, syndicated financing, mergers and acquisitions advisory services, debt restructuring advisory services, private equity, nominee and trustee services and cash management services.
The increase in net profit after taxation ($21 million, 25%) was due to higher fee income principally from strong growth in loan related fees from increased volume of loan syndication activity and lower provisions.
• Treasury and Markets
Treasury and Markets is primarily involved in market making, structuring and trading of financial products including foreign exchange, securities and interest rate/ credit/ equity/ foreign exchange derivatives. Income from treasury products and services relating to customers of other segments is reflected in the respective customer segments.
The decrease in net profit after taxation ($49 million, 91%) was mainly due to less favourable bonds and interest rate derivatives trading.
The other segments of the analysis are:
• Funding Portfolio
• Central Operations
Central Operations encompasses a range of activities resulting from central corporate decisions and the related income and expenses not attributed to business segments. These include the central treasury unit, funding costs of DBSH Group’s associated and subsidiary companies and gains/losses on properties as well as certain subsidiaries including stock brokerage and asset management.
The net profit after taxation for second quarter 2004 included a $187 million gain from sale of the Group’s 10% stake in Wing Lung Bank, a $310 million gain from the sale of the Group’s 59% stake in DTDB and write-back of special general provision amounting to $40 million.
[image:17.595.46.529.210.673.2]The following table analyses the results, total assets and total liabilities by business segments: Table 14
Group Business Segments (2nd Qtr 2004)
In $ millions
Consumer Banking
Enterprise Banking
Investment Banking
Treasury and Markets1/
Funding Portfolio1/
Central
Operations Total
Operating income 386 183 189 13 104 678 1,553
Operating profit before provisions, taxation and
goodwill amortisation 154 121 127 6 53 610 1,071
Net profit before taxation and goodwill amortisation 137 79 125 6 54 681 1,082
Taxation (23) (15) (20) (1) (10) (43) (112)
Net profit after taxation and before goodwill
amortisation 111 68 106 5 45 622 957
Goodwill amortisation (110)
Net profit attributable to members 847
Other Information
Total assets before goodwill 27,433 15,227 28,867 27,713 33,168 28,622 161,030
Goodwill 7,152
Total assets 168,182
Total liabilities 64,039 13,962 14,716 18,607 16,599 23,088 151,011
Capital expenditure 4 3 - - 1 18 26
Depreciation 8 3 2 - 1 24 38
Group Business Segments (2nd Qtr 2003)
In $ millions
Consumer Banking
Enterprise Banking
Investment Banking
Treasury and Markets1/
Funding Portfolio1/
Central
Operations Total
Operating income 348 153 169 88 81 145 984
Operating profit before provisions, taxation and
goodwill amortisation 140 93 114 58 53 67 525
Net profit before taxation and goodwill amortisation 84 58 95 58 58 (5) 348
Taxation (18) (12) (10) (3) (3) (9) (55)
Net profit after taxation and before goodwill
amortisation 66 46 85 54 54 (27) 278
Goodwill amortisation (107)
Net profit attributable to members 171
Other Information
Total assets before goodwill 27,217 13,999 25,972 16,395 39,250 28,179 151,012
Goodwill 7,489
Total assets 158,501
Total liabilities 65,955 13,736 14,007 12,661 12,022 24,359 142,740
Capital expenditure 4 2 5 1 1 5 18
Depreciation 11 5 1 2 2 25 46
Note:
1/ Operating expenses have been determined by pro-rating between Treasury and Markets and the Funding Portfolio based on the share of operating income.
Comparatives
DBS GROUP HOLDINGS LTD AND ITS SUBSIDIARY COMPANIES
Unaudited Consolidated Profit and Loss Account
In $ millions
2nd Qtr 2004
2nd Qtr 2003
+/(-) %
1st Qtr 2004
1st Half 2004
1st Half 2003
+/(-) %
Interest income 997 892 12 952 1,949 1,805 8
Less: Interest expense 346 332 4 318 664 646 3
Net interest income 651 560 16 634 1,285 1,159 11
Fee and commission income 240 213 13 277 517 374 38
Dividends 36 21 71 5 41 25 64
Rental income 8 7 14 8 16 16
-Other income 618 183 238 342 960 458 110
Operating income 1,553 984 58 1,266 2,819 2,032 39
Less: Staff costs 226 210 8 250 476 429 11
Depreciation 38 46 (17) 44 82 91 (10)
Other operating expenses 218 203 7 209 427 381 12
Goodwill amortisation 110 107 3 110 220 213 3
Operating expenses 592 566 5 613 1,205 1,114 8
Operating profit before provisions 961 418 130 653 1,614 918 76
Less: Provision for possible loan losses and
diminution in value of other assets 11 187 (94) 50 61 305 (80)
Operating profit 950 231 311 603 1,553 613 153
Add: Share of profits less losses of associated and
joint venture companies 22 10 120 18 40 22 82
Net profit before taxation 972 241 303 621 1,593 635 151
Less: Taxation 106 53 100 116 222 161 38
Share of taxation of associated and joint
venture companies 6 2 200 4 10 4 150
Net profit after taxation 860 186 362 501 1,361 470 190
Less: Minority interests 13 15 (13) 13 26 28 (7)
DBS GROUP HOLDINGS LTD AND ITS SUBSIDIARY COMPANIES
Unaudited Consolidated Balance Sheet as at
Jun 30 Mar 31 Dec 31 Jun 30 In $ millions 2004 2004 20031/ 2003
SHARE CAPITAL
Share capital 1,557 1,557 1,556 1,556
RESERVES
Share premium account 2,181 2,178 2,171 2,168 Other reserve 4,271 4,271 4,271 4,271 Capital redemption reserve 28 28 28 28 Capital reserve (8) (39) (30) 3 General reserve 2,230 2,230 2,230 2,044 Revenue reserve 5,788 5,158 4,670 4,443 14,490 13,826 13,340 12,957
SHAREHOLDERS' FUNDS 16,047 15,383 14,896 14,513
MINORITY INTERESTS 1,124 1,138 1,125 1,248
LIABILITIES
Deposits and balances of
banks 10,286 14,062 7,497 7,512 Deposits and other accounts
of non-bank customers 108,179 111,938 108,041 105,514
Bills payable 357 738 363 373
Current taxation 618 605 500 497 Deferred tax liabilities 72 94 104 112 Other liabilities 19,392 20,904 15,772 17,148 Other borrowings and debt
securities in issue 2/ 6,731 6,089 5,604 5,714
- due within one year 2,259 2,051 1,882 2,383 - due after one year 4,472 4,038 3,722 3,331
Subordinated term debts
(unsecured) 5,376 5,623 5,693 5,870 - due within one year - 25 25 25 - due after one year 5,376 5,598 5,668 5,845
TOTAL LIABILITIES AND SHAREHOLDERS’
FUNDS 168,182 176,574 159,595 158,501
OFF BALANCE SHEET ITEMS
Contingent liabilities 7,468 7,296 6,984 7,165 Commitments 67,870 68,612 60,173 62,570 Financial derivatives 1,549,064 1,413,541 1,256,240 1,227,074
Notes: 1/ Audited.
2/ Includes secured amount of $1,497 million as at June 30, 2004 (March 31, 2004: $1,385 million; December 31, 2003: $1,106 million; June 30, 2003: $1,660 million). These are mainly secured by properties and securities.
Jun 30 Mar 31 Dec 31 Jun 30 In $ millions 2004 2004 20031/ 2003
ASSETS
Cash, and balances and placements with central
banks 7,088 11,987 5,007 2,671 Singapore Government
securities and treasury bills 13,627 13,192 11,438 10,143 Trading securities 11,502 11,142 6,433 4,507 Balances, placements with,
and loans and advances to
banks 24,829 26,977 27,472 36,132 Bills receivable from non-bank
customers 1,939 2,185 1,481 1,459 Loans and advances to
non-bank customers 63,114 63,159 62,854 61,255 Investment securities 23,667 23,711 22,828 19,522 Associated and joint venture
companies 548 543 547 493
Goodwill 7,152 7,261 7,371 7,489 Fixed assets 1,856 1,958 2,016 2,138 Deferred tax assets 118 119 129 122 Other assets 12,742 14,340 12,019 12,570
DBS GROUP HOLDINGS LTD AND ITS SUBSIDIARY COMPANIES
Unaudited Balance Sheet of DBS Group Holdings Ltd as at
Jun 30 Mar 31 Dec 31 Jun 30
In $ millions 2004 2004 20031/ 2003
SHARE CAPITAL
Share capital 1,557 1,557 1,556 1,556
RESERVES
Share premium account 2,181 2,178 2,171 2,168 Capital redemption reserve 28 28 28 28 Revenue reserve 3,000 3,001 3,001 3,002 5,209 5,207 5,200 5,198
SHAREHOLDERS' FUNDS 6,766 6,764 6,756 6,754
LIABILITIES
Current liabilities 9 9 9 9
Deferred tax liabilities # # # #
TOTAL LIABILITIES AND
SHAREHOLDERS’ FUNDS 6,775 6,773 6,765 6,763
Other Information
Net asset value per ordinary share ($)
(i) Based on existing ordinary
share capital 4.49 4.49 4.53 4.53
4.35 4.34 4.34 4.34
(ii) Assuming non-voting convertible preference shares (“CPS”) and non-voting redeemable CPS are converted to ordinary shares
Notes: 1/ Audited. 2/ #: Insignificant
Jun 30 Mar 31 Dec 31 Jun 30 In $ millions 2004 2004 20031/ 2003
ASSETS
Balances, placements with, and loans and advances to
non-bank customers 3 3 3 3
Investment in subsidiary
companies 6,772 6,770 6,762 6,760
DBS GROUP HOLDINGS LTD AND ITS SUBSIDIARY COMPANIES
Unaudited Consolidated Statement of Changes in Shareholders' Equity
In $ millions
Share Capital
Share Premium
Other Reserve
Capital Redemption Reserve
Capital Reserve
General Reserve
Revenue Reserve
Total Reserves
Balance at January 1, 2004 1,556 2,171 4,271 28 (30) 2,230 4,670 13,340
Exercise of share options pursuant to the DBSH
Share Option Plan 1 10 10
Net exchange translation adjustments during the
period 4 4
Net profit attributable to members 1,335 1,335
Final dividends paid on ordinary and preference
shares for the previous year (199) (199)
Goodwill transferred on disposal of subsidiary
company 18 (18)
-Balance at June 30, 2004 1,5571/ 2,181 4,271 28 (8) 2,230 5,788 14,490
Balance at January 1, 2003 1,555 2,163 4,271 28 (19) 2,044 4,195 12,682
Exercise of share options pursuant to the DBSH
Share Option Plan 1 5 5
Net exchange translation adjustments during the
period 22 22
Net profit attributable to members 442 442
Final dividends paid on ordinary and preference
shares for the previous year (194) (194)
Balance at June 30, 2003 1,556 2,168 4,271 28 3 2,044 4,443 12,957
Unaudited Statement of Changes in Shareholders' Equity of DBS Group Holdings Ltd
In $ millions Share Capital
Share Premium
Capital Redemption Reserve
Revenue Reserve
Total Reserves
Balance at January 1, 2004 1,556 2,171 28 3,001 5,200
Exercise of share options pursuant to the DBSH Share Option Plan 1 10 10
Net profit after taxation 198 198
Final dividends paid on ordinary and preference shares for the
previous year (199) (199)
Balance at June 30, 2004 1,5571/ 2,181 28 3,000 5,209
Balance at January 1, 2003 1,555 2,163 28 3,201 5,392
Exercise of share options pursuant to the DBSH Share Option Plan 1 5 5
Net profit after taxation (5) (5)
Final dividends paid on ordinary and preference shares for the
previous year (194) (194)
Balance at June 30, 2003 1,556 2,168 28 3,002 5,198
Note:
DBS GROUP HOLDINGS LTD AND ITS SUBSIDIARY COMPANIES
Unaudited Consolidated Cash Flow Statement
In $ millions
1st Half 2004
1st Half 2003
Cash flows from operating activities
Net profit before taxation 1,593 635
Adjustments for non-cash items:
Provision for possible loan losses and diminution in value of other assets 61 305
Depreciation of fixed assets 82 91
Goodwill amortisation 220 213
Share of profits of associated and joint venture companies (40) (22)
Net gain on disposal of fixed assets (5)
-Net gain on disposal of investment securities (598) (138)
Operating profit before changes in operating assets & liabilities 1,313 1,084
Increase in:
Deposits and other accounts of non-bank customers 3,572 4,199
Deposits and balances of banks 2,937 2,635
Other liabilities including bills payable 3,650 1,007
(Increase)/Decrease in:
Singapore Government securities and treasury bills (2,189) (1,126)
Trading securities (5,069) (835)
Accounts receivable and other assets (553) (2,721)
Balances, placements with, and loans and advances to other banks 2,524 2,620 Loans and advances to non-bank customers including bills receivable (4,029) (2,169)
Tax paid (104) (78)
Net cash generated from operating activities (1) 2,052 4,616
Cash flows from investing activities
Dividends from associated companies 9 23
Purchase of fixed assets (42) (31)
Net increase in investment securities (852) (4,834)
Cash of subsidiary company disposed (69)
-Proceeds from disposal of fixed assets 27 29
Net cash used in investing activities (2) (927) (4,813)
Cash flows from financing activities Increase/(Decrease) in:
Share capital and share premium 11 6
Debt securities and borrowings 1,148 889
Dividends paid to shareholders of DBSH (199) (194)
Dividends paid to minority shareholders of subsidiary companies (26) (42)
Net cash generated from financing activities (3) 934 659
Exchange translation adjustments (4) 22 22
Net change in cash, and balances and placements with central banks (1)+(2)+(3)+(4) 2,081 484
Cash, and balances and placements with central banks as at January 1 5,007 2,187
DBS GROUP HOLDINGS LTD AND ITS SUBSIDIARY COMPANIES
Selected Notes to the Accounts
1. Issuance of Ordinary Shares
There were 1,469,965,595 issued and fully paid-up ordinary shares at December 31, 2003. During the first half 2004, 20,470,049 ordinary shares were issued upon the conversion of non-voting convertible preference shares and the exercise of executive share options, bringing the total outstanding number of ordinary shares to 1,490,435,644 at June 30, 2004. The weighted average number of ordinary shares was 1,485,394,591 for the first half 2004.
Details of issue of new ordinary shares of $1.00 each are as follows:
Particulars
Number of new ordinary shares issued between
April 1, 2004 and June 30, 2004
Number of new ordinary shares that would have been issued upon the conversion/exercise of all outstanding non-voting convertible preference
shares (“CPS”)/non-voting redeemable CPS/executive share options
Jun 30, 2004 Dec 31, 2003 Jun 30, 2003
Conversion of non-voting CPS - 120,436 19,595,605 19,608,841 Conversion of non-voting redeemable CPS - 66,475,374 66,475,374 66,475,374 Exercise of executive share options 262,280 50,936,683 46,155,436 47,602,266
2.
Loan and Investment Exposures to Malaysia, Indonesia, Thailand, Korea, The
Philippines (Regional Countries), Hong Kong and China
At June 30, 2004, DBSH Group has exposures to certain countries in the Asia Pacific Region. The exposures are determined based on the location of the credit risk of the customers and counter-parties regardless of where the transactions are booked.
The Group’s net exposure in the 5 Regional Countries was $9 billion at June 30, 2004, a decline of 28% compared to March 31, 2004. Exposure to the 5 Regional Countries amounted to 5% of the Group’s Total Assets.
The DBSH Group’s exposures (assets and non-performing loans) to the Regional Countries, Hong Kong and China at June 30, 2004 are as follows:
Loans and debt securities Net Exposure
In $ millions
Assets in Bank
Central Banks &
Govt. Securities
Non-Bank 1/ Investments
Less: Intercompany
Loans/ Investments in
Financial Subsidiaries/
Overseas
Branches Amount
As a % of Total
Assets NPLs2/
(a) (b) (c) (d) (e) (f)=(a+b (g)
+c+d-e)
Total Regional Countries 4,927 1,064 3,779 1,138 1,896 9,012 5.3% 370
Malaysia 1,404 50 1,662 88 1,140 2,064 1.2% 146
Indonesia 272 206 555 67 247 853 0.5% 32
Thailand 58 17 210 412 44 653 0.4% 188
Korea 3,126 573 1,266 6 463 4,508 2.7%
-The Philippines 67 218 86 565 2 934 0.5% 4 Hong Kong 4,676 3,091 24,735 11,989 14,954 29,537 17.5% 544
China 2,549 18 1,075 65 1,418 2,289 1.4% 120
TOTAL 12,152 4,173 29,589 13,192 18,268 40,838 24.2% 1,034
Notes:
1/ Non-bank loans include loans to government and quasi-government entities.
DBS GROUP HOLDINGS LTD AND ITS SUBSIDIARY COMPANIES
2.
Loan and Investment Exposures to Malaysia, Indonesia, Thailand, Korea, The
Philippines (Regional Countries), Hong Kong and China (Continued)
The DBSH Group’s exposures (assets and non-performing loans) to the Regional Countries, Hong Kong and China at March 31, 2004 are as follows:
Loans and debt securities Net Exposure
In $ millions
Assets in Bank
Central Banks &
Govt. Securities
Non-Bank 1/
Investments
Less: Intercompany
Loans/ Investments in
Financial Subsidiaries/
Overseas
Branches Amount
As a % of Total
Assets NPLs2/
(a) (b) (c) (d) (e) (f)=(a+b (g)
+c+d-e)
Total Regional Countries 4,885 1,585 6,909 933 1,762 12,550 7.1% 1,386
Malaysia 1,154 35 1,362 88 1,015 1,624 0.9% 212
Indonesia 223 181 524 71 202 797 0.4% 36
Thailand (excluding DTDB) 265 17 143 63 217 271 0.2% 186
Korea 3,185 834 1,294 2 327 4,988 2.8%
-The Philippines 43 184 96 561 1 883 0.5% 5 DTDB 3/
15 334 3,490 148 - 3,987 2.3% 947 Hong Kong 3,742 3,006 23,668 11,796 13,724 28,488 16.1% 584
China 1,202 32 991 56 502 1,779 1.0% 118
TOTAL 9,829 4,623 31,568 12,785 15,988 42,817 24.2% 2,088
The DBSH Group’s exposures (assets and non-performing loans) to the Regional Countries, Hong Kong and China at December 31, 2003 are as follows:
Loans and debt securities Net Exposure
In $ millions
Assets in Bank
Central Banks &
Govt. Securities
Non-Bank 1/ Investments
Less: Intercompany
Loans/ Investments in
Financial Subsidiaries/
Overseas
Branches Amount
As a % of Total
Assets NPLs2/
(a) (b) (c) (d) (e) (f)=(a+b (g)
+c+d-e)
Total Regional Countries 5,016 1,104 6,395 955 1,954 11,516 7.3% 1,545
Malaysia 1,280 13 1,356 90 1,034 1,705 1.1% 233
Indonesia 126 56 365 73 128 492 0.3% 55
Thailand (excluding DTDB) 231 9 221 63 214 310 0.2% 188
Korea 3,326 531 885 1 577 4,166 2.6% 17
The Philippines 46 149 103 604 1 901 0.6% 8
DTDB 3/ 7 346 3,465 124 - 3,942 2.5% 1,044
Hong Kong 2,457 2,013 23,235 11,935 13,238 26,402 16.5% 643
China 965 24 692 21 393 1,309 0.8% 130
TOTAL 8,438 3,141 30,322 12,911 15,585 39,227 24.6% 2,318
Notes:
DBS GROUP HOLDINGS LTD AND ITS SUBSIDIARY COMPANIES
2.
Loan and Investment Exposures to Malaysia, Indonesia, Thailand, Korea, The
Philippines (Regional Countries), Hong Kong and China (Continued)
The DBSH Group’s exposures (assets and non-performing loans) to the Regional Countries, Hong Kong and China at June 30, 2003 are as follows:
Loans and debt securities Net Exposure
In $ millions
Assets in Bank
Central Banks &
Govt. Securities
Non-Bank 1/
Investments
Less: Intercompany
Loans/ Investments in
Financial Subsidiaries/
Overseas
Branches Amount
As a % of Total
Assets NPLs 2/
(a) (b) (c) (d) (e) (f)=(a+b (g)
+c+d-e)
Total Regional Countries 4,675 1,324 5,785 995 1,711 11,068 7.0% 1,614
Malaysia 1,010 8 863 91 761 1,211 0.7% 276
Indonesia 108 149 238 78 114 459 0.3% 75
Thailand (excluding DTDB) 76 9 216 74 115 260 0.2% 188
Korea 3,426 697 966 2 716 4,375 2.8% 18
The Philippines 48 52 151 651 5 897 0.6% 36
DTDB 3/ 7 409 3,351 99 - 3,866 2.4% 1,021
Hong Kong 2,309 2,429 23,130 12,996 14,424 26,440 16.7% 795
China 1,076 10 664 - 341 1,409 0.9% 149
TOTAL 8,060 3,763 29,579 13,991 16,476 38,917 24.6% 2,558
Notes:
1/ Non-bank loans include loans to government and quasi-government entities.
DBS GROUP HOLDINGS LTD AND ITS SUBSIDIARY COMPANIES
3. Non-Performing Loans and Provisions
At June 30, 2004, DBSH Group’s total non-performing loans (“NPLs”) amounted to $2.182 billion. Out of the total NPLs of $2.182 billion, $1.020 billion (47%) were secured by collateral.
Details of DBSH Group’s NPLs and provisions at June 30, 2004 are as follows:
In $ millions Singapore
Hong Kong
Regional Countries2/
Other
Countries Total
Non-Performing Loans 965 544 370 303 2,182
- Substandard 672 389 274 245 1,580
- Doubtful 97 46 6 38 187
- Loss 196 109 90 20 415
NPLs as a % of Group total assets 0.6% 0.3% 0.2% 0.2% 1.3%
Non-bank NPLs as a % of non-bank loans in the
respective countries 1/ 2.4% 2.3% 12.5% 6.9% 3.0%
Total Cumulative Provisions 773 425 391 230 1,819
- Specific provisions 382 182 148 82 794
- General provisions 391 243 243 148 1,025
Total Cumulative Provisions as a % of:
- Group total assets 0.5% 0.3% 0.2% 0.1% 1.1%
- NPLs in the respective countries 80% 78% 106% 76% 83%
- Unsecured NPLs in the respective countries 188% 214% 146% 81% 156%
Details of DBSH Group’s NPLs and provisions at March 31, 2004 are as follows:
Regional Countries2/
In $ millions Singapore
Hong
Kong DTDB 3/ Others
Other
Countries Total
Non-Performing Loans 1,060 584 947 439 329 3,359
- Substandard 766 432 761 302 262 2,523
- Doubtful 68 37 22 46 40 213
- Loss 226 115 164 91 27 623
NPLs as a % of Group total assets 0.6% 0.3% 0.5% 0.3% 0.2% 1.9%
Non-bank NPLs as a % of non-bank loans
in the respective countries 1/ 2.7% 2.6% 26.1% 14.7% 7.8% 4.6%
Total Cumulative Provisions 765 413 541 383 169 2,271
- Specific provisions 388 180 359 184 88 1,199
- General provisions 377 233 182 199 81 1,072
Total Cumulative Provisions as a % of:
- Group total assets 0.5% 0.2% 0.3% 0.2% 0.1% 1.3%
- NPLs in the respective countries 72% 71% 57% 87% 51% 68%
- Unsecured NPLs in the respective countries 191% 197% 118% 116% 54% 132%
Notes:
1/ Computed based on total non-bank customer NPLs (excluding non-performing debt securities and contingent items) divided by total gross non-bank customer loans. 2/ Regional countries (“RC”) include Malaysia, Indonesia, Thailand, Korea and the Philippines
DBS GROUP HOLDINGS LTD AND ITS SUBSIDIARY COMPANIES
3. Non-Performing Loans and Provisions (Continued)
Details of DBSH Group’s NPLs and provisions at December 31, 2003 are as follows:
Regional Countries2/
In $ millions Singapore
Hong
Kong DTDB 3/ Others
Other
Countries Total
Non-Performing Loans 1,255 643 1,044 501 337 3,780
- Substandard 842 475 839 352 269 2,777
- Doubtful 42 66 20 49 27 204
- Loss 371 102 185 100 41 799
NPLs as a % of Group total assets 0.8% 0.4% 0.7% 0.3% 0.2% 2.4%
Non-bank NPLs as a % of non-bank loans
in the respective countries 1/ 3.3% 2.9% 28.8% 19.0% 8.5% 5.2%
Total Cumulative Provisions 851 418 561 389 168 2,387
- Specific provisions 475 190 378 193 87 1,323
- General provisions 376 228 183 196 81 1,064
Total Cumulative Provisions as a % of:
- Group total assets 0.5% 0.3% 0.4% 0.2% 0.1% 1.5%
- NPLs in the respective countries 68% 65% 54% 78% 50% 63%
- Unsecured NPLs in the respective countries 173% 180% 105% 111% 53% 124%
Details of DBSH Group’s NPLs and provisions at June 30, 2003 are as follows:
Regional Countries2/
In $ millions Singapore
Hong
Kong DTDB 3/ Others
Other
Countries Total
Non-Performing Loans 1,449 795 1,021 593 305 4,163
- Substandard 942 591 865 414 205 3,017
- Doubtful 32 92 9 81 81 295
- Loss 475 112 147 98 19 851
NPLs as a % of Group total assets 0.9% 0.5% 0.6% 0.4% 0.2% 2.6%
Non-bank NPLs as a % of non-bank loans
in the respective countries 1/ 3.9% 3.5% 29.2% 26.5% 8.7% 5.9%
Total Cumulative Provisions 897 462 565 416 156 2,496
- Specific provisions 536 227 383 225 108 1,479
- General provisions 361 235 182 191 48 1,017
Total Cumulative Provisions as a % of:
- Group total assets 0.6% 0.3% 0.4% 0.3% 0.1% 1.6%
- NPLs in the respective countries 62% 58% 55% 70% 51% 60%
- Unsecured NPLs in the respective countries 150% 171% 101% 102% 59% 119%
Notes:
1/ Computed based on total non-bank customer NPLs (excluding non-performing debt securities and contingent items) divided by total gross non-bank customer loans. 2/ Regional countries (“RC”) include Malaysia, Indonesia, Thailand, Korea and the Philippines
DBS GROUP HOLDINGS LTD AND ITS SUBSIDIARY COMPANIES
3. Non-Performing Loans and Provisions (Continued)
Analysis of Non-Performing Loans by Industry
The following table shows the industry breakdown of the non-performing loans of DBSH Group:
June 30, 2004 March 31, 2004 December 31, 2003 June 30, 2003
In $ millions NPLs
Specific
Provisions NPLs
Specific
Provisions NPLs
Specific
Provisions NPLs
Specific Provisions
Customer loans
Manufacturing 583 234 802 324 894 360 898 356
Building and Construction 251 57 354 87 414 98 405 121
Housing Loans 253 74 307 83 333 90 373 101
General Commerce 187 93 500 254 573 287 724 333
Transportation, Storage and
Communications 45 4 73 9 98 25 128 34
Financial Institutions, Investment and
Holding Companies 128 45 145 51 199 65 298 83
Professionals and Private Individuals
(except Housing Loans) 219 100 280 127 276 133 273 139
Others 351 103 635 153 695 165 722 178
Sub-total 2,017 710 3,096 1,088 3,482 1,223 3,821 1,345
Debt securities 145 65 172 78 184 73 214 108
Contingent items 20 19 91 33 114 27 128 26
Total 2,182 794 3,359 1,199 3,780 1,323 4,163 1,479
Analysis of Non-Performing Loans by Period Overdue
In $ millions June 30, 2004 March 31, 2004 December 31, 2003 June 30, 2003
Non-default 682 1,427 1,695 1,691
Default loans 1,500 1,932 2,085 2,472
Less than 3 months 387 477 448 463
3 to 6 months 172 223 256 582
Over 6 months 941 1,232 1,381 1,427
DBS GROUP HOLDINGS LTD AND ITS SUBSIDIARY COMPANIES
4. Financial Derivatives
Financial derivatives are financial instruments whose characteristics are derived from the underlying assets, or from interest and exchange rates or indices. These include forwards, swaps, futures and options.
The following tables summarise the contractual or underlying principal amounts of derivative financial instruments held or issued for trading and non-trading purposes. The notional or contractual amounts of these instruments indicate the volume of transactions outstanding at the balance sheet date; they do not represent amounts at risk.
In the financial statements, trading derivative financial instruments are revalued on a gross position basis and the unrealised gains or losses are reflected in “Other assets” or “Other liabilities” respectively. Non-trading derivative financial instruments are accounted for on an accrual basis.
June 30, 2004
Trading Non-Trading
In $ millions
Underlying Notional
Positive Fair Value
Negative Fair Value
Underlying Notional
Positive Fair Value
Negative Fair Value
Interest Rate Derivatives 1,218,099 6,159 5,581 20,545 644 158
Foreign Exchange Derivatives 281,060 1,753 1,969 1,079 - 36
Equity Derivatives 12,766 104 355 - -
-Credit Derivatives 13,090 90 114 2,425 77
-Total 1,525,015 8,106 8,019 24,049 721 194
March 31, 2004
Trading Non-Trading