DBS Group Holdings Ltd Incorporated in the Republic of Singapore Company Registration Number: 199901152M
To: Shareholders
The DBS Group Holdings Ltd (“DBSH” or “the Company”) Board of Directors report unaudited financial results for the third quarter ended September 30, 2005.
For the third quarter of 2005, the Directors have declared an interim gross preference dividend of 4 cents for each DBSH non-voting convertible preference share (“CPS”) and each DBSH non-voting redeemable CPS, and an interim gross ordinary dividend of 15 cents for each DBSH ordinary share (second quarter 2005 : 15 cents ; third quarter 2004: not applicable1/ ).
The third quarter 2005 dividends will be paid less 20% Singapore income tax.
The third quarter 2005 dividends will be payable on November 28, 2005. DBS shares will be quoted ex-dividend on November 11, 2005. Notice is hereby given that the Share Transfer Books and Register of Members of the Company will be closed on November 16, 2005. Duly completed transfers received by the Company's Registrar, Barbinder & Co Pte Ltd of 8 Cross Street #11-00 PWC Building, Singapore 048424 up to 5.00 p.m. on November 15, 2005 will be registered to determine shareholders' entitlement to the third quarter 2005 dividends. In respect of ordinary shares in the securities accounts with The Central Depository (Pte) Limited (“CDP”), the third quarter 2005 dividends will be paid by DBSH to CDP, which will in turn distribute the dividend entitlements to shareholders.
Performance Summary
Unaudited Financial Results
for the Third Quarter ended
September 30, 2005
Contents
Page
Financial Highlights 2
Financial Review 3
Net Interest Income and Net Interest Margin 4
Non-Interest Income 5
Operating Expenses 6
Provision Charge 6
Balance Sheet 7
Asset Quality 7
Customer Loans 9
Deposits 10
Capital Adequacy Ratio 11
Unrealised Valuation Surpluses 11
Business Segment Analysis 12
Geographical Segment Analysis 16
Comparatives 16
Appendix I: Unaudited Consolidated Profit and Loss Account Appendix II: Unaudited Consolidated Balance Sheet
Appendix III: Unaudited Balance Sheet of DBS Group Holdings Ltd Appendix IV: Unaudited Statements of Changes in Shareholders’ Equity Appendix V: Unaudited Consolidated Cash Flow Statement
Appendix VI: Selected Notes to the Accounts 1. Issuance of Ordinary Shares
Financial Highlights
DBS Group Holdings Ltd (“DBSH”) prepares its consolidated DBSH Group (“Group”) financial statements in accordance with Singapore Financial Reporting Standards (“FRS”).
In $ millions
3rd Qtr 2005
3rd Qtr 2004
+/(-) %
2nd Qtr 2005
9 Mths 2005
9 Mths 2004
+/(-) % For the period
Operating income 1,079 1,098 (2) 1,092 3,249 3,940 (18)
Operating profit before provisions and
goodwill amortisation 550 595 (8) 592 1,709 2,427 (30)
Net profit attributable to shareholders
(before goodwill amortisation) 446 459 (3) 441 1,299 2,002 (35)
Net profit attributable to shareholders 446 349 28 441 1,299 1,672 (22)
At period-end
Equity attributable to shareholders 17,336 16,117 8 17,040 17,336 16,117 8
Customer loans 1/ 78,776 67,216 17 78,712 78,776 67,216 17
Customer deposits 114,918 107,008 7 115,933 114,918 107,008 7
Total assets 182,577 165,971 10 183,674 182,577 165,971 10
Per share (in $)
Basic earnings excluding goodwill
amortisation 2/ 1.18 1.22 (3) 1.17 1.15 1.67 (31)
Basic earnings 2/ 1.18 0.93 27 1.17 1.15 1.38 (17)
Diluted earnings 2/ 1.14 0.90 27 1.12 1.11 1.33 (17)
Net asset value at period-end 3/
(i) based on existing ordinary share capital 11.29 10.51 7 11.11 11.29 10.51 7 (ii) assuming non-voting convertible
preference shares (“CPS”) and non-voting redeemable CPS are converted to
ordinary shares 11.09 10.34 7 10.92 11.09 10.34 7
Performance ratios
(%)
3rd Qtr 2005
3rd Qtr 2004
2nd Qtr 2005
9 Mths 2005
9 Mths 2004 On a GAAP basis
Return on assets 2/ 0.98 0.83 0.96 0.97 1.27
Return on equity 2/ 3/ 10.39 8.68 10.42 10.28 13.34
Excluding goodwill amortisation
Return on assets 2/ 0.98 1.09 0.96 0.97 1.54
Return on equity 2/ 3/ 10.39 11.42 10.42 10.28 16.19
Efficiency and revenue mix ratios Cost-to-income ratio (excluding goodwill
amortisation) 49.0 45.8 45.8 47.4 38.4
As a percentage of total operating income:
- net interest income 67.5 59.4 63.6 64.4 49.5
- non-interest income 32.5 40.6 36.4 35.6 50.5
Capital adequacy ratios (at period-end)
- Tier 1 capital 10.4 11.8 10.6 10.4 11.8
- Total capital 14.7 15.4 14.7 14.7 15.4
Notes:
1/ After deducting cumulative provisions.
Financial Review
For the third quarter of 2005, DBSH Group’s net profit attributable to shareholders (“net profit”) was $446 million, up 28% from the corresponding period last year.
Compared to second quarter 2005, net profit for third quarter 2005 went up 1% as higher net interest income and lower provisions were offset by lower non-interest income and higher operating expenses.
· Operating income of $1.079 billion decreased marginally by 2% from third quarter 2004 due to lower
non-interest income, partially offset by higher net interest income. Similarly, operating income declined marginally by 1% from last quarter. Net interest margins rose 2 basis points from third quarter 2004 and 7 basis points from second quarter 2005 to 1.87%. Non-interest income fell in third quarter 2005 as compared to last year due to lower net gains from treasury-related activities, cushioned by higher fee and commission income. Compared to second quarter 2005, fee and commission income was lower.
· Operating expenses rose 5% from third quarter 2004 and 6% from second quarter 2005 to $529 million
due to higher computerisation and advertising expenses, resulting in a higher cost-to-income ratio of 49.0% as compared to last quarter’s 45.8%.
· Provisions of $4 million for the third quarter 2005 were lower than that for a year ago and for last
quarter due to write-backs in general provisions (consistent with MAS guidelines under Notice 612). In addition, specific provisions for loans were lower compared to second quarter 2005 with a reducing quantum of non-performing loans. By comparison, provision charges were $28 million in third quarter 2004 and $81 million in second quarter 2005.
Profit and Loss Account 1/ In $ millions
3rd Qtr 2005
3rd Qtr 2004
+/(-) %
2nd Qtr 2005
9 Mths 2005
9 Mths 2004
+/(-) %
Net interest income 728 652 12 695 2,093 1,951 7
Non-interest income 351 446 (21) 397 1,156 1,989 (42)
Operating income 1,079 1,098 (2) 1,092 3,249 3,940 (18)
Operating expenses (529) (503) 5 (500) (1,540) (1,513) 2
Operating profit before provisions 2/ 550 595 (8) 592 1,709 2,427 (30)
Provisions (4) (28) (86) (81) (148) (93) 59
Operating profit 2/ 546 567 (4) 511 1,561 2,334 (33)
Share of profits less losses of associated
companies 17 18 (6) 22 51 52 (2)
Net profit before taxation 2/ 563 585 (4) 533 1,612 2,386 (32)
Taxation (101) (113) (11) (79) (271) (345) (21)
Net profit after taxation 2/ 462 472 (2) 454 1,341 2,041 (34)
Minority interests (16) (13) 23 (13) (42) (39) 8
Net profit attributable to shareholders
(before goodwill amortisation) 446 459 (3) 441 1,299 2,002 (35)
Goodwill amortisation - (110) NM - - (330) NM
Net profit attributable to shareholders 446 349 28 441 1,299 1,672 (22)
NM: Not meaningful Notes:
1/ Figures for prior periods have been restated to reflect the change in accounting policies (Appendix VI, note 4).
Net Interest Income and Net Interest Margin
Table 1
Group Net Interest Income and Net Interest Margin 1/
3rd Qtr 2005 3rd Qtr 2004 2nd Qtr 2005
In $ millions
Average balance Interest Average rate (%) Average balance Interest Average rate (%) Average balance Interest Average rate (%) Customer loans and
advances 78,339 845 4.28 65,988 572 3.45 74,336 724 3.91
Interbank placements and
loans 24,099 142 2.34 27,905 83 1.18 30,806 169 2.20
Securities 51,785 453 3.47 46,232 337 2.90 49,483 425 3.45
Total interest bearing assets 154,223 1,440 3.70 140,125 992 2.82 154,625 1,318 3.42 Customer deposits 115,775 396 1.36 106,978 184 0.69 116,310 335 1.16 Debt securities and bank
borrowings 33,478 316 3.75 27,694 156 2.25 33,312 288 3.47
Total interest bearing liabilities 149,253 712 1.89 134,672 340 1.00 149,622 623 1.67
Net interest income/margin 728 1.87 652 1.85 695 1.80
9 Mths 2005 9 Mths 2004
In $ millions
Average balance Interest Average rate (%) Average balance Interest Average rate (%) Customer loans and
advances 74,444 2,185 3.92 66,449 1,717 3.45
Interbank placements and
loans 30,092 492 2.19 31,242 272 1.16
Securities 49,205 1,258 3.42 44,875 970 2.89
Total interest bearing assets 153,741 3,935 3.42 142,566 2,959 2.77 Customer deposits 115,629 995 1.15 109,800 522 0.64 Debt securities and bank
borrowings 33,118 847 3.42 28,600 486 2.27
Total interest bearing liabilities 148,747 1,842 1.66 138,400 1,008 0.97
Net interest income/margin 2,093 1.82 1,951 1.83
Note:
1/ Net interest margin is net interest income expressed as a percentage of average interest-earning assets. It is computed on an annualised basis.
Exhibit 1
Group Net Interest Income and Net Interest Margin
2 ,6 78 2,40 5
2 ,5 92 2,09 3
64 0 65 9 6 5 2 6 41 6 70 69 5 7 28 2.02
1.81 1 .81 1 .8 1 1.85
1 .7 6 1.78 1 .8 0 1.87 1 .8 2
1 .80 0 500 1,000 1,500 2,000 2,500 3,000
2002 2003 2004 9M05 1Q04 2Q04 3Q04 4Q04 1Q05 2Q05 3Q05 0 1 2 3
Net Interes t Incom e Net Interes t Margin (% )
$ m
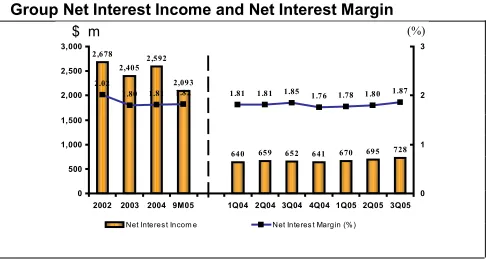
Net interest income grew 12% over third quarter 2004 to $728 million in third quarter 2005. Compared to second quarter 2005, net interest income increased 5%.
· The increase in net interest income over third quarter 2004 was largely due to increased lending
volumes, as end-period customer loans grew 17% year-on-year.
· Net interest margin for third quarter 2005 was 1.87%, 2 basis points higher than 1.85% for third
quarter 2004. Compared to second quarter 2005, net interest margin improved 7 basis points with more funds deployed to higher yielding customer loans and debt securities. The widening spread between Prime rate and HIBOR in Hong Kong also contributed to the increase in net interest margin.
Non-Interest Income
Table 2Group Non-Interest Income
In $ millions
3rd Qtr 2005
3rd Qtr 2004 +/(-)%
2nd Qtr 2005
9 Mths 2005
9 Mths 2004
+/(-) %
Fee and commission income
Stockbroking 52 41 27 36 135 153 (12)
Investment banking 30 21 43 37 90 69 30
Trade and remittances 46 43 7 46 131 122 7
Loan related 29 39 (26) 55 129 124 4
Guarantees 8 6 33 6 22 20 10
Deposit related 19 20 (5) 19 57 62 (8)
Credit card 25 21 19 25 67 64 5
Fund management 12 9 33 19 41 33 24
Wealth management 34 42 (19) 37 108 100 8
Others 11 10 10 10 30 30
Total 266 252 6 290 810 777 4
Dividend and rental income 27 31 (13) 36 75 88 (15)
Other income
Net gain on treasury related activities 26 144 (82) 27 164 497 (67)
Net gain on investment securities 27 20 35 40 92 619 1/ (85)
Net gain on fixed assets 4 (1) NM 1 8 4 100
Others 1 - NM 3 7 4 75
Total 58 163 (64) 71 271 1,124 (76)
Total non-interest income 351 446 (21) 397 1,156 1,989 (42)
Non-interest income as a percentage of
operating income (%) 32.5 40.6 36.4 35.6 50.5
Note:
1/ Includes one-time gains of $497 million.
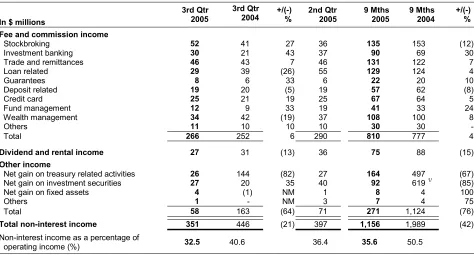
Third quarter 2005 non-interest income of $351 million was 21% lower than third quarter 2004. Compared to second quarter 2005, non-interest income was 12% lower.
· Fee and commission income in the third quarter 2005 grew 6% to $266 million compared to the same quarter last year, due to higher fees earned from stockbroking and investment banking activities, partially offset by lower fees from loan syndication and wealth management activities. Compared to the stronger showing in second quarter 2005, loan syndication activity slowed, resulting in an 8% decrease in fee and commission income. Stockbroking fees were higher in third quarter 2005, following a comparatively more buoyant equity market in Singapore led by interest in property counters.
Operating Expenses
Table 3Group Operating Expenses
In $ millions 3rd Qtr2005
3rd Qtr 2004
+/(-) %
2nd Qtr 2005
9 Mths 2005
9 Mths 2004
+/(-) %
Staff costs 255 247 3 253 773 736 5
Occupancy expenses 48 49 (2) 43 134 141 (5)
Computerisation expenses 82 74 11 71 227 230 (1)
Revenue-related expenses 46 44 5 44 137 147 (7)
Others 98 89 10 89 269 259 4
Total operating expenses 529 503 5 500 1,540 1,513 2
Cost-to-income ratio (%) 49.0 45.8 45.8 47.4 38.4 1/
Staff headcount number (at period-end) 12,562 11,083 12,090 12,562 11,083
Note:
1/ Income includes one-time gains of $497 million.
Operating expenses for third quarter 2005 was $529 million, an increase of 5% when compared to third quarter 2004 and 6% when compared to second quarter 2005.
· Staff costs increased 3% from third quarter 2004 due to higher headcount and wage pressures in 2005. The increase was marginal compared to second quarter 2005 as performance-related bonus accruals were lower.
· Computerisation expenses increased 11% as we continue to make investments in system initiatives.
· General expenses increased in line with higher headcount, as well as higher occupancy and promotional and advertising expenses.
Provision Charge
Table 4Group Provision Charge
In $ millions 3rd Qtr2005
3rd Qtr 2004
+/(-) %
2nd Qtr 2005
9 Mths 2005
9 Mths 2004
+/(-) % Specific provision (“SP”)
Loans
Singapore 10 (18) NM 26 58 12 >100
Hong Kong 17 17 - 10 39 59 (34)
Other countries 3 - NM 15 28 (15) NM
Sub-Total 30 (1) >100 51 125 56 >100
Securities, properties and other assets 10 13 (23) 9 23 28 (18)
Total Specific provision 40 12 >100 60 148 84 76
General provision (36) 16 NM 21 - 9 NM
Total provision charge 4 28 (86) 81 148 93 59
SP (loans) / Average loan (basis point) 15 -1 27 22 11
NM: Not meaningful
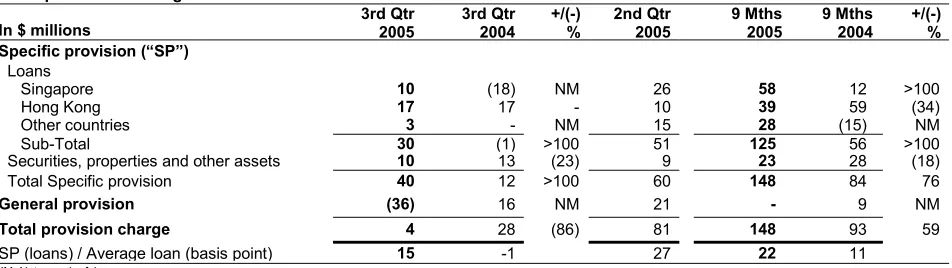
Total provision charge for third quarter 2005 was $4 million, compared to $28 million for third quarter 2004 and $81 million for second quarter 2005.
· Specific provision charge for loans in third quarter 2005 increased to $30 million compared to a write-back of $1 million in the same quarter last year. This was mainly due to higher loan recoveries in third quarter 2004. Compared to second quarter 2005, specific provision charge for loans in this quarter was lower by $21 million.
[image:8.612.61.537.404.538.2]Balance Sheet
Table 5Group Key Balance Sheet Items
In $ millions
Sep 30 2005 Jun 30 2005 Dec 31 2004 Sep 30 2004
Total assets 182,577 183,674 175,438 165,971
Customer loans 1/
78,776 78,712 69,659 67,216
Customer deposits 114,918 115,933 113,206 107,008
Loan-to-deposit ratio (%) 68.6 67.9 61.5 62.8
Note:
1/ After deducting cumulative provisions.
At September 30, 2005, total assets were $182.6 billion.
· Compared to end June 2005, customer loans grew marginally by $0.1 billion to $78.8 billion. Customer deposits declined by $1.0 billion to $114.9 billion due to decline in foreign currency deposits.
· The Group’s loan-to-deposit ratio improved 0.7% to 68.6% at end September 2005.
Asset Quality
Exhibit 2
Group Non-Performing Loans
Table 6
Group Geographical NPL Rate (Based on MAS standard)
(%) Sep 30 2005 Jun 30 2005 Dec 31 2004 Sep 30 2004
Singapore 2.1 2.1 2.2 2.2
Hong Kong 1.6 1.8 2.0 2.2
South and
Southeast Asia 3.6 4.6 6.3 7.1
Rest of Greater
China 2.5 2.8 5.0 5.0
Rest of the World 2.5 2.7 4.6 5.3
Group NPL rate 2.0 2.2 2.5 2.6
3,359 1,807 1,896 1,928 1,919 1,934 2,182 4,224 3,780 1,919 2.0 4.6 2.4 2.2 6.1 5.2
2.5 3.0 2.6 2.5
0 2,000 4,000 6,000 Dec 02 Dec 03 Dec 04 Mar 04 Jun 04 Sep 04 Dec 04 Mar 05 Jun 05 Sep-05 -10 -5 0 5 10
S'pore Hong Kong (HK) Rest of Greater China South and Southeast Asia Rest of the World DTDB
NPL/Loans %
Note:
1/ NPL rate is computed based on total non-bank customer NPLs (excluding non-performing debt securities and contingent items) divided by total gross non-bank customer loans.
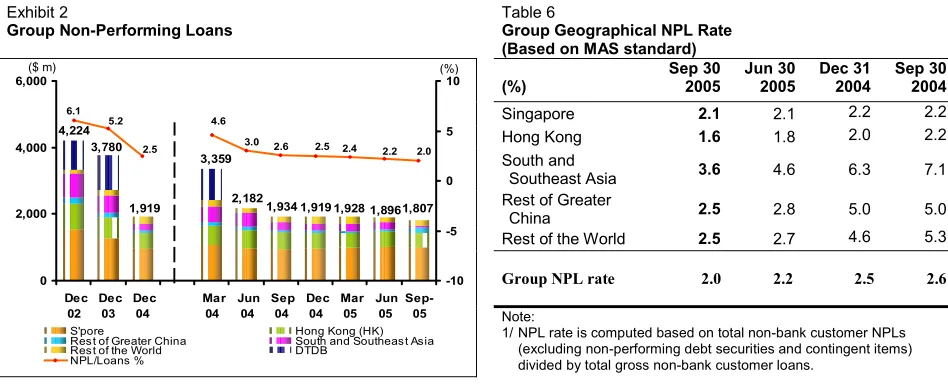
· Non-performing loans (“NPLs”) continued to trend downwards to $1.8 billion at end September 2005. Out of the $1.8 billion NPLs, $0.5 billion or 28% were restructured NPLs.
· Singapore NPLs were $1.0 billion and accounted for 55% of the Group’s NPLs, while Hong Kong NPLs of $0.4 billion accounted for 24%.
· The ratio of NPLs to total non-bank loans (“NPL rate”) further improved from 2.2% at end June 2005 to 2.0% at end September 2005. NPL rates across countries were either stable or improved.
Loan Grading
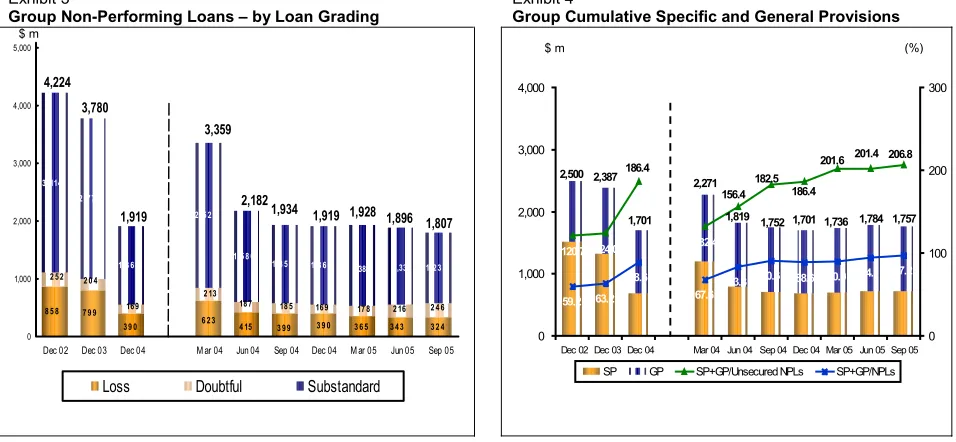
Of the total $1.8 billion NPLs at end September 2005, 68% were classified as substandard, 14% as doubtful and the remaining 18% in the loss category. 53% of the NPLs were secured by collateral.
Cumulative Specific and General Provisions
Total cumulative specific and general provisions at end September 2005 were 206.8% of unsecured NPLs, and 97.2% of total NPLs.
Exhibit 3
Group Non-Performing Loans – by Loan Grading
Exhibit 4
Group Cumulative Specific and General Provisions
8 5 8 3 , 114
2 , 7 7 7
1, 3 6 0
2 , 5 2 3
1, 5 8 0
1, 3 5 0 1, 3 6 0 1, 2 3 7
3 9 0 6 2 3 4 15 3 9 9 3 9 0 3 6 5 3 4 3 3 2 4
7 9 9 18 7 18 5 16 9 17 8
2 13 2 0 4
2 5 2
2 16 2 4 6 16 9 1,337 1,385 1,896 4,224 3,780 1,919 3,359 2,182
1,934 1,919 1,928
1,807 0 1,000 2,000 3,000 4,000 5,000
Dec 02 Dec 03 Dec 04 M ar 04 Jun 04 Sep 04 Dec 04 M ar 05 Jun 05 Sep 05
Loss Doubtful Substandard
1,701 1,752 1,819 2,271 1,701 2,387 2,500 1,784 1,736 1,757 59.2 63.2 88.6 67.6
83.3 90.6 90.0 94.1 97.2 120.7 124.0 132.4
206.8 201.4 186.4 201.6 186.4 156.4 182.5 88.6 0 1,000 2,000 3,000 4,000
Dec 02 Dec 03 Dec 04 Mar 04 Jun 04 Sep 04 Dec 04 Mar 05 Jun 05 Sep 05
0 100 200 300
SP GP SP+GP/Unsecured NPLs SP+GP/NPLs
[image:10.612.60.538.194.415.2]Restructured Loans
Table 7
Loans that were restructured and classified
Sep 30, 2005 Jun 30, 2005 Dec 31, 2004 Sep 30, 2004
In $ millions NPLs
Specific provisions NPLs Specific Provisions NPLs Specific Provisions NPLs Specific provisions
Substandard 446 83 503 96 351 34 375 33
Doubtful 23 31 19 19 10 10 13 13
Loss 43 44 45 45 58 58 78 78
Total 512 158 567 160 419 102 466 124
$ m (%)
Table 8
Group Customer Loans
In $ millions
Sep 30 2005
Jun 30 2005
Dec 31 2004
Sep 30 2004
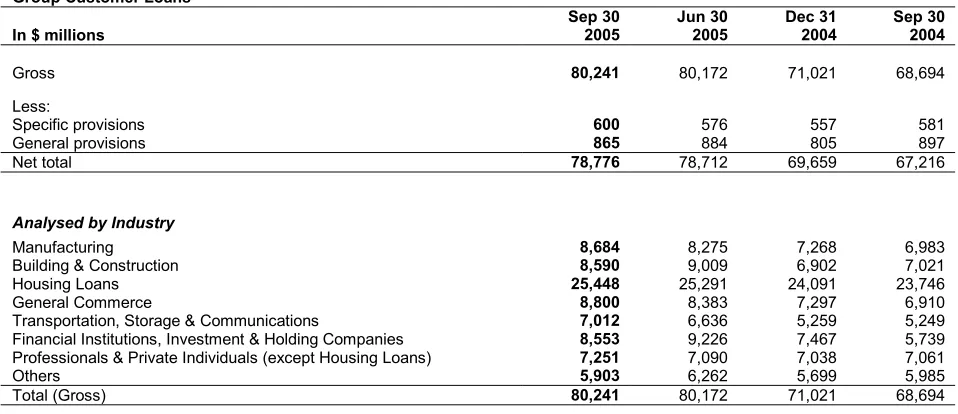
Gross 80,241 80,172 71,021 68,694
Less:
Specific provisions 600 576 557 581
General provisions 865 884 805 897
Net total 78,776 78,712 69,659 67,216
Analysed by Industry
Manufacturing 8,684 8,275 7,268 6,983
Building & Construction 8,590 9,009 6,902 7,021
Housing Loans 25,448 25,291 24,091 23,746
General Commerce 8,800 8,383 7,297 6,910
Transportation, Storage & Communications 7,012 6,636 5,259 5,249 Financial Institutions, Investment & Holding Companies 8,553 9,226 7,467 5,739 Professionals & Private Individuals (except Housing Loans) 7,251 7,090 7,038 7,061
Others 5,903 6,262 5,699 5,985
Total (Gross) 80,241 80,172 71,021 68,694
Analysed by Currency and Fixed / Variable Rates
Fixed rate 1/
Singapore dollar 8,776 9,804 10,046 9,987
Hong Kong dollar 381 464 458 412
US dollar 144 109 82 24
Others 430 240 342 296
Sub-total 9,731 10,617 10,928 10,719
Variable rate 2/
Singapore dollar 27,174 26,177 23,899 22,802
Hong Kong dollar 24,011 23,639 21,432 21,433
US dollar 13,913 14,890 10,464 9,817
Others 5,412 4,849 4,298 3,923
Sub-total 70,510 69,555 60,093 57,975
Total (Gross) 80,241 80,172 71,021 68,694
Notes:
1/ Fixed rate loans refer to long-term loans where the interest rates are fixed for the initial 1 to 3 years for certain mortgage loans, and over the entire loan period for other loans.
Table 9
Total Group Deposits
In $ millions
Sep 30 2005
Jun 30 2005
Dec 31 2004
Sep 30 2004
Deposits of non-bank customers 114,918 115,933 113,206 107,008
Deposits and balances of banks 9,995 12,053 10,939 10,453
Total 124,913 127,986 124,145 117,461
Table 10
Group Customer Deposits
In $ millions
Sep 30 2005
Jun 30 2005
Dec 31 2004
Sep 30 2004
Analysed by Currency
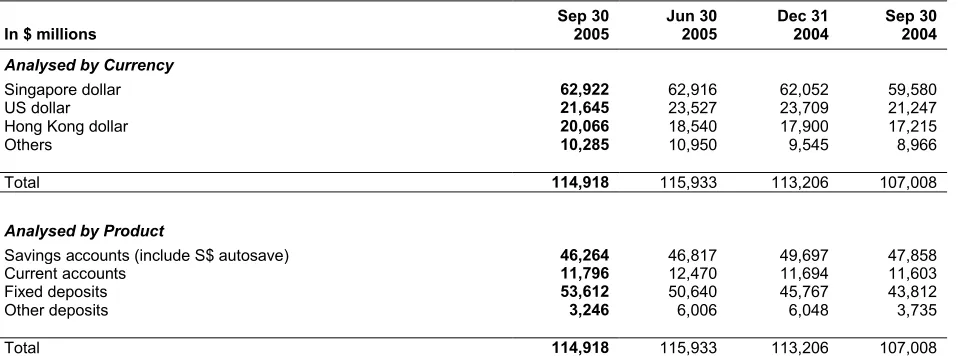
Singapore dollar 62,922 62,916 62,052 59,580
US dollar 21,645 23,527 23,709 21,247
Hong Kong dollar 20,066 18,540 17,900 17,215
Others 10,285 10,950 9,545 8,966
Total 114,918 115,933 113,206 107,008
Analysed by Product
Savings accounts (include S$ autosave) 46,264 46,817 49,697 47,858
Current accounts 11,796 12,470 11,694 11,603
Fixed deposits 53,612 50,640 45,767 43,812
Other deposits 3,246 6,006 6,048 3,735
[image:12.612.62.541.178.356.2]Capital Adequacy Ratio
Exhibit 5Group Capital Adequacy Ratio
11.3 10.9 10.6 10.4
4.0 4.5 4.4
4.1 4.3
10.3 10.5 11.3 10.411.6 11.8
4.6 4.5 4.1
5.2 3.6
14.7 15.5 15.1 15.8 14.5 15.6 15.4 15.8 15.3 14.7
0 5 10 15 20 Dec 02 Dec 03 Dec 04 Mar 04 Jun 04 Sep 04 Dec 04 Mar 05 Jun 05 Sep 05
Tier 1 Tier 2
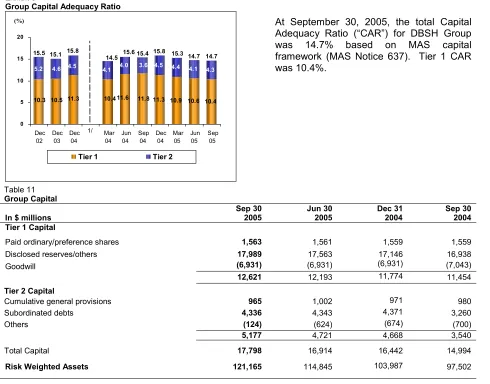
[image:13.612.59.549.69.453.2]At September 30, 2005, the total Capital Adequacy Ratio (“CAR”) for DBSH Group was 14.7% based on MAS capital framework (MAS Notice 637). Tier 1 CAR was 10.4%.
Table 11 Group Capital
In $ millions
Sep 30 2005 Jun 30 2005 Dec 31 2004 Sep 30 2004 Tier 1 Capital
Paid ordinary/preference shares 1,563 1,561 1,559 1,559
Disclosed reserves/others 17,989 17,563 17,146 16,938
Goodwill (6,931) (6,931) (6,931) (7,043)
12,621 12,193 11,774 11,454
Tier 2 Capital
Cumulative general provisions 965 1,002 971 980
Subordinated debts 4,336 4,343 4,371 3,260
Others (124) (624) (674) (700)
5,177 4,721 4,668 3,540
Total Capital 17,798 16,914 16,442 14,994
Risk Weighted Assets 121,165 114,845 103,987 97,502
Note:
1/ With effect from 2004, ratios were computed based on MAS Notice 637. Comparatives for 2003 and before were not restated and were computed using the Bank for International Settlements (“BIS”) guidelines.
Unrealised Valuation Surpluses
Table 12
Group Unrealised Valuation Surpluses
In $ millions
Sep 30 2005 Jun 30 2005 Dec 31 2004 Sep 30 2004
Properties 756 751 653 566
Quoted investments 45 40 531 402
Total 801 791 1,184 968
Note:
1/ The decline in unrealised valuation surpluses of quoted investments from end December 2004 was mainly due to the recognition of fair value changes in available-for-sale investments in balance sheet reserves with the adoption of FRS 39 from January 1, 2005.
(%)
[image:13.612.58.537.543.607.2]Business Segment Analysis
The business segment results represent the customer segments of the respective businesses and are determined by:
· Income and direct expenses attributable to each customer and other segment; and
· Management accounting policies relating to the allocation of indirect expenses and funds transfer pricing between the central treasury unit and customer/other segments.
The various customer segments are described below, along with a description of the change in net profit after taxation for third quarter 2005 over third quarter 2004 and for first nine months 2005 over first nine months 2004.
· Consumer Banking
Consumer Banking provides individual customers with a diverse range of banking and related financial services. The products and services offered to customers include current and savings accounts, loans and home finance, cards, payments and investment products.
Quarter-on-quarter, net profit after taxation increased ($30 million, 25%) on the back of higher net interest income resulting from higher interbank rates.
Year-on-year, the increase in net profit after taxation ($108 million, 31%) was also due to higher net interest income resulting from higher interbank rates as well as growth in customer loan and deposit volumes.
· Enterprise Banking
Enterprise Banking provides financial services and products to small and medium-sized businesses. The products and services offered to customers include credit facilities (overdraft, factoring/accounts receivable purchase, trade services and financing, commercial/industrial property financing, hire purchase and government financing and assistance schemes), deposit, payment and collection services and treasury products.
Net profit after taxation was in line with third quarter 2004.
Year-on-year, the increase in net profit after taxation ($6 million, 3%) was mainly attributable to lower provisions.
· Corporate and Investment Banking
Corporate and Investment Banking provides tailored and unique financial solutions to large corporate and institutional clients. The products and services offered to customers include direct lending, corporate finance and advisory banking services for mergers and acquisitions, capital raising through debt and equity markets, capital restructuring, syndicated finance, securities and fiduciary services, cash management and trade services, and private equity.
Quarter-on-quarter, the decrease in net profit after taxation ($39 million, 30%) was mainly due to higher provisions.
The other segments of the analysis are:
· Global Financial Markets
Global Financial Markets provides treasury services to corporations, institutional and private investors, financial institutions and other market participants. It is primarily involved in market making, structuring, equity and debt sales and trading across a broad range of financial products including foreign exchange, interest rate/credit/equity and other structured derivatives. Income from financial products and services relating to other customer segments, e.g. Consumer Banking, Enterprise Banking and Corporate and Investment Banking, is reflected in the respective customer segments.
Global Financial Markets also provides equity services through DBS Vickers Securities (“DBSV”). DBSV offers a wide range of services including research, sales and trading for institutional, corporate and private clients and share placement.
Quarter-on-quarter, the decrease in net profit after taxation ($79 million, 66%) was largely due to lower gains from foreign exchange, equity and interest rate products.
Year-on-year, the decrease in net profit after taxation ($284 million, 65%) was also mainly due to lower gains from foreign exchange, equity and interest rate products.
· Central Treasury Unit
Central Treasury Unit is responsible for the management of the Group's asset and liability interest rate positions and investment of the Group's excess liquidity and shareholders’ funds.
Quarter-on-quarter,net profit after taxation was in line with third quarter 2004.
Year-on-year, the decrease in net profit after taxation ($75 million, 37%) was due to lower gapping income resulting from flattening of interest rate yield curves and first quarter 2004 benefiting from profit on sales of bonds.
· Central Operations
Central Operations encompass a range of activities resulting from central corporate decisions and the related income and expenses not attributed to business segments. These include funding costs of DBSH Group’s associated and subsidiary companies and gains/losses on properties. Private banking activities and asset management activities are included in this segment.
Quarter-on-quarter, the increase in net profit after taxation was largely due to higher income from private banking and asset management activities, coupled with lower centralized expenses and provisions.
The following table analyses the results, total assets and total liabilities by business segments:
Table 13
Group Business Segments (3rd Qtr 2005)
In $ millions Consumer
Banking
Enterprise Banking
Corporate and Investment
Banking
Global Financial
Markets
Central Treasury Unit
Central
Operations Total
Operating income 423 188 175 155 64 74 1,079
Operating profit before provisions and goodwill
amortisation 183 114 94 47 55 57 550
Net profit before taxation and goodwill amortisation 185 101 110 51 63 53 563
Taxation (36) (18) (18) (10) (7) (12) (101)
Net profit after taxation and before goodwill
amortisation 149 83 92 40 56 26 446
Goodwill amortisation
-Net profit attributable to shareholders 446
Other Information
Total assets before goodwill 30,081 19,090 32,094 68,486 23,934 1,961 175,646
Goodwill 6,931
Total assets 182,577
Total liabilities 67,827 17,488 14,314 39,829 2,131 22,503 164,092
Capital expenditure 3 3 1 3 1 36 47
Depreciation 7 4 1 4 2 18 36
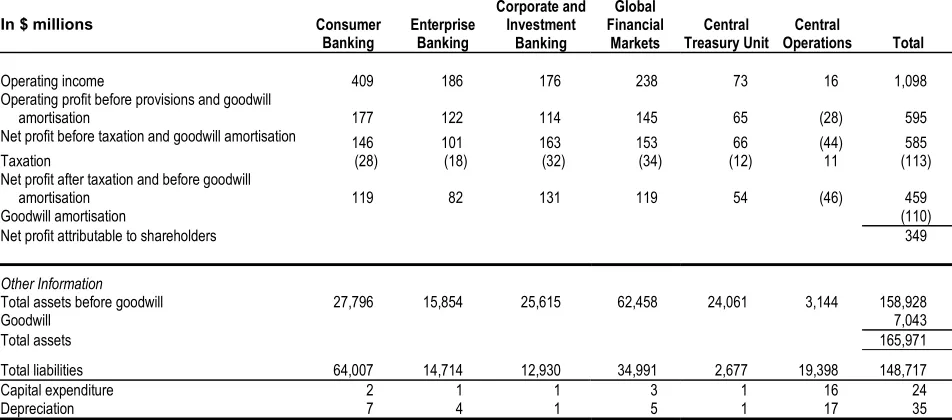
Group Business Segments (3rd Qtr 2004)
In $ millions Consumer
Banking
Enterprise Banking
Corporate and Investment
Banking
Global Financial
Markets
Central Treasury Unit
Central
Operations Total
Operating income 409 186 176 238 73 16 1,098
Operating profit before provisions and goodwill
amortisation 177 122 114 145 65 (28) 595
Net profit before taxation and goodwill amortisation 146 101 163 153 66 (44) 585
Taxation (28) (18) (32) (34) (12) 11 (113)
Net profit after taxation and before goodwill
amortisation 119 82 131 119 54 (46) 459
Goodwill amortisation (110)
Net profit attributable to shareholders 349
Other Information
Total assets before goodwill 27,796 15,854 25,615 62,458 24,061 3,144 158,928
Goodwill 7,043
Total assets 165,971
Total liabilities 64,007 14,714 12,930 34,991 2,677 19,398 148,717
Capital expenditure 2 1 1 3 1 16 24
Table 13
Group Business Segments (9 Mths 2005)
In $ millions Consumer
Banking
Enterprise Banking
Corporate and Investment
Banking
Global Financial
Markets
Central Treasury Unit
Central
Operations Total
Operating income 1,263 548 578 469 165 226 3,249
Operating profit before provisions and goodwill
amortisation 580 338 349 158 141 143 1,709
Net profit before taxation and goodwill amortisation 568 285 324 188 152 95 1,612
Taxation (110) (51) (54) (36) (24) 4 (271)
Net profit after taxation and before goodwill
amortisation 458 234 270 151 128 58 1,299
Goodwill amortisation
-Net profit attributable to shareholders 1,299
Other Information
Total assets before goodwill 30,081 19,090 32,094 68,486 23,934 1,961 175,646
Goodwill 6,931
Total assets 182,577
Total liabilities 67,827 17,488 14,314 39,829 2,131 22,503 164,092
Capital expenditure 12 7 4 12 3 56 94
Depreciation 22 12 2 15 6 56 113
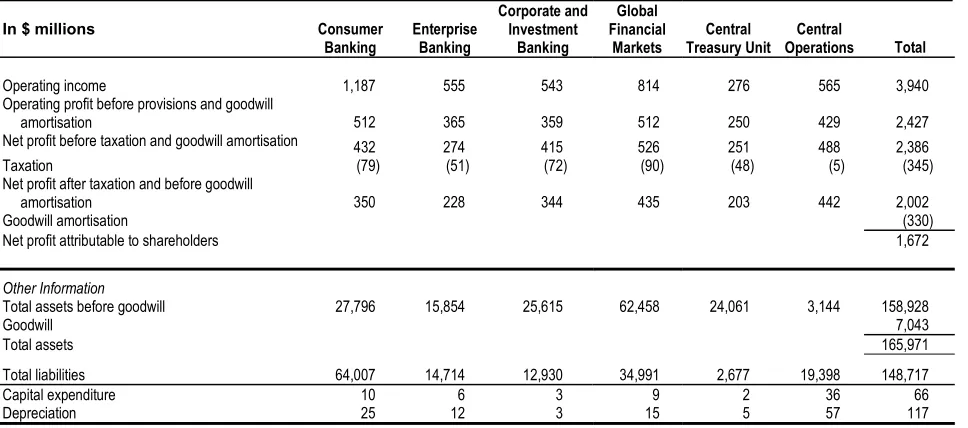
Group Business Segments (9 Mths 2004)
In $ millions Consumer
Banking
Enterprise Banking
Corporate and Investment
Banking
Global Financial
Markets
Central Treasury Unit
Central
Operations Total
Operating income 1,187 555 543 814 276 565 3,940
Operating profit before provisions and goodwill
amortisation 512 365 359 512 250 429 2,427
Net profit before taxation and goodwill amortisation 432 274 415 526 251 488 2,386
Taxation (79) (51) (72) (90) (48) (5) (345)
Net profit after taxation and before goodwill
amortisation 350 228 344 435 203 442 2,002
Goodwill amortisation (330)
Net profit attributable to shareholders 1,672
Other Information
Total assets before goodwill 27,796 15,854 25,615 62,458 24,061 3,144 158,928
Goodwill 7,043
Total assets 165,971
Total liabilities 64,007 14,714 12,930 34,991 2,677 19,398 148,717
Capital expenditure 10 6 3 9 2 36 66
Geographical Segment Analysis
[image:18.612.58.540.152.395.2]The following table analyses total assets, operating income and net profit by geographical segments. Unless otherwise stated, the analysis of geographical segments is generally based on the location of the office recording the transactions. The total assets, operating income and net profit are stated after elimination of inter-group assets and revenues.
Table 14
Group Geographical Segments
In $ millions
Total
assets Distribution (%)
Year-to-date Operating
income Distribution
(%)
Year-to-date Net profit
Distribution (%) Sep 30, 2005
Singapore 116,894 67 2,069 64 867 67
Hong Kong 42,408 24 929 29 364 28
Rest of Greater China 5,247 3 62 2 (4) (0)
South and Southeast Asia 3,773 2 108 3 84 6
Rest of the World 7,324 4 81 2 (12) (1)
Sub-total 175,646 100 3,249 100 1,299 100
Goodwill 6,931 -
-Total 182,577 3,249 1,299
Sep 30, 2004
Singapore 106,590 67 2,632 67 1,409 1/ 70
Hong Kong 40,286 25 1,053 27 457 23
Rest of Greater China 4,134 3 51 1 17 1
South and Southeast Asia2/
2,249 1 141 3 94 5
Rest of the World 5,669 4 63 2 25 1
Sub-total 158,928 100 3,940 100 2,002 100
Goodwill 7,043 - (330)
Total 165,971 3,940 1,672
Notes:
1/ Includes one-time gains of $497 million.
2/ Year-to-date operating income and net profit include contributions from DTDB, which was deconsolidated on June 25, 2004.
DBSH Group operates in five main geographical areas :
· “Singapore”,which includes operations generated in Singapore.
· “Hong Kong”, which includes branch and subsidiary operations in Hong Kong. · “Rest of Greater China”, which includes branch operations in China and Taiwan.
· “South and Southeast Asia”, which includes branch and subsidiary operations in India, Indonesia, Malaysia, Thailand and the Philippines.
· “Rest of the World”, which are mainly branch operations in South Korea, Japan, United States and United Kingdom.
Comparatives
DBS GROUP HOLDINGS LTD AND ITS SUBSIDIARY COMPANIES
Unaudited Consolidated Profit and Loss Account
1/In $ millions
3rd Qtr 2005
3rd Qtr 2004
+/(-) %
2nd Qtr 2005
9 Mths 2005
9 Mths 2004
+/(-) %
Interest income 1,491 993 50 1,318 3,987 2,959 35
Less: Interest expense 763 341 124 623 1,894 1,008 88
Net interest income 728 652 12 695 2,093 1,951 7
Fee and commission income 266 252 6 290 810 777 4
Dividend income 16 22 (27) 29 50 63 (21)
Rental income 10 9 11 7 25 25
-Other income 59 163 (64) 71 271 1,124 (76)
Operating income 1,079 1,098 (2) 1,092 3,249 3,940 (18)
Less: Staff costs 255 247 3 253 773 736 5
Depreciation 36 35 3 39 113 117 (3)
Other operating expenses 238 221 8 208 654 660 (1)
Goodwill amortisation - 110 NM - - 330 NM
Operating expenses 529 613 (14) 500 1,540 1,843 (16)
Operating profit before provisions 550 485 13 592 1,709 2,097 (19)
Less: Provision for loan losses and diminution in value of
other assets 4 28 (86) 81 148 93 59
Operating profit 546 457 19 511 1,561 2,004 (22)
Add: Share of profits less losses of associated companies 17 18 (6) 22 51 52 (2)
Net profit before taxation 563 475 19 533 1,612 2,056 (22)
Less: Taxation 97 109 (11) 74 259 332 (22)
Share of taxation of associated companies 4 4 - 5 12 13 (8)
Net profit after taxation 462 362 28 454 1,341 1,711 (22)
Attributable to:
Shareholders 446 349 28 441 1,299 1,672 (22)
Minority interest 16 13 23 13 42 39 8
462 362 28 454 1,341 1,711 (22)
NM: Not meaningful Note:
DBS GROUP HOLDINGS LTD AND ITS SUBSIDIARY COMPANIES
Unaudited Consolidated Balance Sheet as at
1/Sep 30 Jun 30 Dec 31 Sep 30 In $ millions 2005 2005 2004 2004
Equity Attributable to Equity Holders of the Parent
Share capital 1,563 1,561 1,559 1,559 Share premium account 2,256 2,228 2,208 2,201 Treasury shares (117) (117) (126) (126) Non-distributable reserves 6,875 6,868 6,628 6,548 Revenue reserve 6,759 6,500 6,153 5,935
17,336 17,040 16,422 16,117
Minority Interests 1,149 1,132 1,128 1,137
TOTAL EQUITY 18,485 18,172 17,550 17,254
LIABILITIES
Deposits and balances of
banks 9,995 12,053 10,939 10,453 Deposits and other accounts
of non-bank customers 114,918 115,933 113,206 107,008 Bills payable 358 491 350 389 Current taxation 641 641 631 661 Deferred tax liabilities 60 56 62 71 Other liabilities 22,914 21,273 18,712 17,851 Other borrowings and debt
securities in issue 2/ 8,308 8,054 7,624 7,011
- due within one year 2,868 3,128 3,145 2,552 - due after one year 5,440 4,926 4,479 4,459 Subordinated term debts due
after one year (unsecured) 6,898 7,001 6,364 5,273
TOTAL EQUITY AND
LIABILITIES 182,577 183,674 175,438 165,971
OFF BALANCE SHEET ITEMS
Contingent liabilities 8,450 8,552 8,529 7,960 Commitments 80,210 79,387 70,774 70,182 Financial derivatives 1,561,972 1,576,375 1,518,507 1,664,247
Notes:
1/ Figures for prior periods have been restated to reflect the change in accounting policies (Appendix VI, note 4).
2/ Includes secured amount of $1,992 million as at September 30, 2005 (June 30, 2005: $1,927 million; December 31, 2004: $1,814 million; September 30, 2004: $1,549 million). These are mainly secured by properties and securities.
Sep 30 Jun 30 Dec 31 Sep 30 In $ millions 2005 2005 2004 2004
ASSETS
Cash, and balances and placements with central
banks 5,881 10,080 10,479 5,699 Singapore Government
securities and treasury
bills 11,431 11,626 11,194 13,431 Trading securities 16,831 16,788 11,695 10,980 Balances, placements with,
and loans and advances
to banks 19,748 17,529 25,169 23,176 Bills receivable from
non-bank customers 2,960 3,042 2,333 2,325 Loans and advances to
non-bank customers 75,816 75,670 67,326 64,891 Investment securities 25,849 25,370 24,208 23,985 Associated companies 517 520 491 521 Goodwill 6,931 6,931 6,931 7,043 Fixed assets 1,812 1,786 1,798 1,832 Deferred tax assets 63 70 103 128 Other assets 14,738 14,262 13,711 11,960
DBS GROUP HOLDINGS LTD AND ITS SUBSIDIARY COMPANIES
Unaudited Balance Sheet of DBS Group Holdings Ltd as at
1/Sep 30 Jun 30 Dec 31 Sep 30 In $ millions 2005 2005 2004 2004
EQUITY
Share capital 1,563 1,561 1,559 1,559 Share premium account 2,256 2,228 2,208 2,201 Capital redemption reserve 28 28 28 28 Share option plan reserve 45 41 35 28 Revenue reserve 2,920 2,919 3,000 3,000
TOTAL EQUITY 6,812 6,777 6,830 6,816
LIABILITIES
Current liabilities 6 6 5 8 Deferred tax liabilities # # # #
TOTAL EQUITY AND
LIABILITIES 6,818 6,783 6,835 6,824
Other Information
Net asset value per ordinary share ($)
4.50 4.49 4.50 4.50 (i) Based on existing
ordinary share capital (ii) Assuming non-voting
convertible preference shares (“CPS”) and non-voting redeemable CPS are converted to ordinary shares
4.36 4.34 4.36 4.35
Notes:
1/ Figures for prior periods have been restated to reflect the change in accounting policies (Appendix VI, note 4). 2/ #: Insignificant
Sep 30 Jun 30 Dec 31 Sep 30 In $ millions 2005 2005 2004 2004
ASSETS
Balances, placements with, and loans and advances
to non-bank customers - 3 3 3 Subsidiary companies 6,818 6,780 6,832 6,821
DBS GROUP HOLDINGS LTD AND ITS SUBSIDIARY COMPANIES
Unaudited Consolidated Statement of Changes in Shareholders' Equity
1/Attributable to Shareholders
In $ millions
Share Capital
Share Premium
Treasury Shares
Non-distributable Reserves
Revenue Reserve
Minority Interests
Total Equity
Balance at January 1, 2005 1,559 2,208 - 6,585 6,150 1,128 17,630
Adjustment due to change in accounting policies (126) 43 3 (80)
Balance at January 1, 2005 (restated) 1,559 2,208 (126) 6,628 6,153 1,128 17,550
On adoption of FRS 39 at January 1, 2005 292 (100) 192
Exercise of share options pursuant to the DBSH Share
Option Plan 4 46 50
Net exchange translation adjustments during the period (4) (4)
Share of associated companies’ Capital Reserves 1 1
Cost of share-based payments 2 9 20 31
Net unrealised loss on financial instruments (62) (62)
Final and interim dividends paid on ordinary and
preference shares (593) (593)
Dividends paid to minority interests (26) (26)
Change in minority interests 5 5
Net profit after taxation 1,299 42 1,341 Balance at September 30, 2005 1,563 2,256 (117) 6,875 6,759 1,149 18,485
Balance at January 1, 2004 1,556 2,171 - 6,499 4,670 1,125 16,021 Adjustment due to change in accounting policies (138) 11 34 (93) Balance at January 1, 2004 (restated) 1,556 2,171 (138) 6,510 4,704 1,125 15,928
Exercise of share options pursuant to the DBSH Share
Option Plan 3 30 33
Net exchange translation adjustments during the period (3) (3) Cost of share-based payments 12 23 35 Goodwill transferred on disposal of subsidiary company 18 (18) -Final and interim dividends paid on ordinary and
preference shares (423) (423)
Dividends paid to minority interests (27) (27) Net profit after taxation 1,672 39 1,711
Balance at September 30, 2004 1,559 2,201 (126) 6,548 5,935 1,137 17,254
Note:
DBS GROUP HOLDINGS LTD AND ITS SUBSIDIARY COMPANIES
Unaudited Statement of Changes in Shareholders' Equity of DBS Group Holdings Ltd
1/In $ millions
Share Capital
Share Premium
Capital Redemption Reserve
Share Option Plan Reserve
Revenue
Reserve Total Equity
Balance at January 1, 2005 1,559 2,208 28 - 3,000 6,795
Adjustment due to change in accounting policies 35 35
Balance at January 1, 2005 (restated) 1,559 2,208 28 35 3,000 6,830
Exercise of share options pursuant to the DBSH Share
Option Plan 4 46 50
Cost of share-based payments 2 10 12
Final and interim dividends paid on ordinary and preference
shares (593) (593)
Net profit after taxation 513 513
Balance at September 30, 2005 1,563 2,256 28 45 2,920 6,812
Balance at January 1, 2004 1,556 2,171 28 - 3,001 6,756 Adjustment due to change in accounting policies 9 9 Balance at January 1, 2004 (restated) 1,556 2,171 28 9 3,001 6,765 Exercise of share options pursuant to the DBSH Share
Option Plan 3 30 33
Cost of share-based payments 19 19
Final and interim dividends paid on ordinary and preference
shares (423) (423)
Net profit after taxation 422 422
Balance at September 30, 2004 1,559 2,201 28 28 3,000 6,816
Note:
DBS GROUP HOLDINGS LTD AND ITS SUBSIDIARY COMPANIES
Unaudited Consolidated Cash Flow Statement
1/In $ millions
9 Mths 2005
9 Mths 2004
Cash flows from operating activities
Net profit before taxation 1,612 2,056
Adjustments for non-cash items:
Provision for loan losses and diminution in value of other assets 148 93
Depreciation of fixed assets 113 117
Goodwill amortisation - 330
Share of profits of associated companies (51) (52)
Net gain on disposal of fixed assets (8) (4)
Net gain on disposal of investment securities (92) (619) Operating profit before changes in operating assets & liabilities 1,722 1,921
Increase/(Decrease) in:
Deposits and other accounts of non-bank customers 1,712 2,401
Deposits and balances of banks (944) 3,104
Other liabilities including bills payable 4,206 2,251
(Increase)/Decrease in:
Singapore Government securities and treasury bills (237) (1,993)
Trading securities (5,136) (4,547)
Accounts receivable and other assets (805) 168 Balances, placements with, and loans and advances to other banks 5,421 4,177 Loans and advances to non-bank customers including bills receivable (9,297) (6,214)
Tax paid (266) (171)
Net cash used in/ generated from operating activities (1) (3,624) 1,097
Cash flows from investing activities
Dividends from associated companies 30 21
Purchase of fixed assets (94) (66)
Net increase in investment securities (1,577) (1,158)
Proceeds from sale of subsidiary - (69)
Proceeds from disposal of fixed assets 25 37
Net cash used in investing activities (2) (1,616) (1,235)
Cash flows from financing activities
Increase in share capital and share premium 52 33 Net increase in debt securities and borrowings 1,218 1,232 Dividends paid to shareholders of DBSH (593) (423) Dividends paid to minority interests (26) (27)
Net cash generated from financing activities (3) 651 815
Exchange translation adjustments (4) (9) 15
Net change in cash, and balances and placements with central banks (1)+(2)+(3)+(4) (4,598) 692
Cash, and balances and placements with central banks as at January 1 10,479 5,007
Cash, and balances and placements with central banks as at September 30 5,881 5,699
Note:
DBS GROUP HOLDINGS LTD AND ITS SUBSIDIARY COMPANIES
Selected Notes to the Accounts
1. Issuance of Ordinary Shares
Details of issue of new ordinary shares of $1.00 each are as follows:
Particulars
Number of new ordinary shares issued between
July 1, 2005 and September 30, 2005
Number of new ordinary shares that would have been issued upon the conversion/exercise of all outstanding non-voting convertible preference
shares (“CPS”)/non-voting redeemable CPS/executive share options
Sep 30, 2005 Jun 30, 2005 Sep 30, 2004
Conversion of non-voting CPS - 120,436 120,436 120,436
Conversion of non-voting redeemable CPS - 66,475,374 66,475,374 66,475,374
Exercise of executive share options 2,382,529 41,692,146 46,156,505 48,215,063
2. Non-Performing Loans and Provisions
At September 30, 2005, DBSH Group’s total non-performing loans (“NPLs”) amounted to $1.807 billion. Out of the total NPLs, $0.957 billion or 53% were secured by collateral.
Details of DBSH Group’s NPLs and provisions at September 30, 2005 are as follows:
In $ millions Singapore
Hong Kong
South and Southeast
Asia
Rest of Greater China
Rest Of the World Total
Non-Performing Loans 998 426 177 65 141 1,807
- Substandard 645 313 103 35 141 1,237
- Doubtful 175 60 7 4 - 246
- Loss 178 53 67 26 - 324
NPLs as a % of Group total assets 0.5% 0.2% 0.1% 0.0% 0.1% 1.0%
Non-bank NPLs as a % of non-bank loans in the
respective countries 1/ 2.1% 1.6% 3.6% 2.5% 2.5% 2.0%
Total Cumulative Provisions 933 435 161 68 160 1,757
- Specific provisions 407 148 82 39 50 726
- General provisions 526 287 79 29 110 1,031
Total Cumulative Provisions as a % of:
- Group total assets 0.5% 0.2% 0.1% 0.0% 0.1% 1.0%
- NPLs in the respective countries 94% 102% 91% 106% 112% 97%
DBS GROUP HOLDINGS LTD AND ITS SUBSIDIARY COMPANIES
2. Non-Performing Loans and Provisions (Continued)
Details of DBSH Group’s NPLs and provisions at June 30, 2005 are as follows:
In $ millions Singapore
Hong Kong
South and Southeast
Asia
Rest of Greater China
Rest Of the World Total
Non-Performing Loans 1,013 473 207 61 142 1,896
- Substandard 697 359 104 35 142 1,337
- Doubtful 131 58 24 3 - 216
- Loss 185 56 79 23 - 343
NPLs as a % of Group total assets 0.5% 0.3% 0.1% 0.0% 0.1% 1.0%
Non-bank NPLs as a % of non-bank loans in the
respective countries 1/ 2.1% 1.8% 4.6% 2.8% 2.7% 2.2%
Total Cumulative Provisions 967 436 163 64 154 1,784
- Specific provisions 389 146 100 36 45 716
- General provisions 578 290 63 28 109 1,068
Total Cumulative Provisions as a % of:
- Group total assets 0.5% 0.2% 0.1% 0.0% 0.1% 1.0%
- NPLs in the respective countries 95% 92% 79% 105% 109% 94%
- Unsecured NPLs in the respective countries 218% 236% 134% 119% 190% 201%
Details of DBSH Group’s NPLs and provisions at December 31, 2004 are as follows:
In $ millions Singapore
Hong Kong
South and Southeast
Asia
Rest of Greater China
Rest Of the World Total
Non-Performing Loans 958 471 218 73 199 1,919
- Substandard 674 341 107 39 199 1,360
- Doubtful 80 51 23 15 - 169
- Loss 204 79 88 19 - 390
NPLs as a % of Group total assets 0.5% 0.3% 0.1% 0.0% 0.1% 1.1%
Non-bank NPLs as a % of non-bank loans in the
respective countries 1/ 2.2% 2.0% 6.3% 5.0% 4.6% 2.5%
Total Cumulative Provisions 905 443 150 67 136 1,701
- Specific provisions 359 159 97 44 28 686
- General provisions 546 284 53 23 108 1,015
Total Cumulative Provisions as a % of:
- Group total assets 0.5% 0.3% 0.1% 0.0% 0.1% 1.0%
- NPLs in the respective countries 94% 94% 69% 91% 69% 89%
- Unsecured NPLs in the respective countries 221% 257% 125% 99% 95% 186%
Note:
DBS GROUP HOLDINGS LTD AND ITS SUBSIDIARY COMPANIES
2. Non-Performing Loans and Provisions (Continued)
Details of DBSH Group’s NPLs and provisions at September 30, 2004 are as follows:
In $ millions Singapore
Hong Kong
South and Southeast
Asia
Rest of Greater China
Rest Of the World Total
Non-Performing Loans 935 516 233 75 175 1,934
- Substandard 645 370 119 41 175 1,350
- Doubtful 99 47 25 14 - 185
- Loss 191 99 89 20 - 399
NPLs as a % of Group total assets 0.6% 0.3% 0.1% 0.0% 0.1% 1.2%
Non-bank NPLs as a % of non-bank loans in the
respective countries 1/ 2.2% 2.2% 7.1% 5.0% 5.3% 2.6%
Total Cumulative Provisions 765 420 262 105 200 1,752
- Specific provisions 369 178 103 43 22 715
- General provisions 396 242 159 62 178 1,037
Total Cumulative Provisions as a % of:
- Group total assets 0.5% 0.3% 0.2% 0.1% 0.1% 1.1%
- NPLs in the respective countries 82% 81% 112% 140% 115% 91%
- Unsecured NPLs in the respective countries 194% 217% 205% 153% 115% 183%
Note:
DBS GROUP HOLDINGS LTD AND ITS SUBSIDIARY COMPANIES
2. Non-Performing Loans and Provisions (Continued)
Analysis of Non-Performing Loans by Industry
The following table shows the industry breakdown of the non-performing loans of DBSH Group:
September 30, 2005 June 30, 2005 December 31, 2004 September 30, 2004
In $ millions NPLs
Specific
Provisions NPLs
Specific
Provisions NPLs
Specific
Provisions NPLs
Specific Provisions
Customer loans
Manufacturing 380 207 449 190 365 175 409 180 Building and Construction 152 38 161 38 237 58 239 60
Housing Loans 245 63 248 65 253 67 266 73
General Commerce 277 122 245 110 186 75 187 79 Transportation, Storage and
Communications 23 6 33 11 27 10 31 9
Financial Institutions, Investment and
Holding Companies 192 50 189 53 201 58 122 46 Professionals and Private Individuals
(except Housing Loans) 220 98 237 111 239 105 227 103
Others 154 68 173 69 255 78 282 88
Sub-total 1,643 652 1,735 647 1,763 626 1,763 638
Debt securities 136 58 127 51 138 52 145 65
Contingent items 28 16 34 18 18 8 26 12
Total 1,807 726 1,896 716 1,919 686 1,934 715
Analysis of Non-Performing Loans by Period Overdue
In $ millions September 30, 2005 June 30, 2005 December 31, 2004 September 30, 2004
Non-default 665 675 744 646
Default loans 1,142 1,221 1,175 1,288
Less than 3 months 310 411 339 288
3 to 6 months 270 169 157 242
Over 6 months 562 641 679 758
DBS GROUP HOLDINGS LTD AND ITS SUBSIDIARY COMPANIES
3. Value at Risk and Trading Income
The Group uses a Value at Risk (“VaR”) measure as one mechanism for controlling trading risk. The VaR is calculated using a one-day time horizon and a 99% confidence interval. The following table shows the period-end, average, high and low VaR for the trading risk exposure of the DBSH Group for the period from October 1, 2004 to September 30, 2005.
October 1, 2004 to September 30, 2005
In $ millions As at September 30, 2005 Average High 1/ Low 1/
Interest rate 24.0 26.9 33.2 20.7
FX 5.0 6.6 15.6 2.7
Equity 5.3 6.9 28.0 3.1
Diversification effect (12.3) (15.4) -
-Total 22.0 25.0 35.5 19.6
Note:
1/ The high (& low) VaR figures reported for each risk class did not necessarily occur on the same day as the high (& low) reported for total. A corresponding diversification effect cannot be calculated and is therefore omitted from the table.
The charts below provide the range of VaR and the daily distribution of trading income in the trading portfolio for the period from October 1, 2004 to September 30, 2005.
G r o u p V a R f o r T r a d in g B o o k
0 5 1 0 1 5 2 0 2 5 3 0 3 5 4 0 4 5 5 0
>18-19 >19-20 >20-21 >21-22 >22-23 >23-24 >24-25 >25-26 >26-27 >27-28 >28-29 >29-30 >30-31 >31-32 >32-33 >33-34 >34-35 >35-36 >36-37 >37-38 >38-39 >39-40
V a R ( $ m illio n s )
No.
of Days
D a i l y D i s t r i b u t i o n o f G r o u p T r a d i n g I n c o m e
2 5 3 0 3 5 4 0 4 5 5 0
f D
a
y
DBS GROUP HOLDINGS LTD AND ITS SUBSIDIARY COMPANIES
4.
Change in Accounting Policies
a. In second quarter 2005, DBSH Group changed its accounting policy for investments in joint venture companies.
These investments are accounted for by proportionate consolidation, whereby the Group’s share of joint venture companies’ income and expenses, assets and liabilities are included in the consolidated financial statements on a line-by-line basis. The change better reflects the substance and economic reality of the Group’s interests in joint venture companies. Prior to the change, the equity method of accounting was adopted. The accounting policy change has been applied retrospectively, and the comparable financial results have been restated to conform to the new policy.
b. In addition, the Council on Corporate Disclosure and Governance (“CCDG”) adopted several new and revised
Financial Reporting Standards (“FRS”), which are effective January 1, 2005 for DBSH Group, including:
· FRS 39 Financial Instruments: Recognition and Measurement (revised)
· FRS 102 Share-based Payment
· FRS 103 Business Combinations
· Interpretation of FRS (“INT FRS”) 12 Consolidation – Special Purpose Entities (revised)
· FRS 1 Presentation of Financial Statements (revised)
Except for the prospective application of FRS 39 and FRS 103, the other accounting standard changes are applied retrospectively, with the comparative financial results restated to conform to the new accounting standards.
Financial Reporting Standards (“FRS”) 39, Financial Instruments: Recognition and Measurement
The implementation of FRS 39 had a significant impact on certain financial assets and liabilities. An opening adjustment was made, representing unrealised gains or losses on certain financial assets and financial liabilities including derivatives to be measured at fair value on January 1, 2005. The differences between carrying amount and fair value were adjusted to revaluation and revenue reserves. FRS 39 is applied prospectively, and the comparative figures for 2004 are not restated as prescribed by the Standard.
FRS 102, Share-based Payment
FRS 102 requires an expense to be recognised where DBSH Group pays for goods or services using shares or other equity instruments (equity-settled transactions), or using other assets equivalent in value to a given number of shares or other equity instruments (cash-settled transactions).
DBSH Group is required to expense off share options and shares awarded to staff and directors under its share-based incentive plans (namely DBSH Share Option Plan; DBSH Performance Share Plan; DBSH Employee Share Plan) with a corresponding increase in equity.
FRS 103, Business Combinations
The effect of the adoption of FRS 103 is that upon acquisition of subsidiaries or business undertakings, DBSH Group will include items like intangible assets and contingent liabilities as part of the identifiable assets and liabilities acquired, at their fair values as at the acquisition date.
Additionally, the adoption of FRS 103 requires DBSH Group to cease goodwill amortisation to the profit and loss account. Goodwill should also be reviewed for impairment annually (unless an event occurs during the year which requires the goodwill to be tested more frequently) in accordance with FRS 36, “Impairment of Assets” (revised in 2004), from January 1, 2005 onwards.
Interpretation of FRS (“INT FRS”) 12, Consolidation – Special Purpose Entities
· The revised INT FRS 12 has been amended to mandate the consolidation of employee benefit trusts set up for
DBS GROUP HOLDINGS LTD AND ITS SUBSIDIARY COMPANIES
FRS 1, Presentation of Financial Statements
The revised FRS 1 requires disclosure on the face of the income statement of the following:
· the profit or loss for the period, and
· the allocation of this amount between that attributable to minority interest and that attributable to Shareholders.
A similar requirement has been added for the statement of changes in equity. FRS 1 also requires disclosure, on the face of the statement of changes in equity, of total income and expenses for the period, showing separately the amounts attributable to Shareholders and to minority interest.
DBS GROUP HOLDINGS LTD AND ITS SUBSIDIARY COMPANIES
Hong Kong Country Results
For third quarter 2005, net profit after taxation for Hong Kong operations on a Singapore GAAP basis declined 14% from third quarter 2004 to $125 million mainly due to lower operating income, higher operating expenses, partly offset by lower provision charges. Compared to second quarter 2005, net profit after taxation increased 6% mainly due to higher operating income, partly offset by higher operating expenses.
· Net interest income was up 10% from third quarter 2004 mainly due to an increase in customer loans, partly offset by narrower spread between the HKD Prime rate and HIBOR 1/. Compared to second quarter 2005, net interest income was up 12% mainly due to increase in customer loans and wider spread between the HKD Prime rate and HIBOR.
· Non-interest income declined by 34% from third quarter 2004. This is mainly due marked-to-market losses on derivatives which do not qualify as hedges under FRS39 and a decline in income from sales of treasury investment products. Compared to second quarter 2005, non-interest income was comparable.
· Operating expenses were 10% higher compared to third quarter 2004 and 8% higher compared to second quarter mainly due to higher wage costs and higher revenue-related expenses.
· Provision charge decreased 68% from third quarter 2004 reflecting the stronger economic environment and property market.
Profit and Loss Account (Based on Singapore Generally Accepted Accounting Principles)
In $ millions
3rd Qtr 2005
3rd Qtr 2004
+/(-) %
2nd Qtr 2005
9 Mths 2005
9 Mths 2004
+/(-) %
Net interest income 247 224 10 220 673 688 (2)
Non-interest income 78 118 (34) 80 256 365 (30)
Operating income 325 342 (5) 300 929 1,053 (12)
Operating expenses (168) (153) 10 (156) (476) (445) 7
Operating profit before provisions 157 189 (17) 144 453 608 (25)
Provisions (7) (22) (68) (4) (20) (80) (75)
Operating profit 150 167 (10) 140 433 528 (18)
Net profit before taxation 150 167 (10) 140 433 528 (18)
Net profit after taxation 125 146 (14) 118 364 457 (20)
Note: