Contents
Page
Financial Highlights 2
Financial Review 3
Net Interest Income and Net Interest Margin 5
Non-Interest Income 6
Operating Expenses 7
Goodwill Amortisation 7
Provision Charge 8
Asset Quality 8
Balance Sheet 9
Customer Deposits 10
Customer Loans 10
Capital Adequacy Ratio 11
Unrealised Valuation Surpluses 11
Geographical Segment Analysis 12
Business Segment Analysis 13
Comparatives 14
APPENDIX I: Unaudited Consolidated Profit And Loss Account APPENDIX II: Unaudited Consolidated Balance Sheet
APPENDIX III: Unaudited Consolidated Cash Flow Statement
APPENDIX IV: Unaudited Statements of Changes in Shareholders’ Equity APPENDIX V: Selected Notes to the Accounts
1. Earnings Per Ordinary Share
2. Loan And Investment Exposures To Malaysia, Indonesia, Thailand, Korea, The Philippines (Regional Countries), Hong Kong And China
3. Non-Performing Loans And Provisions 4. Financial Derivatives
Financial Highlights
DBS Group Holdings (“DBSH”) prepares its consolidated DBSH Group (“Group”) financial statements in accordance with Financial Reporting Standards (“FRS”).
9 Mths 2003
9 Mths 2002
3rd Qtr 2003
2nd Qtr 2003
3rd Qtr 2002 S$'m S$'m S$'m S$'m S$'m For the period
Income before operating expenses 3,145 3,092 1,113 984 1,028 Operating profit before goodwill amortisation and
provisions 1,786 1,714 655 525 576
Operating profit before provisions 1,466 1,508 548 418 507
Net profit before taxation 1,040 1,157 405 241 356
Net profit attributable to members 733 766 291 171 226 Net profit attributable to members (excluding
goodwill amortisation) 1,053 972 398 278 295
At period-end
Shareholders' funds 14,875 14,196 14,875 14,767 14,196 Interest bearing assets 135,268 129,086 135,268 134,165 129,086 Customer loans 1/ 63,902 63,442 63,902 62,714 63,442 Customer deposits 107,056 100,419 107,056 105,514 100,419
Total assets 160,231 148,315 160,231 158,502 148,315
Per share S$ S$ S$ S$ S$
Basic earnings excluding goodwill amortisation 2/ 0.94 0.87 1.07 0.74 0.79
Basic earnings 2/ 0.65 0.69 0.78 0.45 0.60
Diluted earnings 2/ 0.63 0.66 0.75 0.44 0.58
Net asset value at period-end 9.74 9.27 9.74 9.66 9.27 Net tangible asset value at period-end 3/ 4.64 5.82 4.64 4.56 5.82
Performance ratios
9 Mths 2003
9 Mths 2002
3rd Qtr 2003
2nd Qtr 2003
3rd Qtr 2002 (%) (%) (%) (%) (%) On a GAAP basis
Return on assets 2/ 0.63 0.68 0.73 0.43 0.60
Return on equity 2/ 6.65 7.34 7.86 4.61 6.35
Excluding goodwill amortisation
Return on assets 2/ 0.91 0.86 1.00 0.70 0.78
Return on equity 2/ 9.56 9.31 10.74 7.48 8.30
Return on tangible equity 2/ 4/ 19.79 14.78 21.70 15.30 12.98
Efficiency and revenue mix ratios
Cost-to-income ratio (excluding goodwill
amortisation) 43.2 44.6 41.2 46.6 44.0
As a percentage of total operating income:
- net interest income 55.5 64.8 52.8 56.9 65.2
- non-interest income 44.5 35.2 47.2 43.1 34.8
BIS Capital ratios (at period-end)
- Tier 1 capital 10.5 13.7 10.5 9.7 13.7
- Total capital 15.2 19.0 15.2 14.2 19.0
Notes:
1/ After deducting cumulative provisions.
2/ Earnings per share, return on assets, return on equity and return on tangible equity for the periods are computed on an annualised basis. 3/ Computed based on total ordinary shareholders’ funds after deduction of goodwill divided by total number of ordinary shares as at each
period-end.
Change in Accounting Policy
The Monetary Authority of Singapore revised MAS 605 during the third quarter of 2003, allowing for the measurement of trading book positions at fair value. Following the revision, DBSH Group revised its classification guidelines to provide a clear classification and measurement of its trading and investment securities. Please see Appendix V, paragraph 6 for an analysis of the impact to the Group results.
With the revision, all trading securities are now measured at market value. The accounting policy change has been applied retroactively, and the comparable financial results for the Group have been restated to conform to the new accounting policy.
Financial Review
DBSH Group’s operating profit before goodwill amortisation and provisions in the first 9 months of 2003 (“9 Months 2003”) was S$1.786 billion, an increase of 4.2% over the same period in 2002. The improved year-on-year performance was principally due to an increase in non-interest income. After goodwill amortisation of S$320 million and provision charge of S$459 million, net profit attributable to members declined by 4.3% to S$733 million. Cost-to-income ratio (excluding goodwill amortisation) improved to 43.2% compared to 44.6% for the same period last year.
Compared to second quarter 2003 (“2nd Qtr 2003”), operating profit before goodwill amortisation and provisions increased by 24.8% mainly due to higher income earned in third quarter 2003 (“3rd Qtr 2003”). After taking into account provision charge of S$154 million, net profit attributable to members showed a significant increase of 70.2%. Cost-to-income ratio (excluding goodwill amortisation) improved to 41.2% in 3rd Qtr 2003 from 46.6% in 2nd Qtr 2003.
Without the accounting policy change, NPAM for 9 Months 2003 would have been S$742 million, or a 1% increase over the S$735 million NPAM for 9 Months 2002 as previously reported.
Profit and Loss Account
9 Mths 2003
9 Mths 2002
3rd Qtr 2003
2nd Qtr 2003
3rd Qtr 2002 S$'m S$'m S$'m S$'m S$'m
Net interest income 1,747 2,003 588 560 670
Non-interest income 1,398 1,089 525 424 358
Income before operating expenses 3,145 3,092 1,113 984 1,028
Operating expenses (1,359) (1,378) (458) (459) (452)
Operating profit before goodwill amortisation and
provisions 1,786 1,714 655 525 576
Goodwill amortisation (320) (206) (107) (107) (69)
Operating profit before provisions 1,466 1,508 548 418 507
Provisions (459) (389) (154) (187) (162)
Operating profit 1,007 1,119 394 231 345 Share of profits less losses of associated and joint venture
companies 33 38 11 10 11
Net profit before taxation 1,040 1,157 405 241 356
Taxation (264) (285) (99) (55) (98)
Minority interests (43) (106) (15) (15) (32)
Net profit attributable to members (“NPAM”) 733 766 291 171 226
DBS Bank (Hong Kong) Limited
The following table reflects the performance of DBS’ wholly-owned Hong Kong subsidiary, DBS Bank (Hong Kong) Limited under Hong Kong Generally Accepted Accounting Principles. The effective acquisition of 71.6% of Dao Heng Bank Group Limited (“DHG”) through DBS Diamond Holdings Limited (“DDH”), a subsidiary of DBS Bank Ltd, was completed on June 29, 2001. DBS Bank Ltd exercised its call option to acquire the remaining 28.4% of the DDH shares on January 10, 2003 following which DHG became a wholly-owned subsidiary of DBS Bank Ltd. Pursuant to the Hong Kong legislative and regulatory requirements, the legal merger of Dao Heng Bank Limited, Overseas Trust Bank Limited and DBS Kwong On Bank Limited was completed on July 21, 2003. The merged entity was named DBS Bank (Hong Kong) Limited on the same date.
Operating profit for the 9 Months in 2003 showed a 14.5% year-on-year increase due to higher non-interest income and lower impairment losses on fixed assets. Non-non-interest income rose by 39.2% due to higher sale of treasury investment products and better trading income. This was partly offset by lower net interest income and higher provisions. Reduction in net interest income was attributable to sluggish loan demand. Provisions effectively increased 51% compared to a year ago due to a significant write-back in loan provisions in the first 9 months of 2002. Operating expenses declined by 2.7%, mainly through the streamlining of operations.
Compared to 2nd Qtr 2003, operating profit in 3rd Qtr 2003 was 50.5% higher due to higher non-interest income and lower provisions. Non-interest income increased by 33.7% due to higher sale of treasury investment products. Total provision charge was higher in 2nd Qtr 2003 due to loan-related provisions. Operating expenses in 3rd Qtr 2003 were lower as 2ndQtr 2003’s operating expenses included merger related expenses.
Profit and Loss Account
9 Mths 2003
9 Mths 2002
3rd Qtr 2003
2nd Qtr 2003
3rd Qtr 2002 S$'m S$'m S$'m S$'m S$'m
Net interest income 600 630 203 201 216
Non-interest income 284 204 115 86 74
Income before operating expenses 884 834 318 287 290
Operating expenses (359) (369) (120) (127) (124)
Impairment of fixed assets (5) (44) (3) (2)
-Operating profit before provisions 520 421 195 158 166
Provisions (157) (104) (52) (63) (43)
Operating profit 363 317 143 95 123
Net profit before taxation 362 322 142 96 121
Net profit after taxation 300 266 118 80 103
Notes:
1/ The exchange rate used for all comparative periods is based on HK$1 = S$0.2232.
2/ In the preparation of the consolidated accounts of DBSH Group, appropriate adjustments have been made to bring them in line with Financial Reporting Standards (“FRS”) in Singapore. Under FRS, the contribution from DBS Bank (Hong Kong) Limited was as follows:
9 Mths 2003
9 Mths 2002
3rd Qtr 2003
2nd Qtr 2003
3rd Qtr 2002
S$'m S$'m S$'m S$'m S$'m
Net profit before taxation 351 308 148 85 126
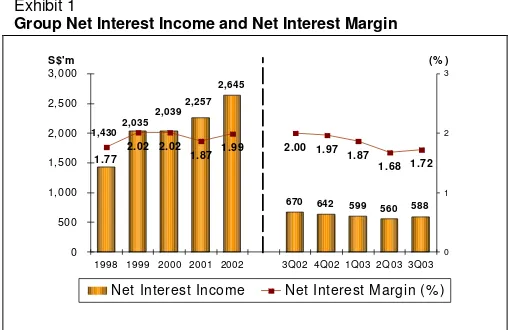
Exhibit 1
Group Net Interest Income and Net Interest Margin
2,645
642 599 560 588 670
1.87 1.99 2.00 1.97 1.87 1.68 1.72
1998 1999 2000 2001 2002 3Q02 4Q02 1Q03 2Q03 3Q03 S$'m
Net Interest Income Net Interest Margin (% )
Net Interest Income and Net Interest
Margin
Net interest income for 9 Months 2003 fell 12.8% to S$1.747 billion over the same period in 2002. The decrease was mainly due to the low interest rate environment and the narrower spreads on loans.
Net interest margin was 1.76% for 9 Months 2003 compared to 2.00% for 9 Months 2002.
Compared to the 2nd Qtr 2003, net interest income increased to S$588 million in the 3rd Qtr 2003, due to the improvement in net interest margin as well as higher volume of interest bearing assets.
Net interest margin was 1.72% for 3rd Qtr 2003. Although interest rates remained low, the Singapore dollar interbank rate was higher in the 3rd Qtr 2003 compared to 2nd Qtr 2003. Average interest yield on debt securities was also higher in the 3rd Qtr 2003.
Table 1
Group Net Interest Income and Net Interest Margin
9 Mths 2003 9 Mths 2002
S$’m
Customer loans and advances 62,176 1,767 3.80 65,049 2,213 4.54
Interbank items 39,475 310 1.05 46,301 599 1.73
Securities 1/
30,862 638 2.76 22,732 565 3.32
Total interest bearing assets 132,513 2,715 2.74 134,082 3,377 3.37
Total interest bearing liabilities 124,091 968 1.04 124,208 1,374 1.48
Net interest income/margin 1,747 1.76 2,003 2.00
3rd Qtr 2003 2nd Qtr 2003 3rd Qtr 2002
S$’m
Customer loans and advances 63,593 571 3.56 61,821 602 3.91 64,298 727 4.49 Interbank items 37,018 97 1.04 41,298 91 0.88 45,353 156 1.36 Securities 1/
34,761 243 2.77 30,570 199 2.61 22,970 208 3.60
Total interest bearing assets 135,372 911 2.67 133,689 892 2.68 132,621 1,091 3.26
Total interest bearing liabilities 127,244 323 1.01 125,026 332 1.06 122,697 421 1.36
Net interest income/margin 588 1.72 560 1.68 670 2.00
Notes:
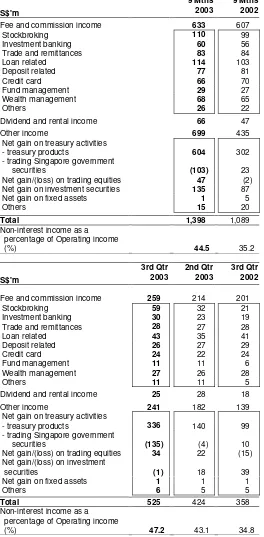
Table 2
Fee and commission income 633 607
Stockbroking 110 99
Investment banking 60 56
Trade and remittances 83 84
Loan related 114 103
Deposit related 77 81
Credit card 66 70
Fund management 29 27
Wealth management 68 65
Others 26 22
Dividend and rental income 66 47
Other income 699 435
Net gain on treasury activities
- treasury products 604 302
- trading Singapore government
securities (103) 23
Net gain/(loss) on trading equities 47 (2) Net gain on investment securities 135 87
Net gain on fixed assets 1 5
Others 15 20
Total 1,398 1,089
Non-interest income as a percentage of Operating income
(%) 44.5 35.2
Fee and commission income 259 214 201
Stockbroking 59 32 21
Investment banking 30 23 19
Trade and remittances 28 27 28
Loan related 43 35 41
Deposit related 26 27 29
Credit card 24 22 24
Fund management 11 11 6
Wealth management 27 26 28
Others 11 11 5
Dividend and rental income 25 28 18
Other income 241 182 139
Net gain on treasury activities
- treasury products 336 140 99
- trading Singapore government
securities (135) (4) 10
Net gain/(loss) on trading equities 34 22 (15) Net gain/(loss) on investment
securities (1) 18 39
Net gain on fixed assets 1 1 1
Others 6 5 5
Total 525 424 358
Non-interest income as a percentage of Operating income
(%) 47.2 43.1 34.8
Non-interest Income
Fee and commission income in 9 Months 2003 increased by 4.3% to S$633 million over the same period in 2002. The increase was contributed by higher stockbroking fees following a surge in trading volume in the equity market in the 3rd Qtr 2003 and higher loan related earnings from increased syndicated loan activities.
Compared to 2nd Qtr 2003, fee and commission income rose 21% to S$259 million in 3rd Qtr 2003. Most categories of fee and commission income continued to register increases reflecting stronger economic activity.
Other income for 9 Months 2003 increased significantly by 60.7% to S$699 million as compared to 9 Months 2002. For 3rd Qtr 2003, other income was S$59 million higher than 2nd Qtr 2003. The respective increases were due to higher gains from interest rate trading and customer-related derivatives business, as well as the sale of investment products.
The Group actively manages its portfolio of fixed income securities, including its holdings of Singapore government securities with the use of corresponding financial derivatives for dynamic hedging. During the third quarter, the Group recorded a S$135 million loss on trading Singapore government securities which however, was offset by gains from financial derivatives that were transacted to hedge the interest rate risks from the fixed income portfolio.
Table 3
Staff costs 648 685
Occupancy expenses 147 158
Technology-related expenses 212 162 Revenue-related expenses 148 118
Others 204 255
Total 1,359 1,378
Cost-to-income ratio (%) (excluding goodwill
amortisation) 43.2 44.6
Staff headcount number (at
period-end) 12,026 12,510
Staff costs 219 210 220
Occupancy expenses 48 51 54
Technology-related expenses 68 73 58 Revenue-related expenses 54 54 45
Others 69 71 75
Total 458 459 452
Cost-to-income ratio (%) (excluding goodwill
amortisation) 41.2 46.6 44.0
Staff headcount number (at
period-end) 12,026 11,948 12,510
Operating Expenses
Excluding goodwill amortisation, year-on-year (“YOY”) operating expenses declined by 1.4%.
Staff costs showed a 5.4% decrease of S$37 million largely due to staff reduction resulting from outsourcing certain technology-related functions in the Group and headcount reduction arising from rationalisation of workflow and businesses. The increase in technology-related expenses was mainly due to investments in new systems, enhancing capacity to meet customer demands and payment of outsourcing fees.
YOY, the Group’s cost-to-income ratio (excluding goodwill amortisation) was 43.2% for 9 Months 2003 compared to 44.6% for the same period in 2002.
Third quarter operating expenses (excluding goodwill amortisation) were virtually flat compared to 2nd Qtr 2003. The increase in staff costs was attributable to accrual of performance related bonuses, but this was offset by decline in other operating expenses.
Cost-to-income ratio (excluding goodwill amortisation) was 41.2% in 3rd Qtr 2003.
Goodwill Amortisation
On January 10, 2003, DBS Bank Ltd exercised its call option on the minority shareholders of DBS Diamond Holdings Limited (“DDH”) to acquire approximately 28.4% of the remaining issued share capital of DDH. DDH owned 100% of Dao Heng Bank Group Limited (“DHG”). Goodwill arising from the acquisition of the remaining 28.4% interest in DDH is amortised over a period of 19 years from January 2003. As a result, goodwill amortisation in 9 Months 2003 increased when compared to 9 Months 2002.
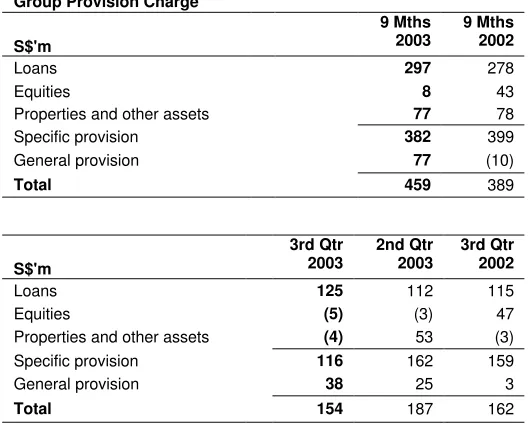
pro-Table 4
Properties and other assets 77 78
Specific provision 382 399
General provision 77 (10)
Total 459 389
Loans 125 112 115
Equities (5) (3) 47
Properties and other assets (4) 53 (3)
Specific provision 116 162 159
General provision 38 25 3
Total 154 187 162
Provision Charge
Total provision charge was S$459 million for 9 Months 2003. Approximately 74% of the total charge was loan-related.
Higher general provisions were made in 9 Months 2003 following an increase in customer loans outstanding. This increase contrasts with 9 Months 2002 where customer loans outstanding declined from year-end and general provision reserves were released.
Compared to 2nd Qtr 2003, total provision charge was lower by S$33 million. In 2nd Qtr 2003, provision charge was set aside for properties and other assets of Singapore and Hong Kong in view of the weak economic conditions prevailing for most of the quarter.
Exhibit 2
S'pore & others DTDB DBS Bk (HK) NPL rate
Note:
1/ NPL rate is computed based on total non-bank customer NPLs (excluding non-performing debt securities and non-cash items) divided by total gross non-bank customer loans.
Table 5
Group Geographical NPL Rate (Based on MAS standard)
(%)
Singapore 3.9 4.2 3.7
Hong Kong 3.3 3.5 3.5
Regional countries (excl. DTDB) 20.7 40.6 38.8
DTDB 29.4 27.0 27.1
Other countries 6.7 8.7 7.4
Notes:
1/ DTDB : DBS Thai Danu Bank Public Company Limited
2/ Regional countries (RC) include Malaysia, Indonesia, Thailand, Korea and the Philippines
Asset Quality
The volume of non-performing loans (“NPLs”) fell slightly to S$4.1 billion at the end of September 2003. Approximately S$1.6 billion of restructured NPLs continues to be included in the total volume of NPLs.
The ratio of NPLs to the total non-bank loans (“NPL rate”) decreased from 6.1% at the end of December 2002 to 5.7% at the end of September 2003, helped in part by a higher non-bank loan base.
The NPL rate for Hong Kong operations was 3.3% at the end of September 2003. The Group’s Hong Kong credit card business recorded a 1.8% delinquent loan rate for 90 days past due. The net charge-off rate for 9 Months 2003 was 11.8%, down from the 12% rate for the first 6 months of 2003. The relatively high charge-off rate reflects the high unemployment rate and number of personal bankruptcy filings.
Exhibit 3
Group Non-Performing Loans – by Loan Grading
S$’ m
2,336 2,576 258 3,799 5,121
3,607 3,411 2,985 3,114 3,077 3,017 2,936
891
282 267 252 240 295 316 4,143
As at end September 2003, the classification of non-performing loans into substandard, doubtful and loss categories was virtually unchanged compared to end December 2002.
Exhibit 4
Group Cumulative Specific and General Provisions
2,496 2,605
129.9 142.5 124.8 120.7 120.9 118.8 121.7
44.4 52.6 51.8 60.3 61.0 59.2 59.9 60.0 62.9 0
SP GP SP+GP/Unsecured NPLs SP+GP/NPLs
Cumulative Specific and General
Provisions
Total cumulative specific and general provisions at the end of September 2003 was 121.7% of unsecured NPLs, and 62.9% of total NPLs.
Table 6
Group Key Balance Sheet Items
S$'m
Total assets 160,231 149,445 148,315 Customer loans 1/ 63,902 60,709 63,442 Customer deposits 107,056 101,315 100,419 Loan-to-deposit ratio (%) 59.7 59.9 63.2 Loan and non-trading debt
securities-to-deposit ratio (%) 77.6 73.2 76.3 Note:
1/ After deducting cumulative provisions.
Balance Sheet
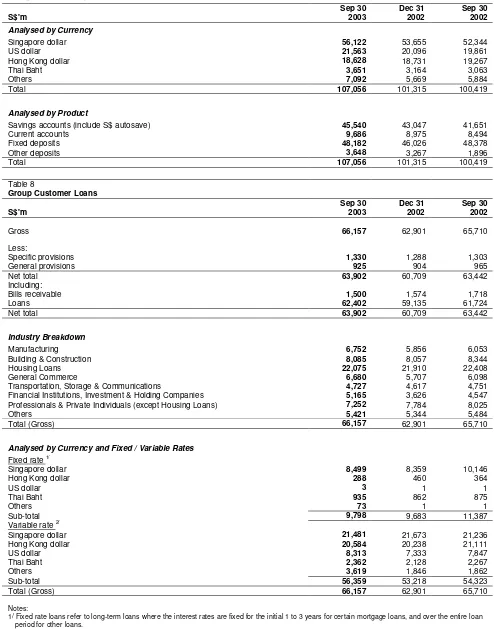
Table 7
Group Customer Deposits
S$'m
Sep 30 2003
Dec 31 2002
Sep 30 2002
Analysed by Currency
Singapore dollar 56,122 53,655 52,344
US dollar 21,563 20,096 19,861
Hong Kong dollar 18,628 18,731 19,267
Thai Baht 3,651 3,164 3,063
Others 7,092 5,669 5,884
Total 107,056 101,315 100,419
Analysed by Product
Savings accounts (include S$ autosave) 45,540 43,047 41,651
Current accounts 9,686 8,975 8,494
Fixed deposits 48,182 46,026 48,378
Other deposits 3,648 3,267 1,896
Total 107,056 101,315 100,419
Table 8
Group Customer Loans
S$'m
Sep 30 2003
Dec 31 2002
Sep 30 2002
Gross 66,157 62,901 65,710
Less:
Specific provisions 1,330 1,288 1,303
General provisions 925 904 965
Net total 63,902 60,709 63,442
Including:
Bills receivable 1,500 1,574 1,718
Loans 62,402 59,135 61,724
Net total 63,902 60,709 63,442
Industry Breakdown
Manufacturing 6,752 5,856 6,053
Building & Construction 8,085 8,057 8,344
Housing Loans 22,075 21,910 22,408
General Commerce 6,680 5,707 6,098
Transportation, Storage & Communications 4,727 4,617 4,751 Financial Institutions, Investment & Holding Companies 5,165 3,626 4,547 Professionals & Private Individuals (except Housing Loans) 7,252 7,784 8,025
Others 5,421 5,344 5,484
Total (Gross) 66,157 62,901 65,710
Analysed by Currency and Fixed / Variable Rates Fixed rate 1/
Singapore dollar 8,499 8,359 10,146
Hong Kong dollar 288 460 364
US dollar 3 1 1
Thai Baht 935 862 875
Others 73 1 1
Sub-total 9,798 9,683 11,387
Variable rate 2/
Singapore dollar 21,481 21,673 21,236
Hong Kong dollar 20,584 20,238 21,111
US dollar 8,313 7,333 7,847
Thai Baht 2,362 2,128 2,267
Others 3,619 1,846 1,862
Sub-total 56,359 53,218 54,323
Total (Gross) 66,157 62,901 65,710
Notes:
1/ Fixed rate loans refer to long-term loans where the interest rates are fixed for the initial 1 to 3 years for certain mortgage loans, and over the entire loan period for other loans.
Table 9
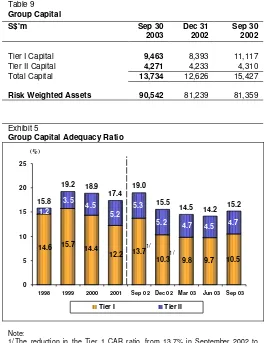
Tier I Capital 9,463 8,393 11,117 Tier II Capital 4,271 4,233 4,310 Total Capital 13,734 12,626 15,427
Risk Weighted Assets 90,542 81,239 81,359
Exhibit 5
Group Capital Adequacy Ratio
9.7 10.5
1/ The reduction in the Tier 1 CAR ratio, from 13.7% in September 2002 to 10.3% in December 2002, was primarily due to the deduction of additional goodwill with DBS' purchase of the DBS Diamond Holdings Limited minority interest in early January 2003.
Capital Adequacy Ratio
At the end of September 2003, the total Capital Adequacy Ratio (“CAR”) for the DBSH Group, measured according to the Bank for International Settlements (“BIS”) guidelines was 15.2%.
Exhibit 6
Group Unrealised Valuation Surpluses
692
Unrealised valuation surpluses in properties and quoted investment securities not recognised in the accounts amounted to S$749 million at the end of September 2003.
Note:
1/ Unrealised valuation surpluses for 1998 to 2002 were not adjusted for the change in accounting policy on valuation of trading securities.
1/ 1/
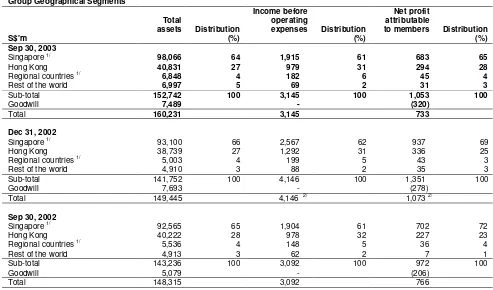
Geographical Segment Analysis
The following table analyses total assets, income before operating expenses and NPAM by geographical segments. Unless otherwise stated, the analysis of geographical segments are generally based on the location of the office recording the transactions.
Table 10
Group Geographical Segments
S$'m
Total
assets Distribution (%)
Income before operating
expenses Distribution (%)
Net profit attributable
to members Distribution (%) Sep 30, 2003
Singapore 1/ 98,066 64 1,915 61 683 65
Hong Kong 40,831 27 979 31 294 28
Regional countries 1/
6,848 4 182 6 45 4
Rest of the world 6,997 5 69 2 31 3
Sub-total 152,742 100 3,145 100 1,053 100
Goodwill 7,489 - (320)
Total 160,231 3,145 733
Dec 31, 2002
Singapore 1/
93,100 66 2,567 62 937 69
Hong Kong 38,739 27 1,292 31 336 25
Regional countries 1/
5,003 4 199 5 43 3
Rest of the world 4,910 3 88 2 35 3
Sub-total 141,752 100 4,146 100 1,351 100
Goodwill 7,693 - (278)
Total 149,445 4,146 2/ 1,073 2/
Sep 30, 2002
Singapore 1/ 92,565 65 1,904 61 702 72
Hong Kong 40,222 28 978 32 227 23
Regional countries 1/
5,536 4 148 5 36 4
Rest of the world 4,913 3 62 2 7 1
Sub-total 143,236 100 3,092 100 972 100
Goodwill 5,079 - (206)
Total 148,315 3,092 766
Notes:
1/ Special general provisions for regional exposure and additional provisions for DTDB's loans are booked in Singapore. 2/ Refers to the full year 2002.
DBSH Group operates in four main geographical areas :
• “Singapore”, which includes the operations of the Asian Currency Unit.
• “Hong Kong”, which includes branch and subsidiary operations in Hong Kong.
• "Regional countries", which includes branch and subsidiary operations in Malaysia, Indonesia, Thailand, Korea and the Philippines.
• “Rest of the world”, which are mainly branch operations in China, India, Taiwan, United States and
United Kingdom.
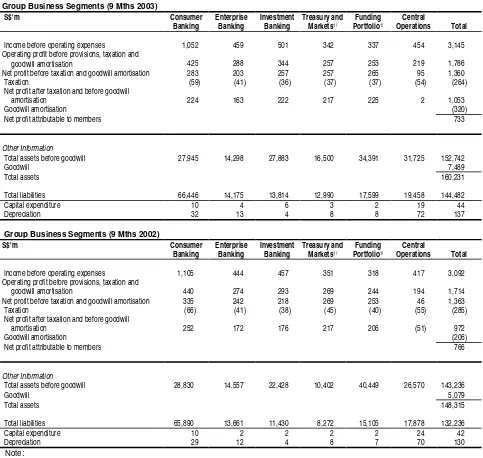
Business Segment Analysis
The business segment results represent the customer segments of the respective businesses and are determined by:
• Income and direct expenses attributable to each customer and other segment; and
• Management accounting policies relating to the allocation of indirect expenses and funds transfer pricing between the central treasury unit and the customer/other segments.
The various customer segments are described below, along with a description of the change in net profit after taxation for the 9 Months 2003 over the same period last year.
• Consumer Banking
Consumer Banking focuses on providing products and services to individual customers. The products and services offered to customers include credit facilities (mortgage, personal loans, etc.), credit cards, deposit collection, remittance services and asset management products.
The decrease in net profit after taxation (S$28 million, 11.1%) was largely due to lower interest income and higher provisions, offset in part by lower expenses.
• Enterprise Banking
Enterprise Banking focuses on providing products and services to small and medium enterprises. The product and services offered to customers include credit facilities (overdraft, factoring/accounts receivable purchase, trade financing, commercial/industrial property financing, hire purchase and government financing and assistance schemes), deposit, payment and collection services.
The decrease in net profit after taxation (S$9 million, 5.2%) was mainly attributable to higher provisions, partly offset by higher fee income from trade services.
• Investment Banking
Investment Banking caters to the business needs of large corporate customers and financial institutions. The products and services offered to customers include direct lending, advisory banking services, bond issuance, equity financing, syndicated financing, mergers and acquisitions advisory services, debt restructuring advisory services, nominee and trustee services and cash management services.
The increase in net profit after taxation (S$46 million, 26.1%) was due to higher loan volume and capital markets activity, as well as higher non-interest income from the sale of equity holdings.
• Treasury and Markets
Treasury and Markets is primarily involved in market making, structuring and trading of financial products including foreign exchange, securities and interest rate/ credit/ equity/ foreign exchange derivatives. Income from treasury products and services relating to customers of other segments is reflected in the respective customer segments.
The net profit after taxation is in line with the previous year.
The other segments of the analysis are:
• Funding Portfolio
The Funding Portfolio managed by Treasury and Markets is the net aggregate of the Group’s interest earning assets and interest bearing liabilities. The income generated from this portfolio is predominantly interest rate in nature.
• Central Operations
Central Operations encompasses a range of activities, with corporate decisions made at the centre and the related income and expenses not attributed to business segments. These include the central treasury unit, funding costs of DBSH Group’s associated and subsidiary companies and gains/losses on properties as well as certain subsidiaries including stock brokerage and asset management.
The following table analyses the results, total assets and total liabilities by business segments:
Table 11
Group Business Segments (9 Mths 2003)
S$'m Consumer
Banking
Enterprise Banking
Investment Banking
Treasury and
Markets1/
Funding Portfolio1/
Central
Operations Total
Income before operating expenses 1,052 459 501 342 337 454 3,145
Operating profit before provisions, taxation and
goodwill amortisation 425 288 344 257 253 219 1,786
Net profit before taxation and goodwill amortisation 283 203 257 257 265 95 1,360
Taxation (59) (41) (36) (37) (37) (54) (264)
Net profit after taxation and before goodwill
amortisation 224 163 222 217 225 2 1,053
Goodwill amortisation (320)
Net profit attributable to members 733
Other Information
Total assets before goodwill 27,945 14,298 27,883 16,500 34,391 31,725 152,742
Goodwill 7,489
Total assets 160,231
Total liabilities 66,446 14,175 13,814 12,990 17,599 19,458 144,482
Capital expenditure 10 4 6 3 2 19 44
Depreciation 32 13 4 8 8 72 137
Group Business Segments (9 Mths 2002)
S$'m Consumer
Banking
Enterprise Banking
Investment Banking
Treasury and
Markets1/
Funding Portfolio1/
Central
Operations Total
Income before operating expenses 1,105 444 457 351 318 417 3,092
Operating profit before provisions, taxation and
goodwill amortisation 440 274 293 269 244 194 1,714
Net profit before taxation and goodwill amortisation 335 242 218 269 253 46 1,363
Taxation (66) (41) (38) (45) (40) (55) (285)
Net profit after taxation and before goodwill
amortisation 252 172 176 217 206 (51) 972
Goodwill amortisation (206)
Net profit attributable to members 766
Other Information
Total assets before goodwill 28,830 14,557 22,428 10,402 40,449 26,570 143,236
Goodwill 5,079
Total assets 148,315
Total liabilities 65,890 13,661 11,430 8,272 15,105 17,878 132,236
Capital expenditure 10 2 2 2 2 24 42
Depreciation 29 12 4 8 7 70 130
Note:
1/ Operating expenses and provisions have been determined by prorating between Treasury and Markets and the Funding Portfolio based on the share of income before operating expenses.