DBS GROUP HOLDINGS LTD AND ITS SUBSIDIARY COMPANIES
Fina nc ia l Pe rform a nc e Sum m a ry For Y e a r 2 0 0 0
1999
2000
Incr/
(Decr)
Profit and Loss Account
S$’m
S$’m
%
Net interest income
2,034.7
2,039.4
0.2
Fee and commission income
423.1
508.5
20.2
Dividends
31.3
82.9
164.8
Rental income
30.7
32.1
4.4
Other income
509.1
268.1
(47.3)
Income before operating expenses
3,028.9
2,931.0
(3.2)
Staff costs
(529.3)
(613.2)
15.9
Other operating expenses
(535.4)
(632.5)
18.1
Operating profit
1,964.2
1,685.3
(14.2)
Provisions
(1,063.2)
(53.6)
(95.0)
Associated companies
140.4
43.1
(69.3)
Net profit before tax
1,041.4
1,674.8
60.8
Taxation
(379.5)
(315.1)
(17.0)
Minority interests
409.9
29.1
(92.9)
Net profit attributable to members
1,071.8
1,388.8
29.6
Dec 31
1999
Dec 31
2000
Incr/
(Decr)
Key Balance Sheet Data
S$’m
S$’m
%
Total assets
106,464.9
111,228.1
4.5
Customer loans
54,369.5
52,023.8
(4.3)
Customer deposits
82,268.3
80,720.5
(1.9)
DBS GROUP HOLDINGS LTD AND ITS SUBSIDIARY COMPANIES
Table 1
Group Key Financial Indicators
Ratios 1996 1997 1998 1999 2000
Return on Equity (%) 10.30 6.19 1.29 10.35 12.89 Return on Assets (%) 1.28 0.72 0.14 1.04 1.28 Earnings per Share
- Basic (S$) 0.77 0.52 0.10 0.97 1.13
Financial Indicators
Return on equity (ROE) increased to 12.89% compared to 10.35% in 1999, an improvement over the ROE achieved prior to the financial crisis in 1997/1998. Return on assets and earnings per share also registered increases to 1.28% and S$1.13 respectively.
Exhibit 1
Group Net Profit Attributable to Members
670 436 112 1,072 1,389 (+29.6% ) 0 200 400 600 800 1000 1200 1400
1996 1997 1998 1999 2000 S$ million
Profit and Loss
Net profit attributable to members in 2000 increased 29.6% to S$1,388.8 million. The increase was mainly due to significant reduction in loan provisions resulting from active management of non-performing loans across the region.
At operating profit level, the decrease of 14.2% to S$1,685.3 million in 2000 was attributable to lower other income and higher operating expenses. Other income in 1999 included the profit from sale of Singapore Petroleum Company shares (S$117.1 million) and securitisation of DBS Tampines Centre (S$57.5 million).
Exhibit 2
Group Net Interest Income and Net Interest Margin
863 1,002 1,430 2,035 2,039 (+0.2% ) 0 500 1000 1500 2000 2500
1996 1997 1998 1999 2000
S$ million
2.02
1.75 1.73 1.77
2.02
Net Interes t Margin (%)
Net Interest Income and Net Interest Margin
DBS GROUP HOLDINGS LTD AND ITS SUBSIDIARY COMPANIES
Table 2
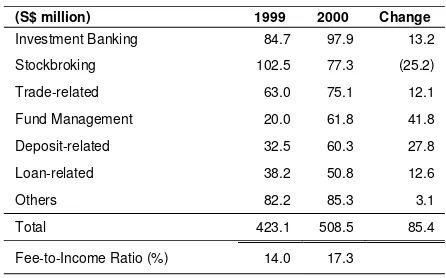
Group Fee and Commission Income
(S$ million) 1999 2000 Change
Investment Banking 84.7 97.9 13.2
Stockbroking 102.5 77.3 (25.2)
Trade-related 63.0 75.1 12.1
Fund Management 20.0 61.8 41.8
Deposit-related 32.5 60.3 27.8
Loan-related 38.2 50.8 12.6
Others 82.2 85.3 3.1
Total 423.1 508.5 85.4
Fee-to-Income Ratio (%) 14.0 17.3
Fee and Commission Income
Fee and commission income increased 20.2% to S$508.5 million, due mainly to higher fund management fees (S$41.8 million), deposit-related fees (S$27.8 million), trade and loan-related fees (S$24.7 million), and investment banking income (S$13.2 million). These increases were partially offset by lower stockbroking fees (S$25.2 million). Fee and commission income contributed to 17.3% of the total operating income, up from 14.0% for 1999.
Dividend Income
Dividend income increased 164.8% to S$82.9 million, contributed by receipt of special dividends of S$49.6 million from NatSteel Limited in 2000.
Table 3
Group Other Income
(S$ million) 1999 2000 Change
Net gains on trading in foreign
exchange 90.1 119.0 28.9
Net gains on sale of trading securities
and derivatives trading 185.5 55.4 (130.1) Net gains on disposal of investment
securities:
! Sale of Singapore Petroleum
Company shares 117.1 - (117.1)
! Others 26.4 40.8 14.4
Net gains arising from divestment of
DBS Tampines Centre 57.5 - (57.5) Net gains on disposal of fixed assets 1.1 9.2 8.1
Others 31.4 43.7 12.3
Total 509.1 268.1 (241.0)
Other Income
DBS GROUP HOLDINGS LTD AND ITS SUBSIDIARY COMPANIES
Table 4
Group Operating Expenses
(S$ million) 1999 2000 Change
Staff costs 529.3 613.2 83.9 Occupancy expenses 138.5 147.4 8.9 Technology-related expenses 108.6 132.4 23.8 Professional and consultancy fees 62.8 72.5 9.7
Others 225.5 280.2 54.7
Total 1,064.7 1,245.7 181.0
Cost-to-Income Ratio (%) 35.2 42.5
Operating Expenses
The 17.0% increase in operating expenses to S$1,245.7 million was mainly due to higher staff costs of S$83.9 million incurred for aligning staff remuneration to market and the hiring of additional staff to build a stronger and deeper senior management team. In addition, higher advertising expenses (S$20.4 million), technology-related expenses (S$23.8 million) and professional and consultancy fees (S$9.7 million) were incurred for various Group initiatives. Approximately 20% of the operating expenses were incurred for investment-related (versus maintenance-related) expenses. The increase in operating expenses was also due to the inclusion of DBS Kwong On Bank (DKOB)’s operating expenses for a full year in 2000 (DKOB was consolidated from May 1, 1999). Excluding the impact of DKOB, operating expenses would have increased 12.4% year over year.
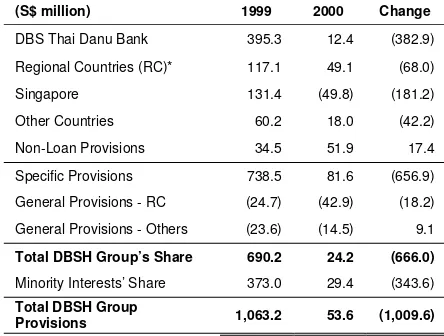
Table 5
Group Provisions
(S$ million) 1999 2000 Change
DBS Thai Danu Bank 395.3 12.4 (382.9)
Regional Countries (RC)* 117.1 49.1 (68.0)
Singapore 131.4 (49.8) (181.2)
Other Countries 60.2 18.0 (42.2)
Non-Loan Provisions 34.5 51.9 17.4
Specific Provisions 738.5 81.6 (656.9)
General Provisions - RC (24.7) (42.9) (18.2)
General Provisions - Others (23.6) (14.5) 9.1
Total DBSH Group’s Share 690.2 24.2 (666.0)
Minority Interests’ Share 373.0 29.4 (343.6)
Total DBSH Group
Provisions 1,063.2 53.6 (1,009.6)
* Refers to Malaysia, Indonesia, Thailand, Korea and the Philippines.
Provisions
Provisions declined substantially by 95.0% to S$53.6 million, due mainly to lower provisions for DBS Thai Danu Bank (DTDB)’s loans (including the Minority Interests’ share, the decrease in provision was S$739.3 million). For loans to Singapore borrowers, there was a write-back of S$49.8 million in 2000 compared to a provision charge of S$131.4 million in 1999.
Minority Interests
DBS GROUP HOLDINGS LTD AND ITS SUBSIDIARY COMPANIES
Table 6
Group Business Segments (2000)
(S$ million) Consumer Banking
Investment Banking
Treasury and Markets
Central
Operations Total
DBS Thai Danu Bank
Grand Total
Income before operating
expenses 1,623 873 354 4 2,854 77 2,931
Net profit before taxation
(Segment results) 799 733 268 (92) 1,708 (33) 1,675
Taxation (169) (169) (59) 82 (315) - (315)
Net profit attributable to
members 620 561 205 19 1,405 (16) 1,389
(% of total) 44.6 40.4 14.8 1.4 101.2 (1.2) 100.0
Total segment assets 26,651 30,386 30,903 19,300 107,240 3,988 111,228
Total segment liabilities 68,134 15,494 6,158 7,761 97,547 3,312 100,859
Capital expenditure 32 6 14 187 239 8 247
Depreciation 33 5 5 82 125 11 136
Table 7
Group Business Segments (1999)
(S$ million) Consumer Banking
Investment Banking
Treasury and Markets
Central
Operations Total
DBS Thai Danu Bank
Grand Total
Income before operating
expenses 1,364 910 281 386 2,941 88 3,029
Net profit before taxation
(Segment results) 757 470 241 410 1,878 (837) 1,041
Taxation (205) (112) (56) (5) (378) (1) (379)
Net profit attributable to
members 549 358 185 410 1,502 (430) 1,072
(% of total) 51.2 33.4 17.3 38.2 140.1 (40.1) 100.0
Total segment assets 25,958 33,509 21,151 21,074 101,692 4,773 106,465
Total segment liabilities 68,534 12,479 5,332 4,936 91,281 4,560 95,841
Capital expenditure 26 5 11 158 200 24 224
[image:5.595.88.536.461.714.2]DBS GROUP HOLDINGS LTD AND ITS SUBSIDIARY COMPANIES
Business Segmental Analysis
The business segment results are prepared based on internal financial reporting system amended to reflect the organisation’s management reporting structure. The worldwide activities of DBSH Group are highly integrated and accordingly, it is not possible to present segment information without making internal allocations, some of which are necessarily subjective. As a result, amounts for each business segment are shown after the allocation of certain centralised costs, funding income and the application of transfer pricing, where appropriate. Transactions between segments are recorded within the segment as if they are third party transactions and are eliminated on consolidation.
Unless otherwise stated, the analyses of geographical segments are generally based on the location of office recording the transactions.
The financial statement presents an analysis of the results by classes of business based on the following business groupings:
• Consumer Banking
Consumer Banking focuses on providing products and services to individual customers and small and medium enterprises. The segment’s profit before tax increased by 6%, contributed by higher business volume. The increase was, however, partially offset by higher costs associated with new business initiatives undertaken.
• Investment Banking
Investment Banking caters to the business needs of large corporate customers and financial institutions. Profit before tax increased significantly by 56% due to a net write back of S$46.0 million provisions compared to additional provisions of S$248.0 million in 1999.
• Treasury and Markets
Treasury and Markets is involved in proprietary trading in treasury related products and services such as foreign exchange and derivatives, money market operations and securities trading. Income from customer related trading is reflected in Consumer Banking and Investment Banking. Profit before tax increased by 11% reflecting expansion of business to cover more products in the treasury market.
• Central Operations
Central operations are a variety of activities which support the operating business. It includes corporate income and expense items that are not allocated to individual business segments. The income and funding cost of DBSH Group’s associated companies are included in this category. Segment profits in 1999 included profits from securitisation of DBS Tampines Centre and equity trading, while significantly higher funding costs for strategic investments (for example, BPI) were incurred in 2000.
• DBS Thai Danu (“DTDB”)
DBS GROUP HOLDINGS LTD AND ITS SUBSIDIARY COMPANIES
Exhibit 3
Group Non-Performing Loans
0 2000 4000 6000 8000 10000
Jun 98 Dec 98 Jun 99 Dec 99 Jun 00 Dec 00
DTDB 3,907 7,086 8,121 8,149 7,666 4,411 S$ million 13.0 13.1 11.8 7.6 8.5 12.7
NBk NPL/NBk Loans
Exhibit 4
Group Non-Performing Loans – by Loan Grading
0 2000 4000 6000 DTDB DKOB Others 5RC S'pore Substandard Doubtful Loss 1,735 667 358 412 3,172 1,238 4,411 Total (ex-DTDB) Total (incl-DTDB)
RC - Regional countries
S$ million
Asset Quality
Non-performing loans (NPLs) decreased 45.9% to S$4,410.5 million at end-December 2000. The decline in NPLs in 2000 was mainly due to the sale of S$1,223.1 million of DTDB’s NPLs. In addition, NPLs for Singapore, Indonesia and Hongkong also registered decreases of S$689.7 million, S$389.9 million and S$310.4 million respectively.
Non-bank NPLs as a percentage of total non-bank loans stood at 7.6%, a sharp drop compared with 13.0% at end-December 1999, reflecting DBSH’s aggressive management of its NPL portfolio across the region.
Of the total S$4,410.5 million in NPLs, 80% were in the substandard category and 60% were secured by collateral.
Approximately 20% of the NPLs that had been classified as substandard were “performing” NPLs. These loans were classified due to weak financials although debt servicing was still current.
Exhibit 5
Group Cumulative Specific and General Provisions
0 1000 2000 3000 4000 5000
Jun 98 Dec 98 Jun 99 Dec 99 Jun 00 Dec 00
SP GP S$ million 1,894 3,147 3,852 4,286 3,978 2,286
SP+GP/ Unsecured NPLs SP+GP/NPLs
5 1 .8 1 1 9 .6 1 0 2 .7 1 1 0 .6 1 1 8 .4 1 1 4 .8 1 2 9 .9
4 8 .5 4 4 .4 4 7 .4 5 2 .6 5 1 .9
Cumulative Specific and General Provisions
Total cumulative specific and general provisions at end-December 2000 amounted to 130% of unsecured NPLs, and 52% of total NPLs (or 61% of total NPLs of S$3,723.6 million under US SEC guidelines).
DBS GROUP HOLDINGS LTD AND ITS SUBSIDIARY COMPANIES
Table 8
Key Balance Sheet Items
(S$ million) 1999 2000 Change
Total Assets 106,464.9 111,228.1 4,763.2 Customer Loans and Advances 54,369.5 52,023.8 (2,345.7) Customer Deposits 82,268.3 80,720.5 (1,547.8) Loans-to-Deposits Ratio (%) 66.1 64.5
Balance Sheet
[image:8.595.81.311.205.694.2]Total assets were up 4.5% to S$111.2 billion. Customer loans fell 4.3% to S$52.0 billion, mainly attributable to weak loan demand, the adoption of more stringent credit underwriting standards that link risk versus return, and the Group’s strategy of shedding lower yielding assets from its balance sheet through the securitisation of loans. Customer deposits decreased 1.9%, attributable to a S$3.1 billion decline in Singapore dollar deposits, reflecting the shift of funds from traditional deposit products (for example, fixed deposits) to other forms of investments such as unit trusts and single premium plans. Loan-to-deposit ratio was 64.5%, as compared to 66.1% for 1999.
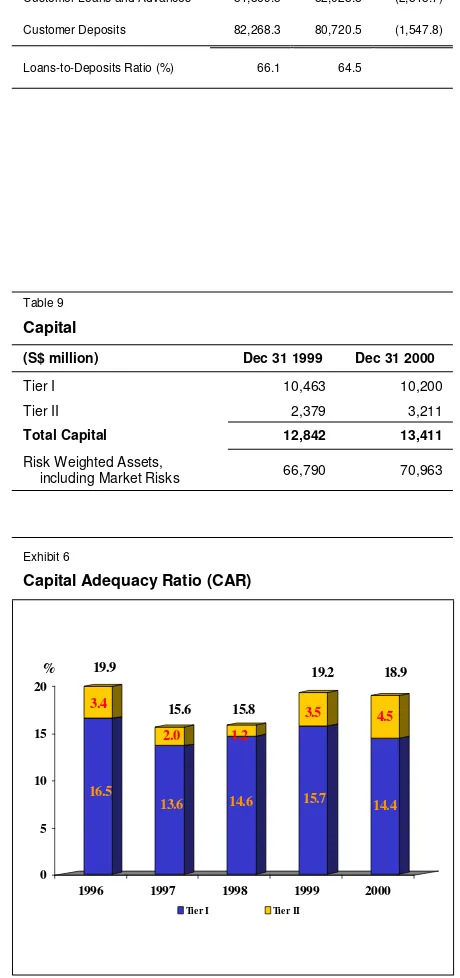
Table 9
Capital
(S$ million) Dec 31 1999 Dec 31 2000
Tier I 10,463 10,200
Tier II 2,379 3,211
Total Capital 12,842 13,411
Risk Weighted Assets,
including Market Risks 66,790 70,963
Exhibit 6
Capital Adequacy Ratio (CAR)
16.5 3.4
13.6 2.0
14.6 1.2
15.7 3.5
14.4 4.5
0 5 10 15 20
1996 1997 1998 1999 2000 Tier I Tier II
% 19.9
15.6 15.8
19.2 18.9
Capital Adequacy Ratio (CAR)
Combined Tier I and II CAR, measured according to the Bank of International Settlements (BIS) guidelines, remain strong at 18.9%, which is more than twice the minimum BIS requirement of 8%. Of the total, 14.4% is in the form of Tier I capital.
DBS GROUP HOLDINGS LTD AND ITS SUBSIDIARY COMPANIES
Exhibit 7
Unrealised Valuation Surpluses
1,916
1,204
807
1,164
692
729
589
827
498
677
0 50 0 10 00 15 00 20 00 25 00 30 00 35 00
19 96 19 97 19 98 19 99 20 00 S$ million
Q uote d Inv e stme nts Prope rtie s
3 ,12 0
1 ,97 1
1 ,42 1 1 ,41 6 1 ,17 5
Unrealised Valuation Surpluses
Appendix
DBS GROUP HOLDINGS LTD
CONSOLIDATED PROFIT AND LOSS ACCOUNT FOR THE YEAR ENDED DECEMBER 31
2000 1999
In S$’million
Note
Full Year Second Half First Half Full Year Second Half First Half
Interest income 4,897 2,487 2,410 4,608 2,348 2,260
Less: Interest expense 2,858 1,494 1,364 2,573 1,302 1,271
Net interest income 1 2,039 993 1,046 2,035 1,046 989
Fee and commission income 2 509 249 260 423 239 184
Dividends 83 57 26 31 15 16
Rental income 32 16 16 31 14 17
Other income 3 268 129 139 509 255 254
Income before operating expenses 13 2,931 1,443 1,488 3,029 1,569 1,460
Less: Staff costs 613 332 281 529 296 233
Other operating expenses 633 320 313 536 313 223
Total operating expenses 4 1,246 652 594 1,065 609 456
Operating profit 1,685 791 894 1,964 960 1,004
Less: Provision for possible loan losses and
diminution in value of other assets 54 (10) 64 1,063 727 336
1,632 802 830 901 233 668
Add: Share of profits less losses of associated companies
43 21 22 140 101 39
Net profit before taxation 1,675 823 852 1,041 334 707
Less: Taxation 5 309 153 156 345 189 156
Share of taxation of associated companies 6 2 4 34 26 8
Net profit after taxation 1,360 668 692 662 119 543
Minority interests 6 29 17 12 410 298 112
Net profit attributable to members 12 1,389 685 704 1,072 417 655
Earnings per ordinary share
- Basic 113 Cents 97 Cents
- Fully diluted 107 Cents 87 Cents
(see related notes on pages 3 to 19)
Appendix
DBS GROUP HOLDINGS LTD
CONSOLIDATED BALANCE SHEET AS AT
2000 2000 1999 2000 2000 1999
In S$’million Note Dec 31 Jun 30 Dec 31 Note Dec 31 Jun 30 Dec 31
SHARE CAPITAL AND RESERVES
ASSETS
Share capital 1,307 1,335 1,325 Cash, and balances and placements
with central banks
5,145 4,597 6,944
RESERVES Singapore Government securities and treasury bills
8,655 8,860 8,814
Share premium account 7 185 5
Other reserve 4,273 4,273 4,273 Trading securities 4,849 3,521 3,335
Capital redemption reserve 29 -
-Capital reserve - - 171
General reserve 1,755 1,637 1,635
Balances, placements with, and loans and advances to banks
34,569 32,862 26,494
Revenue reserve 3,124 3,290 3,467
9,188 9,385 9,551
Bills receivable from non-bank customers
9 992 1,144 1,202
SHAREHOLDERS' FUNDS 10,495 10,720 10,876
Loans and advances to non-bank customers
9 51,031 51,285 53,168
MINORITY INTERESTS (126) (127) (251)
Investment securities 341 326 965
SUBORDINATED TERM DEBTS
7 2,508 2,735 1,649
Other assets 3,298 2,547 2,245
LIABILITIES
Deposits and balances of banks
12,054 9,130 7,491 Associated companies 558 615 1,479
Deposits and other accounts of non-bank customers
8 80,720 80,400 82,268 Fixed assets 1,790 1,796 1,820
Other debt securities in issue 655 475 536
Other borrowings 649 620 633
Bills payable 407 393 572
Other liabilities 3,144 2,250 2,009
Current taxation 408 804 510
Deferred taxation 18 13 15
Dividends payable 296 139 158
111,228 107,552 106,465 12 111,228 107,552 106,465 Life fund liabilities to
policyholders
1,289 1,053 - Life fund assets attributable to policyholders
1,289 1,053
-TOTAL LIABILITIES AND
SHAREHOLDERS’ FUNDS 112,517 108,605 106,465 TOTAL ASSETS 112,517 108,605 106,465
MEMORANDUM ITEMS
Contingent liabilities 8,674 11,075 8,554
Commitments 33,065 35,814 35,304
41,739 46,889 43,858
Financial derivatives 176,194 76,914 43,527
Appendix
NOTES TO THE AUDITED CONSOLIDATED FINANCIAL STATEMENTS
1
Net Interest Income and Margin
DBS Group Holdings Ltd (DBSH)’s net interest income for 2
ndHalf 2000 was S$53
million lower than 1
stHalf 2000. The net interest margin was 1.97% compared to 2.07%
in 1
stHalf 2000. The lower net interest margin was attributable to intensified competition
resulting in margin being squeezed for housing loans and funding costs incurred for
investment in Bank of the Philippine Islands. The flatter yield curve prevailing in 2000,
particularly in the 2
ndHalf of the year had also reduced gapping opportunities.
For 2000:
In S$'million Year 2000 Second Half 2000 First Half 2000
Average
balance Interest
Average rate (%)
Average
balance Interest
Average rate@
(%)
Average
balance Interest
Average rate@
(%)
Interest bearing assets 101,020 4,897 4.85 101,009 2,487 4.92 101,026 2,410 4.77
Non-interest bearing assets
6,732 - - 6,412 7,058 -
-Total assets 107,752 107,421 108,084
Interest bearing liabilities
94,038 2,858 3.04 93,908 1,494 3.18 94,169 1,364 2.90
Non-interest bearing liabilities
2,842 - - 2,979 2,702 -
-Total liabilities 96,880 96,887 96,871
Net interest income 2,039 993 1,046
Net interest income as a % of average interest bearing assets
2.02 1.97 2.07
Appendix
For 1999:
In S$'million Year 1999 Second Half 1999 First Half 1999
Average
balance Interest
Average rate (%)
Average
balance Interest
Average rate@
(%)
Average
balance Interest
Average rate@
(%)
Interest bearing assets 100,827 4,608 4.57 102,563 2,348 4.58 99,089 2,260 4.56
Non-interest bearing assets
5,792 - - 6,241 - - 5,339 -
-Total assets 106,619 108,804 104,428
Interest bearing liabilities
94,203 2,573 2.73 95,649 1,302 2.72 92,757 1,271 2.74
Non-interest bearing liabilities
2,315 - - 2,472 - - 2,158 -
-Total liabilities 96,518 98,121 94,915
Net interest income 2,035 1,046 989
Net interest income as a % of average interest
bearing assets
2.02 2.04 2.00
@ Annualised
Average balances are calculated on a monthly average basis.
Interest bearing assets comprise cash, balances and placements with central banks;
balances, placements with, and loans and advances to banks; loans and advances to
non-bank customers including bills receivable, and debt securities held. Non-interest bearing
assets comprise equity investments, fixed assets, accrued interest receivable, sundry
debtors, revaluation of financial instruments, sundry deposits and prepayments.
Appendix
2
Fee and Commission Income
Fee and commission income comprises the following:
2000 1999
In S$’million Year Second Half First Half Year Second Half First Half
Investment banking 98 56 42 85 54 31
Stockbroking 78 31 47 102 48 54
Trade-related 75 37 38 63 35 28
Fund management 62 22 40 20 13 7
Deposit-related 60 37 23 33 18 15
Loan-related 51 27 24 38 24 14
Credit card 33 18 15 25 14 11
Guarantees 26 12 14 28 15 13
Others 26 9 17 29 18 11
Total 509 249 260 423 239 184
3
Other Income
Other income comprises the following:
2000 1999
In S$’million Year Second Half First Half Year Second Half First Half
Net gains on trading in foreign exchange 119 67 52 90 49 41
Net gains on sale of trading securities and
derivatives trading 55 - 55 186 98 88
Net gains on disposal of investment securities:
- Sale of DBS Land shares - Sale of Singapore Petroleum
Company shares
- Others
3
-38
-33
3
-5
-117
26
-26
-117
-Net gains on disposal of fixed assets 9 5 4 59* 57* 2
Other income 44 24 20 31 25 6
Total 268 129 139 509 255 254
* Included net gains on divestment of DBS Tampines Centre (S$58 million)
Appendix
4
Other Operating Expenses
Other operating expenses include the following:
2000 1999
In S$’million Year Second Half First Half Year Second Half First Half
Staff costs 613 332 281 529 296 233
Occupancy expenses 148 75 73 138 77 61
Technology-related expenses 132 69 63 109 60 49
Professional and consultancy fees 73 35 38 63 47 16
Others 280 141 139 226 129 97
Total 1,246 652 594 1,065 609 456
5
DBSH Group taxation expense for 2
ndHalf 2000 was approximately the same level as
1
stHalf 2000. The effective tax rate was 18.8% and 36.4% for 2000 and 1999
respectively. The 2000 effective tax rate was lower than the statutory income tax rate of
25.5% as profit arising from the Asian Currency Unit offshore transactions is subject to
tax at a concessionary rate of 10%. The higher effective tax rate in 1999 over the
statutory corporate income tax rate in Singapore was mainly due to additional provisions
for DBS Thai Danu Bank (“DTDB”) in 1999. These additional provisions were
recognised in DBSH’s consolidated financial statements but not in DTDB’s financial
statements. These additional provisions were, for the most part, not deductible for
Singapore income tax purposes but resulted in lower pre-tax profits on a consolidated
basis for accounting purposes.
6
DBSH Group had a positive minority interest effect of S$29 million and S$410 million
in 2000 and 1999 respectively. As described in paragraph 5 above, this effect reflected
the share attributable to minority shareholders of losses incurred by DTDB (including the
additional provisions taken up at DBSH level).
7
The subordinated term debts of S$2,508 million included two notes totalling S$2,166
Appendix
8
Deposits and Other Accounts of Non-Bank Customers
At December 31, 2000, total customer deposits of DBSH Group amounted to S$80,720
million.
In S$’million
Dec 31 2000
Distribution %
Jun 30 2000
Distribution %
Dec 31 1999
Distribution % Analysed by Currency
Singapore dollar 55,533 68.8 55,974 69.6 58,665 71.3
US dollar 14,573 18.0 12,860 16.0 12,364 15.0
Thai Baht 2,864 3.5 3,287 4.1 4,007 4.9
Japanese Yen 307 0.4 1,000 1.2 357 0.4
Hong Kong dollar 4,414 5.5 4,132 5.2 3,923 4.8
Others 3,029 3.8 3,147 3.9 2,953 3.6
Total 80,720 100.0 80,400 100.0 82,268 100.0
Analysed by Type
Savings account (include S$ autosave)
38,057 47.2 37,467 46.6 40,593 49.3
Current account 8,099 10.0 7,612 9.5 6,269 7.6
Fixed deposits 34,005 42.1 34,003 42.3 34,992 42.5
Other deposits 559 0.7 1,318 1.6 414 0.6
Total 80,720 100.0 80,400 100.0 82,268 100.0
Analysed by Maturity
Repayable on demand 46,178 57.2 45,174 56.2 46,885 57.0
Due within 1 year 34,038 42.2 34,932 43.4 35,154 42.7
Due over 1 year but within 3 years
500 0.6 294 0.4 230 0.3
Due over 3 years but within 5 years
4 # - - -
-Due over 5 years - - - - -
-Total 80,720 100.0 80,400 100.0 82,268 100.0
Appendix
9
Loans to, and Bills Receivable from Non-Bank Customers
At December 31, 2000, total customer loans, including bills receivable of DBSH Group,
amounted to S$52,023 million.
In S$’million
Dec 31 2000
Jun 30 2000
Dec 31 1999
Gross 54,166 56,219 58,438
Less :
Specific provisions 1,141 2,669 2,924
General provisions 1,002 1,121 1,144
Net 52,023 52,429 54,370
Including:
Bills receivable 992 1,144 1,202
Loans 51,031 51,285 53,168
52,023 52,429 54,370
In S$’million
Dec 31 2000
Distribution %
Jun 30 2000
Distribution %
Dec 31 1999
Distribution %
Industry Breakdown
Manufacturing 5,797 10.7 5,639 10.0 5,881 10.1
Building and Construction 8,726 16.1 9,500 16.9 9,607 16.4
Housing Loans 16,304 30.1 16,192 28.8 16,589 28.4
General Commerce 3,701 6.8 4,071 7.3 4,123 7.1
Transportation, Storage and
Communications 3,487 6.4 3,227 5.7 3,471 5.9
Financial Institutions, Investment and Holding
Companies 4,143 7.7 4,670 8.3 5,043 8.6
Professionals and Private Individuals (except Housing Loans)
6,317 11.7 6,014 10.7 5,749 9.8
Others 5,691 10.5 6,906 12.3 7,976 13.7
Appendix
In S$’million
Dec 31 2000
Distribution %
Jun 30 2000
Distribution %
Dec 31 1999
Distribution %
Analysed by Currency and Fixed/ Variable Rates
Fixed rate
Singapore dollar 11,331 91.7 10,790 97.2 10,869 97.5
US dollar 10 # 6 # 7 0.1
Thai Baht 775 6.3 113 1.0 118 1.1
Japanese Yen - - - - -
-Hong Kong dollar 155 1.3 131 1.2 94 0.8
Others 86 0.7 67 0.6 63 0.5
Sub-total 12,357 100.0 11,107 100.0 11,151 100.0
Variable rate
Singapore dollar 24,745 59.2 25,967 57.6 27,716 58.6
US dollar 8,248 19.7 8,056 17.8 8,640 18.3
Thai Baht 1,814 4.3 3,915 8.7 4,093 8.7
Japanese Yen 659 1.6 858 1.9 901 1.9
Hong Kong dollar 5,284 12.6 4,779 10.6 4,644 9.8
Others 1,059 2.6 1,537 3.4 1,293 2.7
Sub-total 41,809 100.0 45,112 100.0 47,286 100.0
Total 54,166 56,219 58,438
Analysed by Maturity
Repayable on demand 4,714 8.7 4,642 8.3 5,163 8.8
Due within 1 year 16,429 30.4 16,151 28.7 16,531 28.3
Due over 1 year but within 3
years 9,771 18.0 11,088 19.7 12,326 21.1
Due over 3 years but within
5 years 5,751 10.6 5,521 9.8 5,632 9.6
Due over 5 years 17,501 32.3 18,817 33.5 18,786 32.2
Total 54,166 100.0 56,219 100.0 58,438 100.0
Analysed by Segment @
Singapore 40,895 75.5 41,712 74.2 43,676 74.7
Other ASEAN 3,753 6.9 5,358 9.5 5,583 9.6
Other Asia Pacific 7,705 14.2 6,940 12.4 6,932 11.9
Rest of the World 1,813 3.4 2,209 3.9 2,247 3.8
Total 54,166 100.0 56,219 100.0 58,438 100.0
# : Insignificant
@ : Based on the location of the bank, branch, or office booking the loan.
Appendix
10
Exposures to Malaysia, Indonesia, Thailand, Korea, the Philippines (Regional Countries),
Hong Kong and China
DBSH Group has exposures to certain countries in the Asia Pacific region.
The exposures are determined based on the location of the credit risk of the customers and
counterparties regardless of where the transactions are booked.
At December 31, 2000, DBSH Group’s exposure in the Regional Countries amounting to
S$7,126 million (1999: S$9,114 million), and in Hong Kong and China amounting to S$8,003
million (1999: S$7,453 million).
Dec 31 2000 Jun 30 2000 Dec 31 1999
In S$’million Assets NPLs Assets NPLs Assets NPLs
Malaysia 815 304 791 388 780 412
Indonesia 487 176 729 417 892 566
Thailand (excluding DTDB) 356 49 464 182 592 234
Korea 1,044 51 1,020 60 753 76
The Philippines 1,354 87 1,412 97 1,203 77
DTDB
4,056
3,070
667
1,238
4,416 4,753
1,144 3,000
4,219 4,895
1,365 3,207
Total Regional NPLs 7,126 1,905 9,169 4,144 9,114 4,571
Hong Kong 6,906 541 6,183 776 6,345 852
China 1,097 153 1,106 158 1,108 124
Total 15,129 2,599 16,457 5,078 16,566 5,547
Appendix
The DBSH Group’s exposures to these countries at December 31, 2000 are as follows:
In S$’million Loans and debt securities
Less: Loans to/Investments in
Financial
Net Exposure
Assets in
Bank
Central Banks &
Govt. securities
Non-Banka
Investments Total
Subsidiaries/
Overseas Branches Amount
As a % of Total Assets
(a) (b) (c) (d) (e)=
(a+b+c+d)
(f) (g)=(e-f) (h)
Malaysia 664 34 645 48 1,391 576 815 0.8
Indonesia 205 47 301 37 591 103 487 0.5
Thailand (excluding
DTDB) 53 9 302 17 381 25 356 0.3
Korea 609 224 385 13 1,231 187 1,044 1.0
The Philippines 271 137 511 694 1,612 258 1,354 1.3
SUB-TOTAL 1,802 451 2,144 809 5,205 1,149 4,056 3.8
DTDB 58 231 2,748 42 3,079 9 3,070 2.8
TOTAL REGIONAL
COUNTRIES 1,860 682 4,892 851 8,284 1,158 7,126 6.4
Hong Kong 783 202 6,226 1,015 8,226 1,320 6,906 6.2
China 743 27 960 9 1,738 641 1,097 1.0
TOTAL 3,386 911 12,078 1,874 18,249 3,120 15,129 13.6
Appendix
The DBSH Group’s exposures to these countries at December 31, 1999 were as follows:
In S$’million Loans and debt securities
Less: Loans to/Investments in
Financial
Net Exposure
Assets in
Bank
Central Banks &
Govt. securities
Non-Banka
Investments Total
Subsidiaries/
Overseas Branches Amount
As a % of Total Assets
(a) (b) (c) (d) (e)=
(a+b+c+d)
(f) (g)=(e-f) (h)
Malaysia 654 50 662 43 1,410 630 780 0.8%
Indonesia 347 122 578 12 1,059 167 892 0.9%
Thailand (excluding
DTDB) 245 8 475 25 754 162 592 0.6%
Korea 410 126 438 9 983 230 753 0.7%
The Philippines 582 69 383 710 1,743 541 1,203 1.2%
SUB-TOTAL 2,238 375 2,536 799 5,948 1,729 4,219 4.1%
DTDB 82 301 4,463 59 4,906 12 4,895 4.6%
TOTAL REGIONAL COUNTRIES
2,320 676 7,000 859 10,855 1,741 9,114 8.6%
Hong Kong 1,227 292 5,485 913 7,916 1,572 6,345 6.0%
China 713 8 1,008 2 1,732 624 1,108 1.0%
TOTAL 4,260 976 13,493 1,773 20,503 3,936 16,566 15.6%
Appendix
11
Non-Performing Loans and Provisions
At December 31, 2000, DBSH Group’s total non-performing loans amounted to S$4,411 million
(1999: S$8,149 million). Non-performing loans (NPLs) are loans, contingent facilities and debt
instruments classified as “Substandard”, “Doubtful” or “Loss” in accordance with MAS Notice
612.
Out of the total NPLs of S$4,411 million:
-
S$3,508 million (80%) [1999: S$4,952 million (61%)] were in the substandard category;
and
-
S$2,651 million (60%) [1999: S$4,530 million (56%)] were secured by collateral.
Total cumulative specific and general provisions at December 31, 2000 amounted to 130%
(1999: 118%) of unsecured NPLs.
DBSH, in consultation with the Monetary Authority of Singapore, made special general
provisions on the performing loans to Regional Countries over and above the normal specific and
general provisions. Total cumulative specific and general provisions for regional exposure
amounted to S$1,197 million at December 31, 2000 (1999: S$2,871 million).
Details of DBSH Group’s NPLs and provisions at December 31, 2000 were as follows:
In S$’million
Regional Countries Singapore Other
Countries
Total
DTDB (a) Others
2000
Non- Performing Loans (NPLs) 1,238.3 666.7 1,735.3 770.2 4,410.5
- Substandard 955.6 500.8 1,543.9 507.2 3,507.5
- Doubtful 32.3 98.3 28.5 198.4 357.5
- Loss 250.4 67.6 162.9 64.6 545.5
NPLs as a % of:
- Total loans in the respective
countries 40.2% 12.8% 3.5% 2.3% 4.8%
- Group total assets 1.1% 0.6% 1.6% 0.7% 4.0%
Non-bank NPLs as a % of non-bank loans in the respective countries
42.7% 28.2% 4.2% 7.5% 7.6%
Total Cumulative Provisions 719.2 477.7 786.7 302.0 2,285.6
- Specific provisions 544.8 191.3 306.8 194.1 1,237.0
Appendix
Details of DBSH Group’s NPLs and provisions at June 30, 2000 were as follows:
In S$’million
Regional Countries Singapore Other
Countries
Total
DTDB (a) Others
2000
Non- Performing Loans (NPLs) 2,999.5 1,144.0 2,451.7 1,070.6 7,665.8
- Substandard 1,234.6 824.6 2,171.1 712.4 4,942.7
- Doubtful 96.2 114.7 43.4 324.8 579.1
- Loss 1,668.7 204.7 237.2 33.4 2,144.1
NPLs as a % of:
- Total loans in the respective
countries 62.9% 20.0% 5.2% 3.2% 8.4%
- Group total assets 2.8% 1.1% 2.3% 1.0% 7.1%
Non-bank NPLs as a % of non-bank loans in the respective
countries 68.7% 42.0% 5.7% 10.6% 12.7%
Total Cumulative Provisions 1,831.6 794.2 876.0 476.7 3,978.4
- Specific provisions 1,693.3 427.0 405.7 278.5 2,804.4
- General provisions 138.3 367.2 470.3 198.2 1,174.0
Total Cumulative Provisions as a % of:
- Total loans in the respective
countries 38.4% 13.9% 1.8% 1.4% 4.4%
- Group total assets 1.7% 0.8% 0.8% 0.4% 3.7%
- NPLs in the respective countries 61% 69% 36% 45% 52%
- Unsecured NPLs in the respective
Appendix
Details of DBSH Group’s NPLs and provisions at December 31, 1999 were as follows:
In S$’million
Regional Countries Singapore Other
Countries
Total
DTDB (a) Others
1999
Non- Performing Loans (NPLs) 3,206.6 1,364.6 2,425.0 1,152.7 8,149.0
- Substandard 1,170.7 910.1 2,088.7 781.9 4,951.5
- Doubtful 113.7 125.3 48.9 333.1 621.0
- Loss 1,922.2 329.2 287.4 37.7 2,576.4
NPLs as a % of:
- Total loans in the respective
countries 65.4% 22.8% 4.9% 4.2% 9.3%
- Group total assets 3.0% 1.3% 2.3% 1.1% 7.7%
Non-bank NPLs as a % of non-bank loans in the respective
countries 70.4% 47.4% 5.4% 11.3% 13.0%
Total Cumulative Provisions 1,923.9 947.2 938.6 476.2 4,285.9
- Specific provisions 1,785.4 578.7 447.8 282.9 3,094.8
- General provisions 138.5 368.5 490.7 193.4 1,191.0
Total Cumulative Provisions as a % of:
- Total loans in the respective
countries 39.2% 15.9% 1.9% 1.7% 4.9%
- Group total assets 1.8% 0.9% 0.9% 0.4% 4.0%
- NPLs in the respective countries 60% 69% 39% 41% 53%
- Unsecured NPLs in the respective
countries 133% 99% 118% 112% 118%
Appendix
11.1 Industry Analysis of Non-Performing Loans
The following table shows the industry breakdown of the non-performing loans of DBSH Group:
In S$’million
Dec 31 2000
Distribution %
Jun 30 2000
Distribution %
Dec 31 1999
Distribution %
Manufacturing 917.0 20.8 1,785.8 23.3 1,940.1 23.8
Building and Construction 877.5 19.9 1,767.3 23.1 1,846.1 22.6
Housing Loans 254.4 5.8 470.2 6.1 510.6 6.3
General Commerce 847.4 19.2 1,444.8 18.8 1,594.8 19.6
Transportation, Storage
and Communications 233.6 5.3 337.0 4.4 332.1 4.1
Financial Institutions, Investment and Holding Companies
433.0 9.8 681.6 8.9 670.6 8.2
Professionals and Private Individuals (except Housing Loans)
284.9 6.5 366.1 4.8 355.4 4.4
Others 562.7 12.7 813.0 10.6 899.3 11.0
Total 4,410.5 100.0 7,665.8 100.0 8,149.0 100.0
11.2 Accrual, Past Due and Restructured Loans
In an effort to provide information which can be readily compared to international banks,
the non-performing loan analysis has been provided on a basis which is consistent with
requirements of the United States (US) Securities and Exchange Commission (SEC)
disclosure. Whilst this analysis is comparable with US practices, it does, to some extent,
differ from practices employed in Singapore. In particular:
(a)
US banks typically stop accruing interest when loans are overdue 90 days or more,
or when recovery appears doubtful. DBSH continues to recognise interest but at
the same time makes full provision for the interest outstanding. The addition of
interest continues until such time as recovery is considered unlikely. Whilst this
practice does not affect net income, in comparison with US practice, it has the
effect of increasing the reported level of non-performing loans and provisions.
(b)
Singapore banks may write off problem loans more slowly than is the practice in
Appendix
The table which follows presents an analysis of problem loans in accordance with SEC
guidelines. The DBSH credit risk management procedures are based on MAS Notice
612 loan gradings. The information included, which is not derived from those
procedures, is presented to enable users to compare DBSH with other international
institutions. This information is not required under the Singapore Companies Act.
In S$’million
Dec 31 2000
Dec 31 1999 Singapore
Non accrual loans 1,402.6 1,858.8
Non – Restructured Restructured
897.0 505.6
1,471.1 387.7
Regional Countries
Non accrual loans 1,784.3 4,172.9
Non – Restructured Restructured
697.8 1,086.5
3,665.7 507.2
Other Countries
Non accrual loans 536.7 769.7
Non – Restructured Restructured
416.8 119.9
695.4 74.3
3,723.6 6,801.4
Loans not included above which are accruing, but classified
as troubled debt restructuring - 7.3
Total 3,723.6 6,808.7
Appendix
12
SEGMENTAL ANALYSIS
Geographical Segmental Analysis (Secondary segment information)
DBSH Group operates in four main geographical areas:
•
Singapore
,
the home country of DBSH, which includes all the areas of operations in
the primary business segments.
•
“
Other ASEAN countries
”, which includes business activities in Brunei, Cambodia,
Indonesia, Laos, Malaysia, Myanmar, the Philippines, Thailand and Vietnam. The
main activities for other Asean countries comprise mainly branch and subsidiary
operations. “
Other Asia Pacific countries
”, which includes business activities
Australia, Bangladesh, China, Hong Kong, India, Japan, Korea, New Zealand, Pakistan,
Papua New Guinea, Russia, Sri Lanka and Taiwan. The main activities for other Asia
Pacific countries comprise mainly branch and subsidiary operations.
•
Rest of the World
- the main activities are branch operations.
With the exception of Singapore, no other individual country contributed more than 10% of the
consolidated income before operating expenses and of total assets.
Appendix
The following tables analyse total assets, income before operating expenses and net profit
attributable to members by geographical segments.
In S$’million Total assets
(b) Distribution
%
Income before operating
expenses
Distribution %
Net profit attributable to
members
Distribution % December 31 2000
Singapore (a)
89,888 80.8 2,406 82.1 1,207 86.9
Other ASEAN (a)
4,491 4.0 124 4.2 5 0.4
Other Asia Pacific 11,715 10.6 345 11.8 136 9.8
Rest of the World 5,134 4.6 56 1.9 41 2.9
Total 111,228 100.0 2,931 100.0 1,389 100.0
June 30 2000
Singapore (a) 86,053 80.0 1,199 80.5 604 85.8
Other ASEAN (a) 5,171 4.8 93 6.3 10 1.4
Other Asia Pacific 11,192 10.4 165 11.1 66 9.4
Rest of the World 5,136 4.8 31 2.1 24 3.4
Total 107,552 100.0 1,488 100.0 704 100.0
December 31 1999
Singapore (a) 86,241 81.0 2,600 85.8 1,116 104.1
Other ASEAN (a) 5,860 5.5 142 4.7 (106) (c) (9.9)
Other Asia Pacific 9,333 8.8 242 8.0 63 5.9
Rest of the World 5,031 4.7 45 1.5 (1) (0.1)
Total 106,465 100.0 3,029 100.0 1,072 100.0
(a) Singapore includes the operations of the Asian Currency Unit. Special general provisions for regional exposures and additional specific provisions for DTDB’s loans are booked in Singapore.
(b) Total assets exclude “Life fund assets attributable to policyholders”.