Contents
Page
Financial Highlights 2
Financial Review 3
Net Interest Income and Net Interest Margin 5
Non-Interest Income 6
Operating Expenses 7
Provision Charge 7
Balance Sheet 8
Asset Quality 8
Customer Deposits 10
Customer Loans 10
Capital Adequacy Ratio 11
Unrealised Valuation Surpluses 11
Geographical Segment Analysis 12
Business Segment Analysis 13
Dividend 15
Subsequent Event 15
Comparatives 15
Appendix I: Unaudited Consolidated Profit and Loss Account Appendix II: Unaudited Consolidated Balance Sheet
Appendix III: Unaudited Balance Sheet of DBS Group Holdings Ltd Appendix IV: Unaudited Statements of Changes in Shareholders’ Equity Appendix V: Unaudited Consolidated Cash Flow Statement
Appendix VI: Selected Notes to the Accounts 1. Issuance of Ordinary Shares 2. Earnings Per Ordinary Share
3. Loan and Investment Exposures to Malaysia, Indonesia, Thailand, Korea, the Philippines (Regional Countries), Hong Kong and China
4. Non-Performing Loans and Provisions 5. Financial Derivatives
Financial Highlights
DBS Group Holdings Ltd (“DBSH”) prepares its consolidated DBSH Group (“Group”) financial statements in accordance with Singapore Financial Reporting Standards (“FRS”).
In $ millions
1st Qtr 2004
1st Qtr 2003
Change %
4th Qtr 2003
Change % For the period
Operating income 1,266 1,047 20.9 1,053 20.2 Operating profit before goodwill amortisation and
provisions 763 605 26.1 571 33.6
Operating profit before provisions 653 498 31.1 461 41.6 Net profit before taxation 621 392 58.4 397 56.4 Net profit attributable to members 488 271 80.1 292 67.1 Net profit attributable to members (excluding
goodwill amortisation) 598 378 58.2 402 48.8
At period-end
Shareholders' funds 15,383 14,526 5.9 14,896 3.3 Interest bearing assets 147,542 133,627 10.4 133,451 10.6 Customer loans 1/ 65,344 61,640 6.0 64,335 1.6 Customer deposits 111,938 105,629 6.0 108,041 3.6 Total assets 176,574 156,040 13.2 159,595 10.6
Per share (in $)
Basic earnings excluding goodwill amortisation 2/ 1.60 1.02 56.9 1.08 48.1 Basic earnings 2/ 1.31 0.72 81.9 0.78 67.9 Diluted earnings 2/ 1.26 0.70 80.0 0.75 68.0 Net asset value at period-end
(i) based on existing ordinary share capital 10.03 9.50 5.6 9.75 2.9 (ii) assuming non-voting convertible preference
shares (“CPS”) and non-voting redeemable CPS
are converted to ordinary shares 9.88 9.34 5.8 9.58 3.1 Net tangible asset value at period-end 3/ 5.16 4.33 19.2 4.73 9.1
Performance ratios
(%)
1st Qtr 2004
1st Qtr 2003
4th Qtr 2003 On a GAAP basis
Return on assets 2/ 1.16 0.71 0.73 Return on equity 2/ 12.89 7.54 7.93
Excluding goodwill amortisation
Return on assets 2/ 1.42 0.99 1.01 Return on equity 2/ 15.80 10.52 10.91 Return on tangible equity 2/ 4/ 30.58 22.47 21.98
Efficiency and revenue mix ratios
Cost-to-income ratio (excluding goodwill
amortisation) 39.7 42.2 45.8
As a percentage of total operating income:
- net interest income 50.1 57.2 59.6 - non-interest income 49.9 42.8 40.4
BIS Capital ratios (at period-end)
- Tier 1 capital 10.7 9.8 10.5
Financial Review
DBSH Group’s net profit attributable to members (“NPAM”) was $488 million for the first quarter 2004, up 80.1% over first quarter 2003 and 67.1% over fourth quarter 2003. The strong performance was driven by growth in operating income combined with a decline in provision charge.
• Operating income was $1.266 billion, up 20.9% over first quarter 2003 and 20.2% over fourth quarter 2003. The increase was due to higher net interest income from a higher volume of interest bearing assets, strong growth in fees and commissions and better trading income.
• Operating expenses rose 13.8% over first quarter 2003 and 4.4% over fourth quarter 2003, to $503 million. The increase occurred mainly in variable staff costs and revenue-related expenses, which rose in tandem with higher business volumes and higher levels of revenue-related activity.
• As operating income growth outpaced the operating expenses increase, Group cost-to-income ratio (excluding goodwill amortisation) improved to 39.7% compared to 42.2% for first quarter 2003 and 45.8% for fourth quarter 2003.
• Provision charge of $50 million was 57.6% lower compared to first quarter 2003, and 39% lower compared to fourth quarter 2003. The lower provision charge reflects improving economic conditions in Singapore and Hong Kong, and further strengthening of the Group’s asset quality.
Profit and Loss Account
In $ millions
1st Qtr 2004
1st Qtr 2003
Change %
4th Qtr 2003
Change %
Net interest income 634 599 5.8 628 1.0 Non-interest income 632 448 41.1 425 48.7
Operating income 1,266 1,047 20.9 1,053 20.2
Operating expenses (503) (442) 13.8 (482) 4.4
Operating profit before goodwill amortisation and
provisions 763 605 26.1 571 33.6
Goodwill amortisation (110) (107) 2.8 (110)
-Operating profit before provisions 653 498 31.1 461 41.6
Provisions (50) (118) (57.6) (82) (39.0)
Operating profit 603 380 58.7 379 59.1
Share of profits less losses of associated and joint venture
companies 18 12 50.0 18
-Net profit before taxation 621 392 58.4 397 56.4
Taxation (120) (108) 11.1 (85) 41.2
Minority interests (13) (13) - (20) (35.0)
Net profit attributable to members 488 271 80.1 292 67.1
DBS Bank (Hong Kong) Limited
Net profit after taxation for DBS Bank (Hong Kong) Limited grew 52% over first quarter 2003 and 3.5% over fourth quarter 2003 to $149 million. The increase was mainly due to higher operating income and lower provision charge.
• Year-on-year (“YoY”), net interest income was 12.1% higher mainly attributable to the wider spread between the Prime rate and HIBOR1/. Gross loans increased HK$4.5 billion or 4.9%. Compared to fourth quarter 2003, net interest income increased 2.4% benefiting from the further widening of the Prime-HIBOR1/ spread and a 2.8% increase in gross loans.
• For both YoY and last quarter comparison, the increase in non-interest income was due to stronger sales of treasury investment products, higher unit trusts and securities fees and loan related fees.
• Operating expenses increased 11.9% YoY, reflecting higher staff costs and advertising and promotion expenses.
• Provision charge decreased 41.5% compared to a year ago, following the rebound in Hong Kong’s economy. Similarly, provision was 4% lower than fourth quarter 2003.
Profit and Loss Account (Based on Hong Kong Generally Accepted Accounting Principles)2/ 3/
In $ millions
1st Qtr 2004
1st Qtr 2003
Change %
4th Qtr 2003
Change %
Net interest income 213 190 12.1 208 2.4 Non-interest income 107 80 33.8 104 2.9
Operating income 320 270 18.5 312 2.6
Operating expenses (122) (109) 11.9 (121) 0.8 Impairment of fixed assets - (1) NM -
-Operating profit before provisions 198 160 23.8 191 3.7
Provisions (24) (41) (41.5) (25) (4.0)
Operating profit 174 119 46.2 166 4.8
Net profit before taxation 176 119 47.9 165 6.7
Net profit after taxation 149 98 52.0 144 3.5
NM: Not meaningful
Notes:
1/ HIBOR: Hong Kong Interbank Offer Rate
2/ The exchange rate used for all comparative periods is HK$1 = S$0.215356.
3/ In the preparation of the consolidated DBSH Group accounts, appropriate adjustments were made to bring DBS Bank (Hong Kong) Limited accounts in line with Singapore Financial Reporting Standards (“FRS”). Under FRS, the contribution from DBS Bank (Hong Kong) Limited was as follows:
In $ millions
1st Qtr 2004
1st Qtr 2003
Change %
4th Qtr 2003
Change %
Net profit before taxation 175 119 47.1 179 (2.2)
Net profit after taxation 148 96 54.2 158 (6.3)
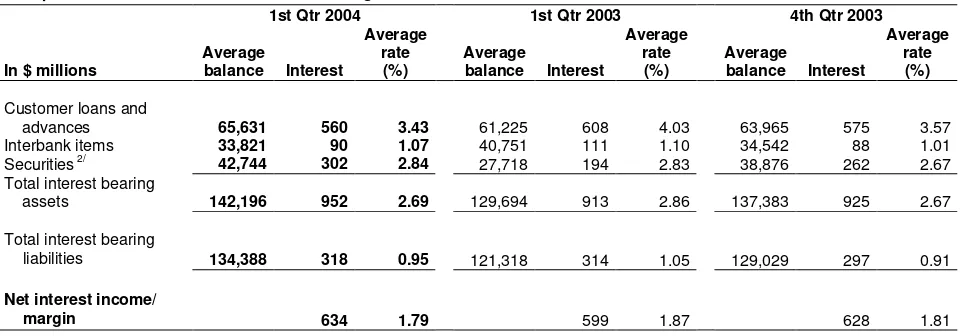
Net Interest Income and Net Interest Margin
Exhibit 1
Group Net Interest Income and Net Interest Margin
2,375
560 588 628 634
599 2,645
2,257
2,039 2,035
2.02
1.871.991.78 1.87
1.68 1.72 1.81 1.79 2.02
0 500 1,000 1,500 2,000 2,500 3,000
1999 2000 2001 2002 2003 1Q03 2Q03 3Q03 4Q03 1Q04
$ m
0 1 2 3 (% )
Net Interest Income Net Interest Margin (% )
Net interest income for first quarter 2004 at $634 million was up 5.8% over first quarter 2003. Compared to fourth quarter 2003, net interest income increased 1%.
• The increase in net interest income resulted from growth in interest bearing assets and efforts in re-balancing the Group’s asset composition by deploying funds away from the lower yielding inter-bank market to higher yielding customer loans and debt securities.
[image:6.595.68.319.105.266.2] [image:6.595.70.550.477.645.2]• Net interest margin was 1.79% for the first quarter 2004, marginally higher than 1.78% for the full year 2003. First quarter 2004 net interest margin compares to 1.87% for the first quarter 2003, and 1.81% for the fourth quarter 2003. The decline in net interest margin was due to the compression of interest spreads on customer loans.
Table 1
Group Net Interest Income and Net Interest Margin 1/
1st Qtr 2004 1st Qtr 2003 4th Qtr 2003
In $ millions
Average
balance Interest
Average rate (%)
Average
balance Interest
Average rate
(%)
Average
balance Interest
Average rate
(%)
Customer loans and
advances 65,631 560 3.43 61,225 608 4.03 63,965 575 3.57
Interbank items 33,821 90 1.07 40,751 111 1.10 34,542 88 1.01
Securities 2/
42,744 302 2.84 27,718 194 2.83 38,876 262 2.67
Total interest bearing
assets 142,196 952 2.69 129,694 913 2.86 137,383 925 2.67
Total interest bearing
liabilities 134,388 318 0.95 121,318 314 1.05 129,029 297 0.91
Net interest income/
margin 634 1.79 599 1.87 628 1.81
Notes:
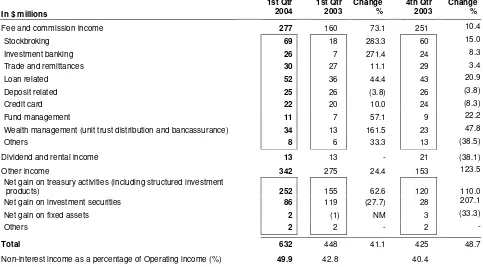
Non-Interest Income
Table 2
Group Non-Interest Income
In $ millions
1st Qtr 2004
1st Qtr 2003
Change %
4th Qtr 2003
Change %
Fee and commission income 277 160 73.1 251 10.4
Stockbroking 69 18 283.3 60 15.0
Investment banking 26 7 271.4 24 8.3
Trade and remittances 30 27 11.1 29 3.4
Loan related 52 36 44.4 43 20.9
Deposit related 25 26 (3.8) 26 (3.8)
Credit card 22 20 10.0 24 (8.3)
Fund management 11 7 57.1 9 22.2
Wealth management (unit trust distribution and bancassurance) 34 13 161.5 23 47.8
Others 8 6 33.3 13 (38.5)
Dividend and rental income 13 13 - 21 (38.1)
Other income 342 275 24.4 153 123.5
Net gain on treasury activities (including structured investment
products) 252 155 62.6 120 110.0
Net gain on investment securities 86 119 (27.7) 28 207.1
Net gain on fixed assets 2 (1) NM 3 (33.3)
Others 2 2 - 2
-Total 632 448 41.1 425 48.7
Non-interest income as a percentage of Operating income (%) 49.9 42.8 40.4
NM: Not meaningful
Non-interest income was $632 million for the first quarter 2004, a 41.1% increase over first quarter 2003, and a 48.7% increase over fourth quarter 2003.
• Fee and commission income was $277 million for first quarter 2004, up 73.1% over first quarter 2003 and 10.4% over fourth quarter 2003. The increase arose from higher stockbroking fees following recoveries in regional equity markets, as well as from strong growth in fees for investment banking, loan syndications, and wealth management sales.
Operating Expenses
Table 3
Group Operating Expenses
In $ millions
1st Qtr 2004
1st Qtr
2003 Change%
4th Qtr
2003 Change%
Staff costs 250 219 14.2 217 15.2
Occupancy expenses 46 48 (4.2) 54 (14.8)
Technology-related expenses 77 71 8.5 74 4.1
Revenue-related expenses 54 33 63.6 53 1.9
Others 76 71 7.0 84 (9.5)
Total 503 442 13.8 482 4.4
Cost-to-income ratio (%) (excluding goodwill amortisation) 39.7 42.2 45.8
Staff headcount number (at period-end) 12,173 12,036 12,144
Excluding goodwill amortisation, year-on-year operating expenses rose 13.8%.
• Staff costs increased 14.2% to $250 million due to higher accruals for performance-related incentive pay to reflect the stronger bottom-line performance. The increase in technology-related expenses was related to investments in new systems, capacity enhancements to meet customer demands and payment of outsourcing fees. Revenue-related expenses, which include commission paid to remisiers and brokerage expenses, increased as a result of higher transaction volumes.
Compared to fourth quarter 2003, operating expenses (excluding goodwill amortisation) rose 4.4%.
• Similar to the year-on-year comparison, operating expenses rose due to higher variable staff costs and revenue-related expenses, which rose in tandem with higher business volumes and higher levels of revenue-related activity. However, the increase was smaller than that for the year-on-year comparison, as the fourth quarter 2003 included higher professional fees for technology-related projects, relocation and advertising expenses.
Provision Charge
Table 4
Group Provision Charge
In $ millions
1st Qtr 2004
1st Qtr 2003
Change %
4th Qtr 2003
Change %
Loans 29 79 (63.3) 78 (62.8)
Singapore 17 18 (5.6) 53 (67.9)
Hong Kong 17 45 (62.2) 24 (29.2)
Other countries (5) 16 NM 1 NM
Securities, properties and
other assets 1 24 (95.8) (7) NM
Specific provision 30 103 (70.9) 71 (57.7)
General provision 20 15 33.3 11 81.8
Total 50 118 (57.6) 82 (39.0)
SP + GP (loans) / Average loan (basis point) 25 56 52
NM: Not meaningful
Provision charge was $50 million for first quarter 2004, 57.6% lower than first quarter 2003.
• Specific provision for loans losses fell 63.3% to $29 million due to an improvement in the overall credit quality of the portfolios and an increase in loan recoveries, reflecting the improving economic conditions in Singapore and Hong Kong.
• Specific provision for investment securities and other assets declined 95.8%, as a lower provision charge was required following improving asset valuations.
[image:8.595.73.552.467.610.2]Balance Sheet
Table 5
Group Key Balance Sheet Items
In $ millions Mar 31, 2004 Dec 31, 2003 Mar 31, 2003
Total assets 176,574 159,595 156,040
Customer loans 1/ 65,344 64,335 61,640
Customer deposits 111,938 108,041 105,629
Loan-to-deposit ratio (%) 58.4 59.5 58.4
Loan and non-trading debt securities-to-deposit ratio (%) 78.4 79.7 72.3
Note:
1/ After deducting cumulative provisions.
At the end of March 2004, total assets were $176.6 billion.
• Compared to end December 2003, customer loans increased 1.6% to $65.3 billion despite a highly competitive environment. The increase in loans was mainly accounted for by loans granted to the “housing”, “manufacturing” and “general commerce” sectors. Customer deposits increased 3.6% to $111.9 billion.
• The Group’s loan-to-deposit ratio at the end of March 2004 was 58.4%. Including DBSH Group’s portfolio of non-trading debt securities, the ratio of loan and non-trading debt securities to deposits was 78.4%.
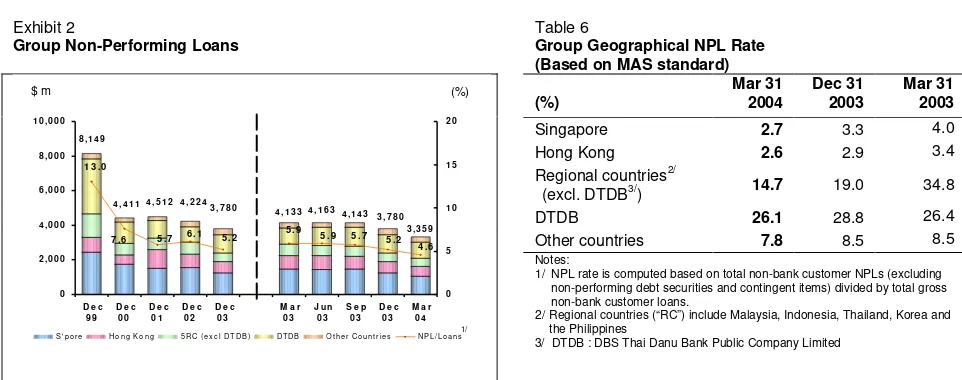
Asset Quality
Exhibit 2
Group Non-Performing Loans
Table 6
Group Geographical NPL Rate (Based on MAS standard)
(%) Mar 31 2004 Dec 31 2003 Mar 31 2003
Singapore 2.7 3.3 4.0
Hong Kong 2.6 2.9 3.4
Regional countries2/
(excl. DTDB3/) 14.7 19.0 34.8
DTDB 26.1 28.8 26.4
Other countries 7.8 8.5 8.5
4 , 5 1 2 4 , 4 1 1 8 , 1 4 9
3 , 7 8 0
4 , 1 3 3 4 , 1 6 3 4 , 1 4 3 3 , 7 8 0 3 , 3 5 9 4 , 2 2 4
6 . 1 5 . 9 5 .9
5 .7 7 .6 1 3 .0
5 .2 5 .7 5 . 2
4 . 6
0 2 , 0 0 0 4 , 0 0 0 6 , 0 0 0 8 , 0 0 0 1 0 , 0 0 0
D e c 9 9
D e c 0 0
D e c 0 1
D e c 0 2
D e c 0 3
M a r 0 3
J u n 0 3
S e p 0 3
D e c 0 3
M a r 0 4 0 5 1 0 1 5 2 0
S ' p o r e H o n g K o n g 5 R C ( e x c l D T D B ) D T D B O t h e r C o u n t r i e s N P L / L o a n s
Notes:
1/ NPL rate is computed based on total non-bank customer NPLs (excluding non-performing debt securities and contingent items) divided by total gross non-bank customer loans.
2/ Regional countries (“RC”) include Malaysia, Indonesia, Thailand, Korea and the Philippines
3/ DTDB : DBS Thai Danu Bank Public Company Limited
• The volume of non-performing loans (“NPLs”) declined 11.1% to $3.4 billion at the end of March 2004. Of the total NPLs of $3.4 billion, Thailand and Singapore NPLs accounted for 34% and 32% respectively. Approximately $1.25 billion of restructured NPLs (or 37.2% of all NPLs) continues to be included in the total volume of NPLs.
• The ratio of NPLs to the total non-bank loans (“NPL rate”) further improved from 5.2% at the end of December 2003 to 4.6% at the end of March2004. The NPL rates for Singapore, Hong Kong and regional countries operations (excluding DTDB) improved to 2.7%, 2.6% and 14.7% respectively, at the end of March 2004 due to a reduction in non-bank NPLs and a higher loan base.
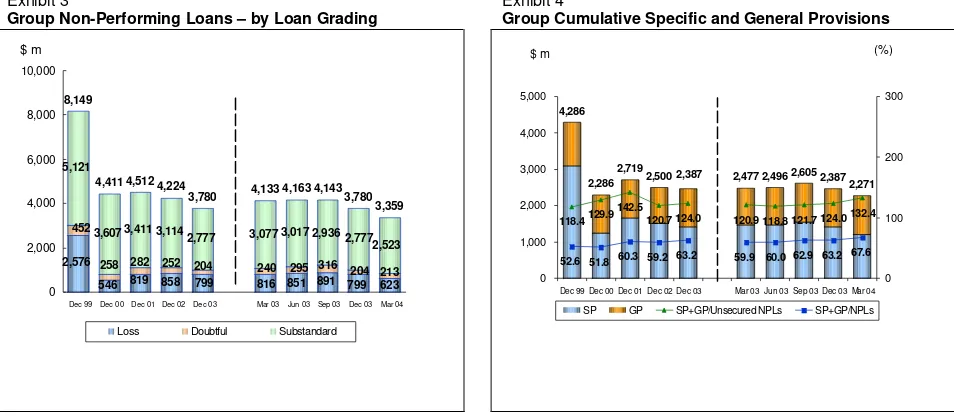
Loan Grading
Of the total $3.4 billion NPLs as at the end of March 2004, 75% were classified as substandard, 6% as doubtful and the remaining 19% in the loss category. 49% of the NPLs were secured by collateral.
Cumulative Specific and General Provisions
Total cumulative specific and general provisions at the end of March 2004 was 132.4% of unsecured NPLs, and 67.6% of total NPLs.
Exhibit 3
Group Non-Performing Loans – by Loan Grading
Exhibit 4
Group Cumulative Specific and General Provisions
2,271 2,6052,387 4,286
2,286 2,719
2,500 2,387 2,477 2,496
118.4129.9 142.5
120.7 124.0 120.9 118.8 121.7 124.0132.4
52.6 51.8 60.3 59.2 63.2 59.9 60.0 62.9 63.2 67.6
0 1,000 2,000 3,000 4,000 5,000
Dec 99 Dec 00 Dec 01 Dec 02 Dec 03 Mar 03 Jun 03 Sep 03 Dec 03 Mar 04
0 100 200 300
SP GP SP+GP/Unsecured NPLs SP+GP/NPLs
$ m
2,576 282 5,121
3,607 3,411 3,114 2,777 3,077 3,017
2,523
546 819 858 799 816 851 891 799204 623213 452
258 252 204 240 295 316 2,936 2,777
3,359 4,143 4,163 4,133 3,780 4,224 4,512 4,411 8,149
3,780
0 2,000 4,000 6,000 8,000 10,000
Dec 99 Dec 00 Dec 01 Dec 02 Dec 03 Mar 03 Jun 03 Sep 03 Dec 03 Mar 04
Loss Doubtful Substandard
[image:10.595.74.551.196.406.2]Restructured Loans
Table 7
Loans that were restructured and classified
Mar 31, 2004 Dec 31, 2003 Mar 31, 2003
In $ millions NPLs
Specific
provisions NPLs
Specific
provisions NPLs
Specific provisions
Substandard 991 116 1,094 125 1,310 172
Doubtful 70 54 70 54 89 47
Loss 188 188 245 243 306 294
Total 1,249 358 1,409 422 1,705 513
Table 8
Group Customer Deposits
In $ millions
Mar 31 2004
Dec 31 2003
Mar 31 2003
Analysed by Currency
Singapore dollar 61,254 56,641 56,081
US dollar 21,909 23,309 20,309
Hong Kong dollar 17,150 17,241 18,983
Thai Baht 3,382 3,539 3,625
Others 8,243 7,311 6,631
Total 111,938 108,041 105,629
Analysed by Product
Savings accounts (include S$ autosave) 49,361 48,028 44,179
Current accounts 12,890 10,486 9,626
Fixed deposits 44,403 45,130 48,442
Other deposits 5,284 4,397 3,382
Total 111,938 108,041 105,629
Table 9
Group Customer Loans
In $ millions
Mar 31 2004
Dec 31 2003
Mar 31 2003
Gross 67,298 66,414 63,801
Less:
Specific provisions 1,019 1,151 1,258
General provisions 935 928 903
Net total 65,344 64,335 61,640
Industry Breakdown
Manufacturing 6,912 6,434 6,082
Building & Construction 7,395 7,682 8,064
Housing Loans 22,888 22,289 21,798
General Commerce 7,069 6,634 5,879
Transportation, Storage & Communications 5,090 4,821 4,784
Financial Institutions, Investment & Holding Companies 5,317 5,559 4,504
Professionals & Private Individuals (except Housing Loans) 7,305 7,393 7,373
Others 5,322 5,602 5,317
Total (Gross) 67,298 66,414 63,801
Analysed by Currency and Fixed / Variable Rates
Fixed rate 1/
Singapore dollar 8,961 8,867 8,315
Hong Kong dollar 353 262 440
US dollar 1 4
-Thai Baht 930 945 624
Others 85 96 11
Sub-total 10,330 10,174 9,390
Variable rate 2/
Singapore dollar 20,935 21,026 20,990
Hong Kong dollar 20,216 20,089 20,632
US dollar 9,147 8,658 8,232
Thai Baht 2,354 2,393 2,511
Others 4,316 4,074 2,046
Sub-total 56,968 56,240 54,411
Total (Gross) 67,298 66,414 63,801
Notes:
Capital Adequacy Ratio
Exhibit 5
[image:12.595.71.547.105.347.2]Group Capital Adequacy Ratio
Table 10 Group Capital
In $ millions
Mar 31 2004
Dec 31 2003
Mar 31 2003 Tier I Capital
Paid ordinary/preference
shares 1,557 1,556 1,555
Disclosed reserves/others 15,939 15,439 15,054
Goodwill (7,261) (7,371) (7,718)
10,235 9,624 8,891
Tier II Capital
Asset revaluation reserves 208 209 99
Cumulative general
provisions 785 768 688
Subordinated debts 3,486 3,531 3,694
Deductions against capital (245) (247) (234)
4,234 4,261 4,247
Total Capital 14,469 13,885 13,138
9.7 10.5 10.5 10.7
4.5 4.7 4.6 4.5
15.7 14.4
10.5 10.3 12.2
9.8
4.5 5.2
5.2 4.6
3.5
4.7
15.2 19.2 18.9
17.4
15.5 15.1 14.5 14.2 15.2 15.1
0 5 10 15 20 25
Dec 99 Dec 00 Dec 01 Dec 02 Dec 03 Mar 03 Jun 03 Sep 03 Dec 03 Mar 04
Tier I Tier II
Risk Weighted Assets 95,490 92,067 90,836
Note:
1/ Compared to end December 2001, the reduction in the Tier I CAR ratio was primarily due to the deduction of additional goodwill with DBS' purchase of the DBS Diamond Holdings Limited minority interest.
At end of March 2004, the total Capital Adequacy Ratio (“CAR”) for the DBSH Group, measured according to the Bank for International Settlements guidelines was 15.2%, of which Tier I CAR was 10.7%.
Unrealised Valuation Surpluses
Table 11
Group Unrealised Valuation Surpluses
In $ millions
Mar 31 2004
Dec 31 2003
Mar 31 2003
Properties 438 424 483
Quoted investments 672 436 358
Total 1,110 860 841
Unrealised valuation surpluses in properties and quoted investment securities not recognised in the accounts amounted to $1.11 billion at the end of March 2004.
(%)
[image:12.595.73.554.462.527.2]Geographical Segment Analysis
[image:13.595.71.556.163.448.2]The following table analyses total assets, operating income and NPAM by geographical segments. Unless otherwise stated, the analysis of geographical segments is generally based on the location of the office recording the transactions.
Table 12
Group Geographical Segments
In $ millions
Total
assets Distribution
(%)
Operating
income Distribution
(%)
Net profit attributable
to members Distribution
(%) Mar 31, 2004
Singapore 1/
112,282 66 809 64 407 68
Hong Kong 40,646 24 351 28 152 26
Regional countries 1/
7,761 5 77 6 25 4
Rest of the world 8,624 5 29 2 14 2
Sub-total 169,313 100 1,266 100 598 100
Goodwill 7,261 - (110)
Total 176,574 1,266 488
Dec 31, 2003
Singapore 1/ 97,655 64 2,496 60 850 58
Hong Kong 39,101 26 1,335 32 486 33
Regional countries 1/
6,813 4 271 6 81 6
Rest of the world 8,655 6 96 2 38 3
Sub-total 152,224 100 4,198 100 1,455 100
Goodwill 7,371 - (430)
Total 159,595 4,198 1,025
Mar 31, 2003
Singapore 1/
97,287 66 664 63 253 67
Hong Kong 39,370 26 311 30 100 26
Regional countries 1/ 5,938 4 52 5 15 4
Rest of the world 5,846 4 20 2 10 3
Sub-total 148,441 100 1,047 100 378 100
Goodwill 7,599 - (107)
Total 156,040 1,047 271 100
Note:
1/ Special general provisions for regional exposures and additional provisions for DTDB's loans are booked in Singapore. DBSH Group operates in four main geographical areas :
• “Singapore”,which includes the operations of the Asian Currency Unit.
• “Hong Kong”, which includes branch and subsidiary operations in Hong Kong.
• “Regional countries”, which includes branch and subsidiary operations in Malaysia, Indonesia, Thailand, Korea and the Philippines.
• “Rest of the world”, which are mainly branch operations in China, India, Taiwan, United States and United Kingdom.
Business Segment Analysis
The business segment results represent the customer segments of the respective businesses and are determined by:
• Income and direct expenses attributable to each customer and other segment; and
• Management accounting policies relating to the allocation of indirect expenses and funds transfer pricing between the central treasury unit and the customer/other segments.
The various customer segments are described below, along with a description of the change in net profit after taxation for first quarter 2004 over first quarter 2003.
• Consumer Banking
Consumer Banking focuses on providing products and services to individual customers. The products and services offered to customers include credit facilities (mortgage, personal loans, etc.), credit cards, deposit collection, remittance services and asset management products.
The increase in net profit after taxation ($46 million, 62.2%) was largely due to higher interest income and fee income from cards and sales of investment products.
• Enterprise Banking
Enterprise Banking focuses on providing products and services to small and medium enterprises. The products and services offered to customers include credit facilities (overdraft, factoring/accounts receivable purchase, trade financing, commercial/industrial property financing, hire purchase and government financing and assistance schemes), deposit, payment and collection services and treasury products.
The increase in net profit after taxation ($17 million, 27.9%) was mainly attributable to higher interest income resulting from increased volumes, fee income from treasury product sales, loan and trade related activities, capital markets and transactional activities.
• Investment Banking
Investment Banking caters to the business needs of large corporate customers and financial institutions. The products and services offered to customers include direct lending, advisory banking services, bond issuance, equity financing, syndicated financing, mergers and acquisitions advisory services, debt restructuring advisory services, private equity, nominee and trustee services and cash management services.
The increase in net profit after taxation ($46 million, 75.4%) was due to higher fee income from capital markets activities and lower provisions.
• Treasury and Markets
Treasury and Markets is primarily involved in market making, structuring and trading of financial products including foreign exchange, securities and interest rate/ credit/ equity/ foreign exchange derivatives. Income from treasury products and services relating to customers of other segments is reflected in the respective customer segments.
Net profit after taxation is in line with first quarter 2003.
The other segments of the analysis are:
• Funding Portfolio
The Funding Portfolio managed by Treasury and Markets is the net aggregate of the Group’s interest earning assets and interest bearing liabilities. The income generated from this portfolio is predominantly interest in nature.
• Central Operations
Central Operations encompasses a range of activities resulting from central corporate decisions and the related income and expenses not attributed to business segments. These include the central treasury unit, funding costs of DBSH Group’s associated and subsidiary companies and gains/losses on properties as well as certain subsidiaries including stock brokerage and asset management.
[image:15.595.72.550.184.633.2]The following table analyses the results, total assets and total liabilities by business segments:
Table 13
Group Business Segments (1st Qtr 2004)
In $ millions
Consumer Banking
Enterprise Banking
Investment Banking
Treasury and Markets1/
Funding Portfolio1/
Central
Operations Total
Operating income 384 182 176 202 131 191 1,266
Operating profit before provisions, taxation and
goodwill amortisation 177 122 118 163 106 77 763
Net profit before taxation and goodwill amortisation 149 94 127 163 110 88 731
Taxation (28) (18) (20) (22) (15) (17) (120)
Net profit after taxation and before goodwill
amortisation 120 78 107 140 95 58 598
Goodwill amortisation (110)
Net profit attributable to members 488
Other Information
Total assets before goodwill 27,520 14,534 29,512 26,947 41,091 29,709 169,313
Goodwill 7,261
Total assets 176,574
Total liabilities 65,933 14,063 16,808 17,616 21,317 24,316 160,053
Capital expenditure 4 2 1 2 2 4 15
Depreciation 9 5 1 4 3 22 44
Group Business Segments (1st Qtr 2003)
In $ millions
Consumer Banking
Enterprise Banking
Investment Banking
Treasury and Markets1/
Funding Portfolio1/
Central
Operations Total
Operating income 340 149 142 203 102 111 1,047
Operating profit before provisions, taxation and
goodwill amortisation 126 95 94 162 81 47 605
Net profit before taxation and goodwill amortisation 92 76 72 162 85 12 499
Taxation (18) (15) (11) (23) (11) (30) (108)
Net profit after taxation and before goodwill
amortisation 74 61 61 137 73 (28) 378
Goodwill amortisation (107)
Net profit attributable to members 271
Other Information
Total assets before goodwill 27,360 13,820 23,816 13,953 42,656 26,836 148,441
Goodwill 7,599
Total assets 156,040
Total liabilities 66,419 14,196 13,709 10,405 11,918 23,587 140,234
Capital expenditure 4 1 - 1 1 6 13
Depreciation 11 4 1 5 2 22 45
Note:
Dividend
Dividends are declared semi-annually by the Board following the financial results announcement for the half year and full year. No dividend has been declared for the first quarter ended March 31, 2004.
Subsequent Event
On April 6, 2004, DBS Bank announced it has entered into an agreement to sell its entire 10% equity interest in Wing Lung Bank Limited to Wu Jieh Yee Company Limited. Under the agreement, DBS Bank will sell 23,219,010 ordinary shares at HK$53 per share for a total consideration of HK$1.231 billion (S$265 million). The sale and purchase is subject to regulatory approvals. Upon completion of the sale and purchase, DBS Bank is expected to recognise a gain of approximately S$185 million.
Comparatives
DBS GROUP HOLDINGS LTD AND ITS SUBSIDIARY COMPANIES
Unaudited Consolidated Profit and Loss Account
In $ millions
1st Qtr 2004
1st Qtr 2003
Change %
4th Qtr 2003
Change %
Interest income 952 913 4.3 925 2.9 Less: Interest expense 318 314 1.3 297 7.1 Net interest income 634 599 5.8 628 1.0
Fee and commission income 277 160 73.1 251 10.4
Dividends 5 4 25.0 10 (50.0)
Rental income 8 9 (11.1) 11 (27.3) Other income 342 275 24.4 153 123.5
Operating income 1,266 1,047 20.9 1,053 20.2
Less: Staff costs 250 219 14.2 217 15.2 Depreciation 44 45 (2.2) 40 10.0 Other operating expenses 209 178 17.4 225 (7.1) Goodwill amortisation 110 107 2.8 110
-Operating expenses 613 549 11.7 592 3.5
Operating profit before provisions 653 498 31.1 461 41.6
Less: Provision for possible loan losses and
diminution in value of other assets 50 118 (57.6) 82 (39.0)
Operating profit 603 380 58.7 379 59.1
Add: Share of profits less losses of associated and
joint venture companies 18 12 50.0 18
-Net profit before taxation 621 392 58.4 397 56.4
Less: Taxation 116 107 8.4 80 45.0 Share of taxation of associated and joint
venture companies 4 1 300.0 5 (20.0)
Net profit after taxation 501 284 76.4 312 60.6
Less: Minority interests 13 13 - 20 (35.0)
DBS GROUP HOLDINGS LTD AND ITS SUBSIDIARY COMPANIES
Unaudited Consolidated Balance Sheet as at
Mar 31 Dec 31 Mar 31 In $ millions 2004 2003 2003
SHARE CAPITAL
Share capital 1,557 1,556 1,555
RESERVES
Share premium account 2,178 2,171 2,166 Other reserve 4,271 4,271 4,271 Capital redemption reserve 28 28 28
Capital reserve (39) (30) (4)
General reserve 2,230 2,230 2,044 Revenue reserve 5,158 4,670 4,466
13,826 13,340 12,971
SHAREHOLDERS' FUNDS 15,383 14,896 14,526
MINORITY INTERESTS 1,138 1,125 1,280
LIABILITIES
Deposits and balances of banks 14,062 7,497 7,625 Deposits and other accounts of
non-bank customers 111,938 108,041 105,629
Bills payable 738 363 413
Current taxation 605 500 498
Deferred tax liabilities 94 104 124 Other liabilities 20,904 15,772 14,849 Other borrowings and debt
securities in issue 1/ 6,089 5,604 5,223 - due within one year 2,051 1,882 2,123 - due after one year 4,038 3,722 3,100
Subordinated term debts
(unsecured) 5,623 5,693 5,873 - due within one year 25 25 24 - due after one year 5,598 5,668 5,849
TOTAL LIABILITIES AND
SHAREHOLDERS’ FUNDS 176,574 159,595 156,040
OFF BALANCE SHEET ITEMS
Contingent liabilities 7,296 6,984 6,844 Commitments 68,612 60,173 60,832 Financial derivatives 1,413,541 1,256,240 1,233,989
Note:
1/ Includes secured amount of $1,385 million as at March 31, 2004 (December 31, 2003: $1,106 million; March 31, 2003: $1,538 million). These are mainly secured by properties and securities.
Mar 31 Dec 31 Mar 31 In $ millions 2004 2003 2003
ASSETS
Cash, and balances and
placements with central banks 11,987 5,007 4,313 Singapore Government securities
and treasury bills 13,192 11,438 9,837 Trading securities 11,142 6,433 4,987 Balances, placements with, and
loans and advances to banks 26,977 27,472 38,609 Bills receivable from non-bank
customers 2,185 1,481 1,505
Loans and advances to non-bank
customers 63,159 62,854 60,135 Investment securities 23,711 22,828 15,592 Associated and joint venture
companies 543 547 529
Goodwill 7,261 7,371 7,599
Fixed assets 1,958 2,016 2,211
Deferred tax assets 119 129 111 Other assets 14,340 12,019 10,612
DBS GROUP HOLDINGS LTD AND ITS SUBSIDIARY COMPANIES
Unaudited Balance Sheet of DBS Group Holdings Ltd as at
Mar 31 Dec 31 Mar 31 In $ millions 2004 2003 2003
SHARE CAPITAL
Share capital 1,557 1,556 1,555
RESERVES
Share premium account 2,178 2,171 2,166 Capital redemption reserve 28 28 28 Revenue reserve 3,001 3,001 3,201
5,207 5,200 5,395
SHAREHOLDERS' FUNDS 6,764 6,756 6,950
LIABILITIES
Current liabilities 9 9 4
Deferred tax liabilities # # #
TOTAL LIABILITIES AND
SHAREHOLDERS’ FUNDS 6,773 6,765 6,954
Other Information
Net asset value per ordinary share ($) (i) Based on existing ordinary share
capital 4.49 4.53 4.67
4.34 4.34 4.47 (ii) Assuming non-voting convertible
preference shares (“CPS”) and non-voting redeemable CPS are converted to ordinary shares
Note:
1/ #: Insignificant
Mar 31 Dec 31 Mar 31 In $ millions 2004 2003 2003
ASSETS
Trading securities - - #
Balances, placements with, and loans and
advances to non-bank customers 3 3 3 Investment in subsidiary companies 6,770 6,762 6,951
DBS GROUP HOLDINGS LTD AND ITS SUBSIDIARY COMPANIES
Unaudited Consolidated Statement of Changes in Shareholders' Equity
In $ millions
Share Capital
Share Premium
Other Reserve
Capital Redemption Reserve
Capital Reserve
General Reserve
Revenue Reserve
Total Reserves
Balance at January 1, 2004 1,556 2,171 4,271 28 (30) 2,230 4,670 13,340
Exercise of share options pursuant to the DBSH
Share Option Plan 1 7 - - - - - 7
Net exchange translation adjustments during the
period - - - - (9) - - (9)
Net profit attributable to members - - - - - - 488 488
Balance at March 31, 2004 1,5572/ 2,178 4,271 28 (39) 2,230 5,158 13,826
Balance at January 1, 2003 1,555 2,163 4,271 28 (19) 2,044 4,195 12,682
Exercise of share options pursuant to the DBSH
Share Option Scheme/DBSH Share Option Plan # 3 - - - 3
Net exchange translation adjustments during the
period - - - - 15 # - 15
Net profit attributable to members - - - 271 271
Balance at March 31, 2003 1,555 2,166 4,271 28 (4) 2,044 4,466 12,971
Unaudited Statement of Changes in Shareholders' Equity of DBS Group Holdings Ltd
In $ millions Share Capital
Share Premium
Capital Redemption Reserve
Revenue Reserve
Total Reserves
Balance at January 1, 2004 1,556 2,171 28 3,001 5,200
Exercise of share options pursuant to the DBSH Share Option Plan 1 7 - - 7
Net profit after taxation - - - # #
Balance at March 31, 2004 1,5572/ 2,178 28 3,001 5,207
Balance at January 1, 2003 1,555 2,163 28 3,201 5,392
Exercise of share options pursuant to the DBSH Share Option
Scheme/DBSH Share Option Plan # 3 - - 3
Net profit after taxation - - - # #
Balance at March 31, 2003 1,555 2,166 28 3,201 5,395
Notes:
1/ #: Insignificant
DBS GROUP HOLDINGS LTD AND ITS SUBSIDIARY COMPANIES
Unaudited Consolidated Cash Flow Statement
In $ millions
1st Qtr 2004
1st Qtr 2003
Cash flows from operating activities
Net profit before taxation 621 392
Adjustments for non-cash items:
Provision for possible loan losses and diminution in value of other assets 50 118
Depreciation of fixed assets 44 45
Goodwill amortisation 110 107
Share of profits of associated and joint venture companies (18) (12)
Net (gain)/loss on disposal of fixed assets (2) 1
Net gain on disposal of investment securities (86) (119)
Operating profit before changes in operating assets & liabilities 719 532
Increase/(Decrease) in:
Deposits and other accounts of non-bank customers 3,897 4,314
Deposits and balances of banks 6,565 2,748
Other liabilities including bills payable 5,475 (1,152)
(Increase)/Decrease in:
Singapore Government securities and treasury bills (1,754) (820)
Trading securities (4,709) (1,315)
Accounts receivable and other assets (2,062) (854)
Balances, placements with, and loans and advances to other banks 493 158
Loans and advances to non-bank customers including bills receivable (1,041) (1,008)
Net cash generated from operating activities (1) 7,583 2,603
Cash flows from investing activities
Dividends from associated companies 9 10
Purchase of fixed assets (15) (13)
Net increase in investment securities (1,033) (885)
Proceeds from disposal of fixed assets 22 8
Net cash used in investing activities (2) (1,017) (880)
Cash flows from financing activities Increase/(Decrease) in:
Share capital and share premium 8 3
Debt securities and borrowings 415 398
Dividends paid - (13)
Net cash generated from financing activities (3) 423 388
Exchange translation adjustments (4) (9) 15
Net change in cash, and balances and placements with central banks (1)+(2)+(3)+(4) 6,980 2,126
Cash, and balances and placements with central banks as at January 1 5,007 2,187
DBS GROUP HOLDINGS LTD AND ITS SUBSIDIARY COMPANIES
Selected Notes to the Accounts
1. Issuance of Ordinary Shares
There were 1,469,965,595 issued and fully paid-up ordinary shares as at December 31, 2003. During the first quarter 2004, 20,207,769 ordinary shares were issued upon the conversion of non-voting convertible preference shares and the exercise of executive share options, bringing the total outstanding number of ordinary shares to 1,490,173,364 as at March 31, 2004. The weighted average number of ordinary shares was 1,480,464,986 for the first quarter 2004.
Details of issue of new ordinary shares of $1.00 each are as follows:
Particulars
Number of new ordinary shares issued between
January 1, 2004 and March 31, 2004
Number of new ordinary shares that would have been issued upon the conversion/exercise of all outstanding non-voting convertible preference
shares (“CPS”)/ non-voting redeemable CPS/executive share options
Mar 31, 2004 Dec 31, 2003 Mar 31, 2003
Conversion of non-voting CPS 19,475,169 120,436 19,595,605 19,608,841 Conversion of non-voting redeemable CPS - 66,475,374 66,475,374 66,475,374 Exercise of executive share options 732,600 52,018,883 46,155,436 48,829,959
2.
Earnings Per Ordinary Share
Basic earnings per ordinary share is calculated by dividing the DBSH Group’s net profit attributable to members and after preference dividends by the weighted average number of ordinary shares in issue during the period.
DBSH Group
In millions 1st Qtr 2004 1st Qtr 2003
Weighted average number of ordinary shares in issue (a) 1,480 1,469
DBSH Group
In $ millions 1st Qtr 2004 1st Qtr 2003
Net profit attributable to members (annualised) 1,951 1,084 Less: Preference dividends (annualised) 16 20 Net profit attributable to members after adjustment of preference dividends (b) 1,935 1,064 Add: Goodwill amortisation (annualised) 441 429
Net profit attributable to members after adjustment of preference dividends
and goodwill amortisation (c) 2,376 1,493 Basic Earnings Per Ordinary Share (Cents) (b)/(a) 131 72 Basic Earnings Per Ordinary Share (excluding goodwill amortisation) (Cents)
DBS GROUP HOLDINGS LTD AND ITS SUBSIDIARY COMPANIES
2. Earnings Per Ordinary Share (Continued)
For the purpose of calculating the diluted earnings per ordinary share, the weighted average number of ordinary shares in issue is adjusted to take into account the dilutive effect arising from the full conversion of DBSH non-voting CPS and DBSH non-voting redeemable CPS to ordinary shares. In addition, where applicable, the calculation would take into account the exercise of all outstanding share options granted to employees where such shares would be issued at a price lower than fair value (average share price during the period).
The effect of the exercise of DBSH share options and conversion of DBSH non-voting CPS and DBSH non-voting redeemable CPS on the weighted average number of ordinary shares in issue is as follows:
DBSH Group
In millions 1st Qtr 2004 1st Qtr 2003
Weighted average number of ordinary shares in issue 1,480 1,469
Dilutive effect of share options 1 #
Full conversion of DBSH non-voting CPS # 20 Full conversion of DBSH non-voting redeemable CPS 66 66 Weighted average number of ordinary shares in issue assuming dilution (a) 1,547 1,555
The effect of the exercise of DBSH share options and conversion of DBSH non-voting CPS and DBSH non-voting redeemable CPS on DBSH Group’s net profit attributable to members is as follows:
DBSH Group
In $ millions 1st Qtr 2004 1st Qtr 2003
Net profit attributable to members (annualised) 1,951 1,084 Less: Preference dividends (annualised) 16 20
Net profit attributable to members after adjustment of preference dividends 1,935 1,064
Adjustment to net profit arising from:
(i) Full conversion of DBSH non-voting CPS # 5 (ii) Full conversion of DBSH non-voting redeemable CPS 16 15 Adjusted net profit attributable to members (b) 1,951 1,084
Add: Goodwill amortisation (annualised) 441 429 Adjusted net profit attributable to members (excluding goodwill amortisation) (c) 2,392 1,513 Diluted Earnings Per Ordinary Share (Cents) (b)/(a) 126 70 Diluted Earnings Per Ordinary Share (excluding goodwill amortisation) (Cents)
(c)/(a) 154 97
Note:
DBS GROUP HOLDINGS LTD AND ITS SUBSIDIARY COMPANIES
3
.
Loan and Investment Exposures to Malaysia, Indonesia, Thailand, Korea, The
Philippines (Regional Countries), Hong Kong and China
At March 31, 2004, DBSH Group has exposures to certain countries in the Asia Pacific Region. The exposures are determined based on the location of the credit risk of the customers and counter-parties regardless of where the transactions are booked.
The DBSH Group’s exposures (assets and non-performing loans) to the Regional Countries, Hong Kong and China at March 31, 2004 are as follows:
Loans and debt securities Net Exposure
In $ millions
Assets in Bank
Central Banks &
Govt. Securities
Non-Bank 1/
Investments
Less: Intercompany
Loans/ Investments in
Financial Subsidiaries/
Overseas
Branches Amount
As a % of Total
Assets NPLs2/
(a) (b) (c) (d) (e) (f)=(a+b (g)
+c+d-e)
Total Regional Countries 4,885 1,585 6,909 933 1,762 12,550 7.1% 1,386
Malaysia 1,154 35 1,362 88 1,015 1,624 0.9% 212
Indonesia 223 181 524 71 202 797 0.4% 36
Thailand (excluding DTDB) 265 17 143 63 217 271 0.2% 186
Korea 3,185 834 1,294 2 327 4,988 2.8%
-The Philippines 43 184 96 561 1 883 0.5% 5
DTDB 3/ 15 334 3,490 148 - 3,987 2.3% 947
Hong Kong 3,742 3,006 23,668 11,796 13,724 28,488 16.1% 584
China 1,202 32 991 56 502 1,779 1.0% 118
TOTAL 9,829 4,623 31,568 12,785 15,988 42,817 24.2% 2,088
The DBSH Group’s exposures (assets and non-performing loans) to the Regional Countries, Hong Kong and China at December 31, 2003 are as follows:
Loans and debt securities Net Exposure
In $ millions
Assets in Bank
Central Banks &
Govt. Securities
Non-Bank 1/ Investments
Less: Intercompany
Loans/ Investments in
Financial Subsidiaries/
Overseas
Branches Amount
As a % of Total
Assets NPLs2/
(a) (b) (c) (d) (e) (f)=(a+b (g)
+c+d-e)
Total Regional Countries 5,016 1,104 6,395 955 1,954 11,516 7.3% 1,545
Malaysia 1,280 13 1,356 90 1,034 1,705 1.1% 233
Indonesia 126 56 365 73 128 492 0.3% 55
Thailand (excluding DTDB) 231 9 221 63 214 310 0.2% 188
Korea 3,326 531 885 1 577 4,166 2.6% 17
The Philippines 46 149 103 604 1 901 0.6% 8
DTDB 3/ 7 346 3,465 124 - 3,942 2.5% 1,044
Hong Kong 2,457 2,013 23,235 11,935 13,238 26,402 16.5% 643
China 965 24 692 21 393 1,309 0.8% 130
TOTAL 8,438 3,141 30,322 12,911 15,585 39,227 24.6% 2,318
DBS GROUP HOLDINGS LTD AND ITS SUBSIDIARY COMPANIES
3.
Loan and Investment Exposures to Malaysia, Indonesia, Thailand, Korea, The
Philippines (Regional Countries), Hong Kong and China (Continued)
The DBSH Group’s exposures (assets and non-performing loans) to the Regional Countries, Hong Kong and China at March 31, 2003 are as follows:
Loans and debt securities Net Exposure
In $ millions
Assets in Bank
Central Banks &
Govt. Securities
Non-Bank 1/
Investments
Less: Intercompany
Loans/ Investments in
Financial Subsidiaries/
Overseas
Branches Amount
As a % of Total
Assets NPLs 2/
(a) (b) (c) (d) (e) (f)=(a+b (g)
+c+d-e)
Total Regional Countries 4,074 1,128 5,152 829 1,578 9,605 6.1% 1,557
Malaysia 823 4 737 91 651 1,004 0.6% 290
Indonesia 152 119 240 73 112 472 0.3% 98
Thailand (excluding DTDB) 61 15 204 74 107 247 0.2% 195
Korea 2,926 625 480 12 703 3,340 2.1% 17
The Philippines 37 40 158 485 5 715 0.5% 38
DTDB 3/ 75 325 3,333 94 - 3,827 2.4% 919
Hong Kong 1,108 2,140 22,890 13,713 13,994 25,857 16.6% 780
China 993 13 704 - 344 1,366 0.9% 153
TOTAL 6,175 3,281 28,746 14,542 15,916 36,828 23.6% 2,490
Notes:
1/ Non-bank loans include loans to government and quasi-government entities.
DBS GROUP HOLDINGS LTD AND ITS SUBSIDIARY COMPANIES
4. Non-Performing Loans and Provisions
At March 31, 2004, DBSH Group’s total non-performing loans (“NPLs”) amounted to $3.359 billion. Out of the total NPLs of $3.359 billion, $1.644 billion (49%) were secured by collateral.
Details of DBSH Group’s NPLs and provisions at March 31, 2004 are as follows:
Regional Countries
In $ millions Singapore
Hong
Kong DTDB 1/ Others
Other
Countries Total
Non-Performing Loans 1,060 584 947 439 329 3,359
- Substandard 766 432 761 302 262 2,523
- Doubtful 68 37 22 46 40 213
- Loss 226 115 164 91 27 623
NPLs as a % of Group total assets 0.6% 0.3% 0.5% 0.3% 0.2% 1.9%
Non-bank NPLs as a % of non-bank loans
in the respective countries 2/ 2.7% 2.6% 26.1% 14.7% 7.8% 4.6%
Total Cumulative Provisions 765 413 541 383 169 2,271
- Specific provisions 388 180 359 184 88 1,199 - General provisions 377 233 182 199 81 1,072
Total Cumulative Provisions as a % of:
- Group total assets 0.5% 0.2% 0.3% 0.2% 0.1% 1.3% - NPLs in the respective countries 72% 71% 57% 87% 51% 68% - Unsecured NPLs in the respective countries 191% 197% 118% 116% 54% 132%
Details of DBSH Group’s NPLs and provisions at December 31, 2003 are as follows:
Regional Countries
In $ millions Singapore
Hong
Kong DTDB 1/ Others
Other
Countries Total
Non-Performing Loans 1,255 643 1,044 501 337 3,780
- Substandard 842 475 839 352 269 2,777
- Doubtful 42 66 20 49 27 204
- Loss 371 102 185 100 41 799
NPLs as a % of Group total assets 0.8% 0.4% 0.7% 0.3% 0.2% 2.4%
Non-bank NPLs as a % of non-bank loans
in the respective countries 2/ 3.3% 2.9% 28.8% 19.0% 8.5% 5.2%
Total Cumulative Provisions 851 418 561 389 168 2,387
- Specific provisions 475 190 378 193 87 1,323 - General provisions 376 228 183 196 81 1,064
Total Cumulative Provisions as a % of:
- Group total assets 0.5% 0.3% 0.4% 0.2% 0.1% 1.5% - NPLs in the respective countries 68% 65% 54% 78% 50% 63% - Unsecured NPLs in the respective countries 173% 180% 105% 111% 53% 124%
Notes:
1/ Includes special general provisions for regional exposures and additional specific provisions for DBS Thai Danu Public Company Limited (“DTDB”)’s loans. 2/ Computed based on total non-bank customer NPLs (excluding non-performing debt securities and contingent items) divided by total gross non-bank
DBS GROUP HOLDINGS LTD AND ITS SUBSIDIARY COMPANIES
4. Non-Performing Loans and Provisions (Continued)
Details of DBSH Group’s NPLs and provisions at March 31, 2003 are as follows:
Regional Countries
In $ millions Singapore
Hong
Kong DTDB 1/ Others
Other
Countries Total
Non-Performing Loans 1,486 780 919 638 310 4,133
- Substandard 1,017 582 821 445 212 3,077
- Doubtful 23 67 7 79 64 240
- Loss 446 131 91 114 34 816
NPLs as a % of Group total assets 0.9% 0.5% 0.6% 0.4% 0.2% 2.6%
Non-bank NPLs as a % of non-bank loans
in the respective countries 2/ 4.0% 3.4% 26.4% 34.8% 8.5% 5.9%
Total Cumulative Provisions 866 462 559 428 162 2,477
- Specific provisions 513 231 378 242 110 1,474 - General provisions 353 231 181 186 52 1,003
Total Cumulative Provisions as a % of:
- Group total assets 0.5% 0.3% 0.4% 0.3% 0.1% 1.6% - NPLs in the respective countries 58% 59% 61% 67% 52% 60% - Unsecured NPLs in the respective countries 153% 171% 112% 96% 61% 121%
Notes:
1/ Includes special general provisions for regional exposures and additional specific provisions for DBS Thai Danu Public Company Limited (“DTDB”)’s loans. 2/ Computed based on total non-bank customer NPLs (excluding non-performing debt securities and contingent items) divided by total gross non-bank
customer loans.
Industry Analysis of Non-Performing Loans
The following table shows the industry breakdown of the non-performing loans of DBSH Group:
DBSH Group
March 31, 2004 December 31, 2003 March 31, 2003
In $ millions Outstanding
Specific
Provisions Outstanding
Specific
Provisions Outstanding
Specific Provisions
Customer loans
Manufacturing 802 324 894 360 900 383
Building and Construction 354 87 414 98 404 135
Housing Loans 196 64 198 63 188 50
General Commerce 501 254 576 289 703 283
Transportation, Storage and
Communications 73 9 98 25 117 34
Financial Institutions, Investment and
Holding Companies 153 51 208 66 326 83
Professionals and Private Individuals
(except Housing Loans) 382 146 399 157 430 182
Others 635 153 695 165 711 171
Sub-total 3,096 1,088 3,482 1,223 3,779 1,321
Debt securities 172 78 184 73 225 115
Contingent items 91 33 114 27 129 38
DBS GROUP HOLDINGS LTD AND ITS SUBSIDIARY COMPANIES
5. Financial Derivatives
Financial derivatives are financial instruments whose characteristics are derived from the underlying assets, or from interest and exchange rates or indices. These include forwards, swaps, futures and options.
The following tables summarise the contractual or underlying principal amounts of derivative financial instruments held or issued for trading and non-trading purposes. The notional or contractual amounts of these instruments indicate the volume of transactions outstanding at the balance sheet date; they do not represent amounts at risk.
In the financial statements, trading derivative financial instruments are revalued on a gross position basis and the unrealised gains or losses are reflected in “Other assets” or “Other liabilities” respectively. Non-trading derivative financial instruments are accounted for on an accrual basis.
March 31, 2004
Trading Non-Trading
In $ millions
Underlying Notional
Positive Fair Value
Negative Fair Value
Underlying Notional
Positive Fair Value
Negative Fair Value
Interest Rate Derivatives 1,113,197 8,319 7,763 20,369 963 296
Foreign Exchange Derivatives 253,111 2,123 1,818 4,609 6 139
Equity Derivatives 9,723 54 310 - -
-Credit Derivatives 10,112 87 107 2,420 78
-Total 1,386,143 10,583 9,998 27,398 1,047 435
December 31, 2003
Trading Non-Trading
In $ millions
Underlying Notional
Positive Fair Value
Negative Fair Value
Underlying Notional
Positive Fair Value
Negative Fair Value
Interest Rate Derivatives 994,037 6,733 6,118 24,114 852 237
Foreign Exchange Derivatives 211,723 2,014 1,822 5,664 34 137
Equity Derivatives 8,444 36 196 544 #
-Credit Derivatives 9,292 82 109 2,422 77
-Total 1,223,496 8,865 8,245 32,744 963 374
Note:
DBS GROUP HOLDINGS LTD AND ITS SUBSIDIARY COMPANIES
6. Daily Earnings at Risk and Trading Income
The Group uses a Daily Earnings at Risk (“DEaR”) measure as one mechanism for controlling trading risk. The DEaR is calculated using a one-day time horizon and a 99% confidence interval. The following table shows the period-end, average, high and low DEaR for the trading risk exposure of the DBSH Group for the period from April 1, 2003 to March 31, 2004.
April 1, 2003 to March 31, 2004
In $ millions As at March 31, 2004 Average High 1/ Low 1/
Interest rate 24.3 24.5 33.7 19.6
FX 9.4 6.9 18.2 2.3
Equity 4.1 3.8 7.3 1.3
Diversification effect (12.8) (12.9) -
-Total 25.0 22.3 32.0 16.5
Note:
1/ The high (& low) DEaR figures reported for each risk class did not necessarily occur on the same day as the high (& low)
reported for total. A corresponding diversification effect cannot be calculated and is therefore omitted from the table.
The charts below provide the range of DEaR and the daily distribution of trading income in the trading portfolio for the period from April 1, 2003 to March 31, 2004.
DBSH Group DEaR for Trading Book
0 10 20 30 40 50 60 70 > 1 4 -1 5 > 1 5 -1 6 > 1 6 -1 7 > 1 7 -1 8 > 1 8 -1 9 > 1 9 -2 0 > 2 0 -2 1 > 2 1 -2 2 > 2 2 -2 3 > 2 3 -2 4 > 2 4 -2 5 > 2 5 -2 6 > 2 6 -2 7 > 2 7 -2 8 > 2 8 -2 9 > 2 9 -3 0 > 3 0 -3 1 > 3 1 -3 2 > 3 2 -3 3
DEaR ( $ m illion)
N o . o f D a y s
D B S H G r o u p D a ily D i s t r ib u t io n o f T r a d in g I n c o m e
1 0 2 0 3 0 4 0 5 0 6 0