FOR FIRST HALF 2003
PERFORMANCE SUMMARY
Contents
Page
Financial Highlights 2
Financial Review 3
Net Interest Income and Net Interest Margin 5
Non-Interest Income 6
Operating Expenses 7
Goodwill Amortisation 7
Provision Charge 8
Taxation 8
Asset Quality 8
Balance Sheet 9
Customer Deposits 10
Customer Loans 10
Capital Adequacy Ratio 11
Unrealised Valuation Surpluses 11
Geographical Segment Analysis 12
Business Segment Analysis 13
Comparatives 14
APPENDIX I: Unaudited Consolidated Profit And Loss Account
APPENDIX II: Unaudited Consolidated Balance Sheet
APPENDIX III: Unaudited Consolidated Cash Flow Statement
APPENDIX IV: Unaudited Statements of Changes in Shareholders’ Equity
APPENDIX V: Selected Notes to the Accounts
1. Earnings Per Ordinary Share
2. Loan And Investment Exposures To Malaysia, Indonesia, Thailand, Korea, The Philippines (Regional Countries), Hong Kong And China
3. Non-Performing Loans And Provisions 4. Financial Derivatives
Financial Highlights
DBS prepares its financial statements in accordance with Financial Reporting Standards (“FRS”). 1st Half
2003
1st Half 2002
2nd Qtr 2003
1st Qtr 2003
2nd Qtr 2002
S$'m S$'m S$'m S$'m S$'m
For the period
Income before operating expenses 2,043 2,034 988 1,055 1,011 Operating profit before goodwill amortisation and
provisions 1,142 1,108 529 613 544
Operating profit before provisions 928 972 422 506 475
Net profit before tax 663 796 260 403 381
Net profit attributable to members 466 536 187 279 258 Net profit attributable to members (excluding
goodwill amortisation) 680 672 294 386 327
At period-end
Shareholders' funds 14,745 14,152 14,745 14,742 14,152 Interest bearing assets 134,165 133,921 134,165 133,746 133,921 Customer loans 1/ 62,714 64,561 62,714 61,640 64,561 Customer deposits 105,514 102,984 105,514 105,629 102,984
Total assets 158,447 152,173 158,447 155,981 152,173
Per share S$ S$ S$ S$ S$
Basic earnings excluding goodwill amortisation 2/ 0.91 0.91 0.78 1.04 0.88
Basic earnings 2/ 0.62 0.72 0.50 0.75 0.69
Diluted earnings 2/ 0.60 0.70 0.48 0.72 0.66
Net asset value at period-end 9.65 9.25 9.65 9.64 9.25 Net tangible asset value at period-end 4.55 5.74 4.55 4.47 5.74
Performance ratios
1st Half 2003
1st Half 2002
2nd Qtr 2003
1st Qtr 2003
2nd Qtr 2002
(%) (%) (%) (%) (%)
On a GAAP basis
Return on assets 2/ 0.61 0.71 0.48 0.73 0.69
Return on equity 2/ 6.38 7.74 5.07 7.65 7.40
Excluding goodwill amortisation
Return on assets 2/ 0.88 0.89 0.75 1.01 0.87
Return on equity 2/ 9.31 9.71 7.95 10.59 9.37
Return on tangible equity 2/ 3/ 19.40 15.44 16.28 22.24 14.70
Efficiency and revenue mix ratios
Cost-to-income ratio (excluding goodwill
amortisation) 44.1 45.5 46.5 41.9 46.2
As a percentage of total operating income:
- net interest income 56.7 65.5 56.7 56.8 65.6
- non-interest income 43.3 34.5 43.3 43.2 34.4
BIS Capital ratios (at period-end)
- Tier 1 capital 9.7 12.7 9.7 9.8 12.7
- Total capital 14.2 17.6 14.2 14.5 17.6
Notes:
1/ After deducting cumulative provisions.
2/ Earnings per share, return on assets, return on equity and return on tangible equity for the periods are computed on an annualised basis. 3/ Computed based on net profit attributable to members excluding goodwill divided by average shareholders’ funds after deduction of average
Financial Review
DBSH Group’s operating profit before goodwill amortisation and provisions in the first half of 2003 (“1st Half 2003”) was S$1,142 million, an increase of 3.1% over the same period in 2002. The improved year-on-year performance was mainly due to a 2.7% reduction in operating expenses. After goodwill amortisation of S$214 million and higher provision charges of S$287 million, net profit attributable to members declined by 13.1% to S$466 million.
Cost-to-income ratio (excluding goodwill amortisation) improved to 44.1% compared to 45.5% for the same period last year.
Compared to first quarter 2003 (“1st Qtr 2003”), operating profit before goodwill amortisation and provisions decreased by 13.7% mainly due to lower income earned and higher operating expenses incurred in second quarter 2003 (“2nd Qtr 2003”). After taking into account provision of S$172 million, net profit attributable to members showed a decrease of 33%.
Cost-to-income ratio (excluding goodwill amortisation) increased to 46.5% in 2nd Qtr 2003 from 41.9% in 1st Qtr 2003.
Profit and Loss Account
1st Half 2003
1st Half 2002
2nd Qtr 2003
1st Qtr 2003
2nd Qtr 2002
S$'m S$'m S$'m S$'m S$'m
Net interest income 1,159 1,333 560 599 663
Non-interest income 884 701 428 456 348
Income before operating expenses 2,043 2,034 988 1,055 1,011
Operating expenses (901) (926) (459) (442) (467)
Operating profit before goodwill amortisation and
provisions 1,142 1,108 529 613 544
Goodwill amortisation (214) (136) (107) (107) (69)
Operating profit before provisions 928 972 422 506 475
Provisions (287) (203) (172) (115) (107)
Operating profit 641 769 250 391 368
Share of profit and loss of associates 22 27 10 12 13
Net profit before taxation 663 796 260 403 381
Taxation (169) (186) (58) (111) (86)
Minority interests (28) (74) (15) (13) (37)
Net profit attributable to members (“NPAM”) 466 536 187 279 258
DBS Bank (Hong Kong) Limited
The banking licenses for DBS' wholly-owned Hong Kong subsidiaries, including Dao Heng Bank Group and DBS Kwong On Bank, were legally merged on July 21, 2003 following the receipt of local regulatory and legislative approvals. The following table reflects the performance of the merged entity prepared under Hong Kong Generally Accepted Accounting Principles.
Operating profit for 1st Half 2003 showed a 13.3% year-on-year increase contributed by higher
non-interest income and lower impairment loss of fixed assets. Non-non-interest income rose by 30.5% due to higher sales of wealth management products and trading income. This was partly offset by lower net interest income and higher loan provisions. The reduction in net interest income was mainly attributable to sluggish loan demand. Provisions rose because of significant write-back in loan provisions in 1st Half 2002. Operating expenses declined by 2.4% mainly achieved through further streamlining of operations.
Operating profit in 2nd Qtr 2003 was lower than the preceding quarter by 22.4% due to higher provision charge and operating expenses. Expenses were incurred in the preparation for the legal merger. The provision charge in 2nd Qtr 2003 was primarily due to loan-related provisions.
Profit and Loss Account
1st Half 2003
1st Half 2002
2nd Qtr 2003
1st Qtr 2003
2nd Qtr 2002
S$'m S$'m S$'m S$'m S$'m
Net interest income 402 419 203 199 209
Non-interest income 171 131 87 84 65
Income before operating expenses 573 550 290 283 274
Operating expenses (242) (248) (128) (114) (120)
Impairment of fixed assets (3) (44) (2) (1) (44)
Operating profit before provisions 328 258 160 168 110
Provisions (106) (62) (63) (43) (41)
Operating profit 222 196 97 125 69
Net profit before taxation 222 204 97 125 74
Net profit after taxation 184 164 81 103 54
Notes:
1/ The exchange rate used for all comparative periods is based on HK$1 = S$0.2258.
2/ In the preparation of the consolidated accounts of DBSH Group, appropriate adjustments have been made to bring them in line with Financial Reporting Standards (“FRS”) in Singapore. Under FRS, the contribution from DBS Bank (Hong Kong) Limited was as follows:
1st Half 2003
1st Half 2002
2nd Qtr 2003
1st Qtr 2003
2nd Qtr 2002
S$'m S$'m S$'m S$'m S$'m
Net profit before taxation 203 182 85 119 62
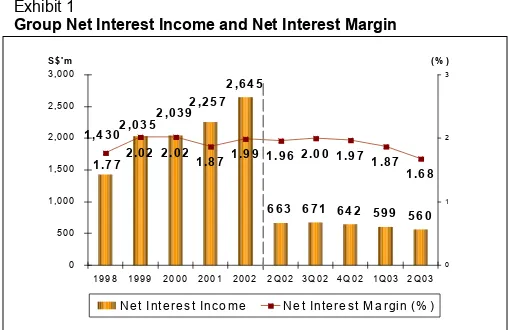
Exhibit 1
Group Net Interest Income and Net Interest Margin
2 ,6 4 5
Net Interest Income and Net Interest Margin
Net interest income in 1st Half 2003 decreased by 13.1% to S$1,159 million over the same period in 2002. The decrease was mainly due to narrower spread on loans and reduced benefits from deployment of net free funds in the prevailing low interest rate environment.
Net interest margin was 1.78% for 1st Half 2003 compared to 1.97% in 1st Half 2002.
Compared to 1st Qtr 2003, the decrease in net interest income to S$560 million in 2nd Qtr 2003 was mainly due to continuing interest spread compression in a low interest rate environment.
Net interest margin was 1.68% for 2nd Qtr 2003.
Table 1
Group Net Interest Income and Net Interest Margin
1st Half 2003 1st Half 2002
S$’m
Customer loans and advances 61,424 1,210 3.97 65,938 1,486 4.54
Interbank items 40,783 202 1.00 47,988 443 1.86
Securities 1/ 28,909 393 2.74 22,448 357 3.21
Total interest bearing assets 131,116 1,805 2.78 136,374 2,286 3.38
Total interest bearing liabilities 122,387 646 1.06 126,502 953 1.52
Net interest income/margin 1,159 1.78 1,333 1.97
2nd Qtr 2003 1st Qtr 2003 2nd Qtr 2002
S$’m
Customer loans and advances 61,821 602 3.91 61,225 608 4.03 65,326 726 4.46 Interbank items 41,298 91 0.88 40,751 111 1.10 47,797 219 1.84 Securities 1/ 30,570 199 2.61 27,718 194 2.83 22,620 175 3.10 Total interest bearing assets 133,689 892 2.68 129,694 913 2.86 135,743 1,120 3.31
Total interest bearing liabilities 125,026 332 1.06 121,318 314 1.05 125,775 457 1.46
Net interest income/margin 560 1.68 599 1.87 663 1.96
Notes:
Table 2
Fee and commission income 374 406
Stockbroking 51 83
Investment banking 33 32
Trade and remittances 54 55
Loan related 71 62
Deposit related 52 53
Credit card 41 46
Fund management 18 21
Wealth management 38 37
Others 16 17
Dividend and rental income 41 29
Other income 469 266
Net gain on treasury products including structured investment
products 282 177
Net gain on Singapore
government securities 135 47
Net gain on equities 11 13
Net gain on investment
securities 32 10
Net gain on fixed assets - 4
Others 9 15
Total 884 701
Non-interest income as a percentage of Operating
income (%) 43.3 34.5
S$'m
Fee and commission income 214 160 213
Stockbroking 33 18 36
Investment banking 26 7 19
Trade and remittances 27 27 26
Loan related 35 36 36
Deposit related 26 26 27
Credit card 21 20 25
Fund management 11 7 9
Wealth management 24 14 24
Others 11 5 11
Dividend and rental income 28 13 20
Other income 186 283 115
Net gain on treasury products including structured investment
products 129 153 83
Net gain on Singapore
government securities 33 102 21 Net gain/(loss) on equities 12 (1) (2) Net gain on investment
securities 5 27 3
Net gain/(loss) on fixed assets 1 (1) 4
Others 6 3 6
Total 428 456 348
Non-interest income as a percentage of Operating
income (%) 43.3 43.2 34.4
Non-interest Income
Fee and commission income in 1st Half 2003 decreased by 7.9% to S$374 million over the same period in 2002. The decrease was mainly due to lower stockbroking fees resulting from less favourable conditions in the equity market. Credit card fees and fund management income were also lower given the economic uncertainty in 1st Half 2003.
Other income for 1st Half 2003 increased significantly by 76.3% to S$469 million as compared to 1st Half 2002. The increase was due to higher net gains from treasury operations and investment securities.
Compared to 1st Qtr 2003, fee and commission income rose 33.8% to S$214 million in 2nd Qtr 2003. Most categories of fee and commission income registered increases reflecting the improvement in equity market and the success in sale of wealth management products.
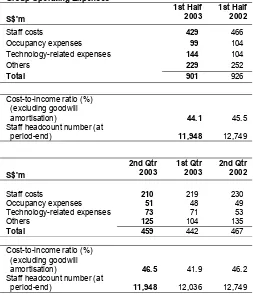
Table 3
Staff costs 429 466
Occupancy expenses 99 104
Technology-related expenses 144 104
Others 229 252
Total 901 926
Cost-to-income ratio (%) (excluding goodwill
amortisation) 44.1 45.5
Staff headcount number (at
period-end) 11,948 12,749
Staff costs 210 219 230
Occupancy expenses 51 48 49
Technology-related expenses 73 71 53
Others 125 104 135
Total 459 442 467
Cost-to-income ratio (%) (excluding goodwill
amortisation) 46.5 41.9 46.2
Staff headcount number (at
period-end) 11,948 12,036 12,749
Operating Expenses
Excluding goodwill amortisation, year-on-year (“YOY”) operating expenses declined by 2.7%.
Staff costs showed a decrease of S$37 million or 7.9%, of which approximately S$21 million was due to staff reduction resulting from outsourcing certain technology-related functions in the Group. The remaining S$16 million decrease in staff costs was the result of headcount reduction arising from rationalisation of workflow and businesses. Technology-related expenses showed a significant increase mainly due to payment of outsourcing fees.
YOY, the Group’s cost-to-income ratio (excluding goodwill amortisation) was 44.1% for 1st Half 2003 compared to 45.5% for the same period in 2002.
Compared to 1st Qtr 2003, second quarter operating expenses (excluding goodwill amortisation) was 3.8% higher. The increase was partially contributed by higher revenue-related expenses of approximately S$14 million. Cost-to-income ratio (excluding goodwill amortisation) was 46.5% in 2nd Qtr 2003.
Goodwill Amortisation
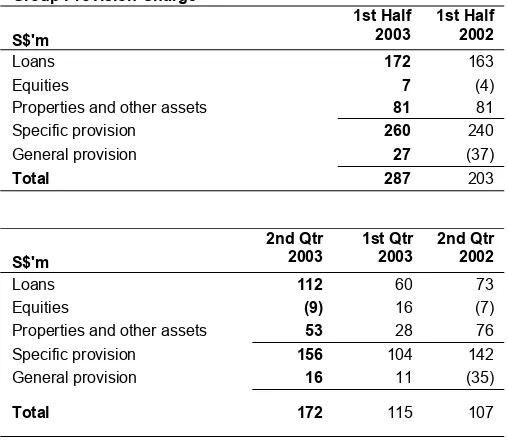
Table 4
Properties and other assets 81 81
Specific provision 260 240
General provision 27 (37)
Total 287 203
Loans 112 60 73
Equities (9) 16 (7)
Properties and other assets 53 28 76 Specific provision 156 104 142
General provision 16 11 (35)
Total 172 115 107
Provision Charge
Provision charge was S$287 million for 1st Half 2003. Approximately 69% of the total charge were loan-related.
Higher general provision was made in 1st Half 2003 following an increase in customer loan outstanding. This was in contrast with 1st Half 2002 where customer loan outstanding declined from year-end and general provision reserve was released.
In 2nd Qtr 2003, higher provision charge was set aside for customers both in Singapore and Hong Kong following the weak economic environment prevailing for most part of the quarter. The property market continues to be soft and additional provision was made for properties held by the Group.
Taxation
Tax expenses were lower in 1st Half 2003. This was mainly due to a lower income earned during this period as compared to 1st Half 2002.
Group Geographical NPL Rate (Based on MAS standard)
(%)
Singapore 3.9 4.2 3.8
Hong Kong 3.5 3.5 3.7
Regional countries (excl. DTDB) 26.5 40.6 36.3
DTDB 29.2 27.0 27.8
Other countries 8.7 8.7 7.1
Notes:
1/ DTDB : DBS Thai Danu Bank Public Company Limited
Asset Quality
The volume of non-performing loans (“NPLs”) was S$4.2 billion at the end of June 2003. This includes S$1.6 billion of restructured NPLs.
The ratio of NPLs to the total non-bank loans (“NPL rate”) decreased from 6.1% at the end of December 2002 to 5.9% at the end of June 2003 due to lower non-performing loans and higher non-bank loan base.
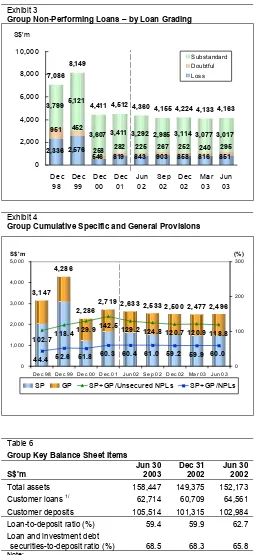
Exhibit 3
Group Non-Performing Loans – by Loan Grading
S$’ m
2,336 2,576
546 819 843 903 858 816 851 951 452
258 282 225 267 252 240 295 3,799 5,121
3,607 3,411 3,292 2,985 3,114 3,077 3,017 4,163
As at end June 2003, non-performing loans’ profile remains stable compared to end December 2002.
Exhibit 4
Group Cumulative Specific and General Provisions
2 ,4 9 6
SP GP SP+GP/Unsecured NPLs SP+GP/NPLs
Cumulative Specific and General Provisions
Total cumulative specific and general provisions at the end of June 2003 was 119% of unsecured NPLs, and 60% of total NPLs.
Table 6
Group Key Balance Sheet Items
S$'m
Total assets 158,447 149,375 152,173 Customer loans 1/ 62,714 60,709 64,561 Customer deposits 105,514 101,315 102,984 Loan-to-deposit ratio (%) 59.4 59.9 62.7 Loan and investment debt
securities-to-deposit ratio (%) 68.5 68.3 65.8
Note:
1/ After deducting cumulative provisions.
Balance Sheet
Table 7
Singapore dollar 55,360 53,655 54,139
US dollar 20,840 20,096 20,429
Hong Kong dollar 18,770 18,731 19,912
Thai Baht 3,658 3,164 3,288
Others 6,886 5,669 5,216
Total 105,514 101,315 102,984
Analysed by Product
Savings accounts (include S$ autosave) 44,452 43,047 42,370
Current accounts 9,301 8,975 8,951
Fixed deposits 48,261 46,026 50,363
Other deposits 3,500 3,267 1,300
Total 105,514 101,315 102,984
Table 8
Gross 64,905 62,901 66,964
Less:
Specific provisions 1,273 1,288 1,419
General provisions 918 904 984
Net total 62,714 60,709 64,561
Including:
Bills receivable 1,459 1,574 1,553
Loans 61,255 59,135 63,008
Net total 62,714 60,709 64,561
Industry Breakdown
Manufacturing 6,791 5,856 6,036
Building & Construction 7,780 8,057 9,198
Housing Loans 21,857 21,910 22,978
General Commerce 6,057 5,707 5,378
Transportation, Storage & Communications 4,869 4,617 5,183 Financial Institutions, Investment & Holding Companies 4,547 3,626 4,216 Professionals & Private Individuals (except Housing Loans) 7,320 7,784 8,117
Others 5,684 5,344 5,858
Total (Gross) 64,905 62,901 66,964
Analysed by Currency and Fixed / Variable Rates
Fixed rate 1/
Singapore dollar 8,381 8,359 11,445
Hong Kong dollar 479 460 401
US dollar 3 1 1
Thai Baht 785 862 698
Others 67 1 158
Sub-total 9,715 9,683 12,703
Variable rate 2/
Singapore dollar 21,305 21,673 20,791
Hong Kong dollar 20,478 20,238 21,366
US dollar 8,773 7,333 7,899
Thai Baht 2,395 2,128 2,462
Others 2,239 1,846 1,743
Sub-total 55,190 53,218 54,261
Total (Gross) 64,905 62,901 66,964
Notes:
1/ Fixed rate loans refer to long-term loans where the interest rates are fixed for the initial 1 to 3 years for certain mortgage loans, and over the entire loan period for other loans.
Table 9
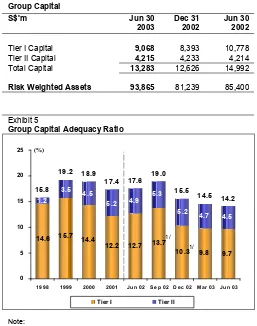
Tier I Capital 9,068 8,393 10,778 Tier II Capital 4,215 4,233 4,214 Total Capital 13,283 12,626 14,992
Risk Weighted Assets 93,865 81,239 85,400
Exhibit 5
Group Capital Adequacy Ratio
9.8 9.7
1/ The reduction in the Tier 1 CAR ratio, from 13.7% in September 2002 to 10.3% in December 2002, was primarily due to the deduction of additional goodwill with DBS' purchase of the DDH minority interest in early January 2003.
Capital Adequacy Ratio
At the end of June 2003, the total Capital Adequacy Ratio (“CAR”) for the DBSH Group, measured according to the Bank for International Settlements (“BIS”) guidelines was 14.2%.
Exhibit 6
Group Unrealised Valuation Surpluses
692
Unrealised valuation surpluses in quoted investments and properties (not recognised in the accounts) amounted to S$952 million at the end of June 2003.
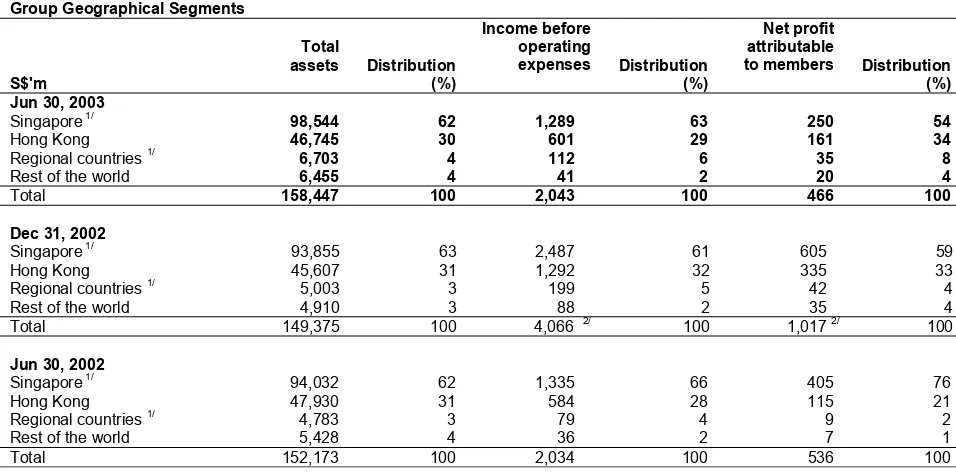
Geographical Segment Analysis
The following table analyses total assets, income before operating expenses and NPAM by geographical segments. Unless otherwise stated, the analysis of geographical segments are generally based on the location of the office recording the transactions.
Table 10
Group Geographical Segments
S$'m
Total
assets Distribution (%)
Income before operating
expenses Distribution (%)
Net profit attributable
to members Distribution (%) Jun 30, 2003
Singapore 1/
98,544 62 1,289 63 250 54
Hong Kong 46,745 30 601 29 161 34
Regional countries 1/ 6,703 4 112 6 35 8
Rest of the world 6,455 4 41 2 20 4
Total 158,447 100 2,043 100 466 100
Dec 31, 2002
Singapore 1/
93,855 63 2,487 61 605 59
Hong Kong 45,607 31 1,292 32 335 33
Regional countries 1/ 5,003 3 199 5 42 4
Rest of the world 4,910 3 88 2 35 4
Total 149,375 100 4,066 2/
100 1,017 2/
100
Jun 30, 2002
Singapore 1/
94,032 62 1,335 66 405 76
Hong Kong 47,930 31 584 28 115 21
Regional countries 1/ 4,783 3 79 4 9 2
Rest of the world 5,428 4 36 2 7 1
Total 152,173 100 2,034 100 536 100
Notes:
1/ Special general provisions for regional exposure, additional provisions for DTDB's loans and amortisation of goodwill on acquisitions of DBS Bank (Hong Kong) Limited are booked in Singapore.
2/ Refers to the full year 2002.
DBSH Group operates in four main geographical areas :
• “Singapore”, which includes the operations of the Asian Currency Unit.
• “Hong Kong”, which includes branch and subsidiary operations in Hong Kong.
• "Regional countries", which includes branch and subsidiary operations in Malaysia, Indonesia, Thailand, Korea and the Philippines.
• “Rest of the world”, which are mainly branch operations in China, India, Taiwan, United States and
United Kingdom.
Business Segment Analysis
The business segment results represent the customer segments of the respective businesses and are determined by:
• Income and direct expenses attributable to each customer and other segment; and
• Management accounting policies relating to the allocation of indirect expenses and funds transfer pricing between the central treasury unit and the customer/other segments.
The various customer segments are:
• Consumer Banking
Consumer Banking focuses on providing products and services to individual customers. The products and services offered to customers include credit facilities (mortgage, personal loans, etc.), credit cards, deposit collection, remittance services and asset management products.
The decrease in net profit after taxation (S$31 million, 18.1%) was mainly attributable to lower interest income and higher provisions partly offset by lower expenses.
• Enterprise Banking
Enterprise Banking focuses on providing products and services to small and medium enterprises. The product and services offered to customers include credit facilities (overdraft, factoring/accounts receivable purchase, trade financing, commercial/industrial property financing, hire purchase and government financing and assistance schemes), deposit, payment and collection services.
The decrease in net profit after taxation (S$3 million, 2.7%) was mainly attributable to higher provisions partly offset by higher fee income from trade services.
• Investment Banking
Investment Banking caters to the business needs of large corporate customers and financial institutions. The products and services offered to customers include direct lending, advisory banking services, bond issuance, equity financing, syndicated financing, mergers and acquisitions advisory services, debt restructuring advisory services, nominee and trustee services and cash management services.
The increase in net profit after taxation (S$20 million, 14.9%) was mainly attributable to lower provisions and expenses.
• Treasury and Markets
Treasury and Markets is primarily involved in market making, structuring and trading of financial products including foreign exchange, securities, interest rate, credit, equity and foreign exchange derivatives. Income from treasury products and services relating to customers of other segments is reflected in the respective customer segments.
The increase in net profit after taxation (S$49 million, 38.9%) was mainly attributable to higher income from trading of securities, foreign exchange and derivatives.
The other segments of the analysis are:
• Funding Portfolio
• Central Operations
Central Operations encompass a range of activities, with corporate decisions made at the centre and the related income and expenses not attributed to business segments. These include central treasury unit, funding costs of DBSH Group’s associated and subsidiary companies and gains/losses on properties as well as certain subsidiaries including stock brokerage and asset management.
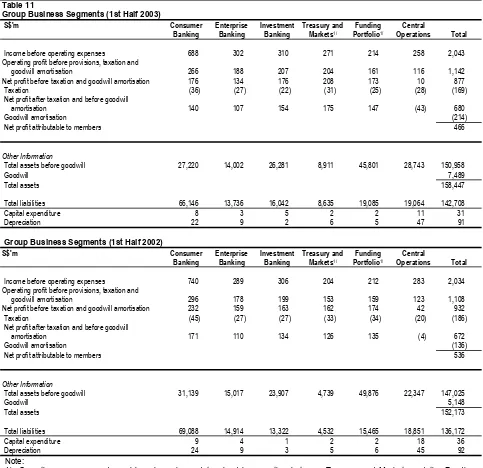
The following table analyses the results, total assets and total liabilities by business segments:
Table 11
Group Business Segments (1st Half 2003)
S$'m Consumer
Income before operating expenses 688 302 310 271 214 258 2,043
Operating profit before provisions, taxation and
goodwill amortisation 266 188 207 204 161 116 1,142
Net profit before taxation and goodwill amortisation 176 134 176 208 173 10 877
Taxation (36) (27) (22) (31) (25) (28) (169)
Net profit after taxation and before goodwill
amortisation 140 107 154 175 147 (43) 680
Goodwill amortisation (214)
Net profit attributable to members 466
Other Information
Total assets before goodwill 27,220 14,002 26,281 8,911 45,801 28,743 150,958
Goodwill 7,489
Total assets 158,447
Total liabilities 66,146 13,736 16,042 8,635 19,085 19,064 142,708
Capital expenditure 8 3 5 2 2 11 31
Depreciation 22 9 2 6 5 47 91
Group Business Segments (1st Half 2002)
S$'m Consumer
Income before operating expenses 740 289 306 204 212 283 2,034
Operating profit before provisions, taxation and
goodwill amortisation 296 178 199 153 159 123 1,108
Net profit before taxation and goodwill amortisation 232 159 163 162 174 42 932
Taxation (45) (27) (27) (33) (34) (20) (186)
Net profit after taxation and before goodwill
amortisation 171 110 134 126 135 (4) 672
Goodwill amortisation (136)
Net profit attributable to members 536
Other Information
Total assets before goodwill 31,139 15,017 23,907 4,739 49,876 22,347 147,025
Goodwill 5,148
Total assets 152,173
Total liabilities 69,088 14,914 13,322 4,532 15,465 18,851 136,172
Capital expenditure 9 4 1 2 2 18 36
Depreciation 24 9 3 5 6 45 92
Note:
1/ Operating expenses and provisions have been determined by prorating between Treasury and Markets and the Funding Portfolio based on the share of income before operating expenses.
Comparatives