Nonlinear Optical Transmission and Multiphoton Processes in Organics IV 6300C-1 A.T. Yates, K.D. Belfield, F. Kajzar, Editors.
Proceeding of SPIE Vol. 6330 (2006) @2006 SPIE doi:10.1117/12.680652/$15.00
Multiphoton spectroscopy of polymers for all-optical switching
Ayi Bahtiar
a, Kaloian Koynov, Asmorom Kibrom, Taek Ahn
b, Christoph Bubeck*
Max Planck Institute for Polymer Research, Ackermannweg 10, D-55128 Mainz, Germany;
apresent address: Department of Physics, University of Padjadjaran Bandung, Jl. Jatinangor km. 21
Sumedang, 45363, Indonesia;
b
present address: Korea Research Institute of Chemical Technology, P.O. Box 107, Yuseong,
Daejeon 305-600, Korea
ABSTRACT
We present nonlinear optical spectroscopy of the model conjugated polymer MEH-PPV, a derivative of poly(para-phenylenevinylene) (PPV) and compare it with PPV. We perform multiphoton excited fluorescence spectroscopy and z-scan studies of solutions compared with third-harmonic generation, linear and nonlinear waveguide spectroscopy with intensity dependent prism coupling of thin films in the NIR region. Spectra of the nonlinear absorption coefficient and nonlinear refractive index are used to identify the figures of merit (FOM). We observe a spectral window at 1100 – 1200 nm were the application demands for all-optical waveguide switching are fulfilled. We demonstrate all-optical refractive index changes in the order of 0.001. Control of the molecular weight of MEH-PPVs enables improved film forming properties, reduced birefringence and ultimately low waveguide propagation losses < 1 dB/cm.
Keywords: conjugated polymer, cubic nonlinearity, waveguide, refractive index, figure of merit, molecular weight
1. INTRODUCTION
All-optical switching is a long lasting goal which motivated much research of cubic nonlinear optical processes in various materials.1-5 The switching of light by light is based on the nonlinearities of the refractive index n or the
absorption coefficient α. Their dependencies on the light intensity I are commonly expressed by n = n0 + n2I and α = α0
+ α2I . The nonlinear refractive index n2 and the nonlinear absorption coefficient α2 are given by6
)] , , ; ( Re[ 1 4 3 )
( (3)
0 2 0
2 χ ω ω ω ω
ε ω = − − c n n (1) and )] , , ; ( Im[ 2 3 )
( (3)
0 2 2 0
2 χ ωω ωω
ε ω ω
α = − −
c
n , (2)
where χ(3)(-ω;ω,-ω,ω) denotes the complex third-order susceptibility, ω frequency, c velocity of light, and ε 0 the
permittivity of free space. The convention of writing the frequencies indicates the specific nonlinear optical process.5,6 For example, χ(3)(-ω;ω,-ω,ω) represents degenerate four wave mixing, two-photon absorption etc., and χ(3)(-3ω;ω,ω,ω)
describes third-harmonic generation. The materials requirements for all-optical waveguide switching devices can be formulated in terms of figures of merit (FOM)1-4
1 0 2 > = λ α I n W (3) and 1 2 2 2 < = n
T α λ (4)
at the working wavelength λ of the device and a typical intensity I = 1 GW/cm2. The optimization of W and T guides the search for most suitable materials which should have large n2 and small linear and nonlinear losses α0 and α2.
CH3
O O
n
n
Fig.1. Chemical structures of PPV (left) and MEH-PPV (right).
The so-called conjugated polymers possess a one-dimensionally delocalized π-electron system along the polymer backbone. They have been identified as very promising materials candidates for several optoelectronic applications.7,8 In particular, poly(para-phenylenevinylene) (PPV) and its derivatives have found much interest because they show good film forming properties and large third-order nonlinear optical properties.9-16 Fig. 1 shows the chemical structures of PPV and its derivative poly[2-methoxy-5-(2'-ethyl-hexyloxy)-1,4-phenylenevinylene] (MEH-PPV). Whereas PPV is insoluble, the substitution of MEH-PPV with branched alkyl chains renders this polymer soluble in common organic solvents enabling its purification and spin-coating of thin films.17 Both polymers are studied as model systems to reveal their basic photophysics. They were also successfully used in other fields of optoelectronics e.g. as organic light-emitting diodes and plastic lasers.18,19
Aim of this paper is to elucidate the materials development and the characterization of their cubic nonlinear optical properties at the example of PPV and MEH-PPV. We summarize our recent progress in the materials characterization of PPV derivatives and will present updated and new results as well.10,11,17,20-24 Among others, we will address the following questions related to some long standing problems:
- Why are the optical data of conjugated polymers measured in different laboratories often incompatible? - How can we get slab waveguides with lowest possible attenuation loss?
- What is the impact of film morphology on the optoelectronic properties of thin films?
We report in this paper that the molecular weight of the polymer has crucial influence on the film morphology, and consequently, on the linear and nonlinear optical properties of thin films. Our experimental studies comprise the following methods: Quantitative transmission and reflection spectroscopy in the UV-Vis-NIR range (Section 3.1), third-harmonic generation (Section 3.2), linear optical properties of slab waveguides (Section 3.3), intensity-dependent prism coupling (Section 3.4), two-photon excited fluorescence spectroscopy of solutions (Section 3.5), and z-scan studies of solutions (Section 3.6). Based on these spectral data, we will present spectra of the figures of merit (FOM) in Section 3.7 which will reveal that MEH-PPV has a spectral window between 1100 nm and 1200 nm with outstanding FOM. We will demonstrate all-optical refractive index changes as large as 0.001.
2. EXPERIMENTAL
Thin films of PPV were obtained by spin coating a solution of the tetramethylene sulfonium chloride precursor polymer in methanol onto fused silica substrates, followed by thermal annealing at 285 - 320 °C for 6 -12 h in vacuum (pressure below 10-4 hPa) as described in detail earlier.10,20
We used MEH-PPV from several sources which were synthesized differently. The frequently used, so-called Gilch dehydrohalogenation route yields polymers which have a weight-average molecular weight Mw in the order of 104 – 106
g/mol.25,26 However, M
w can be significantly reduced by appropriate choice of end-cappers in the synthetic process.
Another synthetic approach to MEH-PPV with very well defined chain structure was realized by using the Horner type polycondensation route which yields polymers with Mw in the typical order of several 104 g/mol.27,28 We have
investigated nine different MEH-PPV samples 1 - 9 as listed in Table 1 with Mw in the range of 104 – 106 g/mol as
described in detail elsewhere.24 Thin films of MEH-PPVs were prepared by spin coating from freshly prepared and
The film thicknesses d were measured with a Tencor model P10 step-profiler. We have used films with thickness d≈ 50 - 70 nm for spectroscopic studies and thicker films (400 - 800 nm) for optical waveguides. Transmission and reflection spectra of thin films on fused silica substrates were measured with Perkin Elmer models Lambda 9 and 900 spectrophotometers. Intrinsic absorption coefficients α of the films were evaluated from transmission spectra after correction of reflection losses at film/air- and film/substrate-interfaces as described in earlier works.10,17 The spectra of the refractive index at transverse electric polarization (nTE) of the films were obtained by reflectometry at nearly
perpendicular incidence and were evaluated by means of Fresnel’s equations.10,17
Third-harmonic generation (THG) of thin films of PPV was measured by means of the Maker fringe technique and evaluated as described earlier.10,29 THG spectra of MEH-PPV films were measured with a similar setup as described
recently.30 We used a Nd:YAG laser (EKSPLA model PL 2143B), the second harmonic output of which pumped an optical parametric generator (OPG: EKSPLA model PG 501), which gave laser pulses with a duration of 20 ps, repetition rate 10 Hz, and a wavelength tuning range between 680 nm and 2000 nm. The laser beam was focused on the sample, which was placed in an evacuated chamber and mounted on a rotation stage. The harmonic signals of the sample and a reference were measured simultaneously to compensate for the effect of laser intensity fluctuations. The Maker fringes were evaluated taking into account the measured data of the sample (thickness, refractive index, and absorption coefficients at the fundamental and harmonic wavelengths), the free and bound harmonic waves and their reflections at the interfaces as described earlier.10,29 The values of the modulus of <χ(3)(-3ω;ω,ω,ω)> at TE
polarization were determined with respect to the reference value 3.11 10-14 esu for the fused silica substrate for all laser wavelengths.31
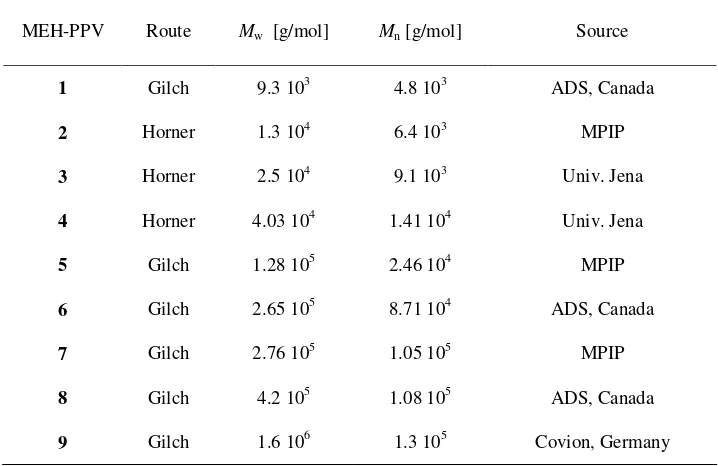
Table 1. Molecular weights (Mw: weight average, Mn: number average) of MEH-PPVs from different synthesis routes and sources: American Dye Source (ADS), Max Planck Institute for Polymer Research (MPIP), Prof. H.-H. Hörhold (University of Jena).
MEH-PPV Route Mw [g/mol] Mn [g/mol] Source
1 Gilch 9.3 103 4.8 103 ADS, Canada
2 Horner 1.3 104 6.4 103 MPIP
3 Horner 2.5 104 9.1 103 Univ. Jena
4 Horner 4.03 104 1.41 104 Univ. Jena
5 Gilch 1.28 105 2.46 104 MPIP
6 Gilch 2.65 105 8.71 104 ADS, Canada
7 Gilch 2.76 105 1.05 105 MPIP
8 Gilch 4.2 105 1.08 105 ADS, Canada
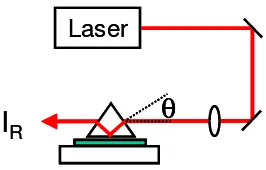
Laser
θ
I
RLaser
θ
θ
I
RFig. 2. Simplified view of the prism coupling setup.
The experimental setups for prism coupling and waveguide loss determination were described previously.20,21,32 A simplified view is shown in Fig. 2. The focussed laser beam enters the prism (with 60° angles) at an incidence angle θ. It is totally reflected at the prism base. Its evanescent field can extend across the air gap between prism and film and is able to excite a waveguide mode which is possible at discrete coupling angles θm, where m = 0, 1, 2, ... describes the
mode number. Consequently, the reflected intensity IR has relative minima at θm because of absorption and scattering
losses in the film. The angles θm can be used to evaluate n0 of the film following well-known procedures.33
The propagation loss coefficient of guided waves (αgw) is measured by means of a prism which has a 90° angle. It is
used to generate a free propagating waveguide mode. Its straylight is imaged onto a diode array as described earlier.17,32 We are using the following lasers: HeNe and cw-Nd:YAG lasers for linear optical waveguide studies and the OPG setup described above for intensity dependent waveguide coupling.
The OPG laser system is also used for two-photon excited fluorescence spectroscopy of MEH-PPV solutions in a fused silica cuvette. A part of the fluorescence light was collected and guided by an optical fiber to a monochromator, recorded by a photomultiplier and amplified by a Boxcar. Z-scan studies of MEH-PPV solutions were performed also with laser pulses from the OPG using the standard configuration of z-scan measurements with open and closed apertures, respectively.34
3. RESULTS AND DISCUSSION
3.1 Absorption spectra
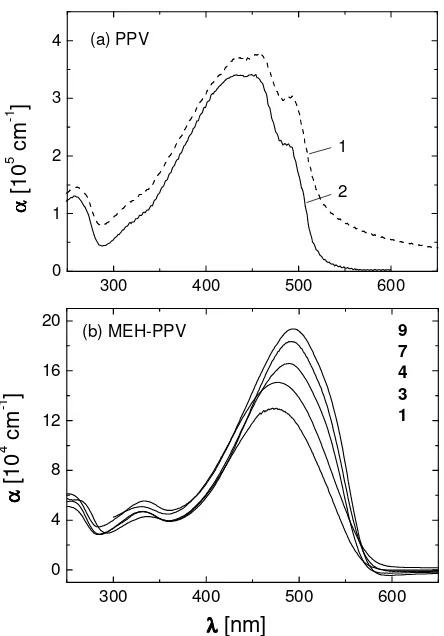
The evaluation of transmission spectra of ultrathin films with thicknesses smaller than approximately 100 nm requires special care, since the reflection losses at the film/air and film/substrate interfaces become comparable to the intrinsic absorption losses of the films. Therefore, the absorption spectrum of a thin film of PPV, measured relative to the background of an uncovered substrate, shows an apparent tail towards longer wavelengths, see Fig. 3a, spectrum 1. These reflection losses were calculated by means of the Fresnel equations and a matrix formalism taking into account the refractive index dispersions of fused silica substrate and polymer films, respectively.10 The corrected spectrum 2 refers to the intrinsic absorption of PPV.
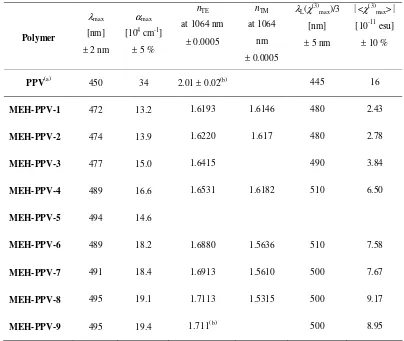
The intrinsic absorption spectra of thin films of MEH-PPVs are displayed in Fig. 3b. The absorption coefficients αmax
and wavelengths λmax of the maxima of the main absorption bands of all polymers are shown in Table 2. The data of
λmax have an estimated uncertainty of ± 2 nm because of broad absorption bands. The experimental error of αmax is in the
order of 5% and is caused mainly by the experimental error of d. The films of 1 – 4 and 6 - 9 show a systematic trend to larger values of αmax with increasing Mw which we attribute to changes of the average polymer chain orientation as will
be discussed below. The deviation of 5 from this trend is related to its much larger polydispersity ratio Mw/Mn as
300 400 500 600 0
1 2 3 4
2 1 (a) PPV
αααα
[
1
0
5
c
m
-1
]
300 400 500 600
0 4 8 12 16 20
(b) MEH-PPV 9
7 4 3 1
λ λ λ λ
[nm]
αααα
[
1
0
4
c
m
-1
]
Fig. 3. Absorption spectra of thin films (d = 50 – 70 nm) of PPV and MEH-PPVs on fused silica substrates, measured at perpendicular incidence of light. Part (a) shows the uncorrected spectrum (1, dashed line) measured relative to an uncovered substrate, and the intrinsic absorption spectrum (2, full line) after correction of the reflection losses at the film/air and film/substrate interfaces, respectively.10 Part (b) shows only the intrinsic absortion spectra of MEH-PPVs according to the numbers.
Fig. 3 and Table 2 reveal characteristic differences in the absorption behaviour of PPV and MEH-PPV: The substitution of MEH-PPVs with methoxy- and hexyloxy-groups causes a small red-shift of their λmax as compared to PPV.
Furthermore, the alkyl-groups render MEH-PPVs soluble but, on the other hand, lead to a dilution of the conjugated π -electron system per unit volume with the consequence that the αmax values are much smaller as observed in the case of
PPV. Vibronic fine structure is visible in the absorption of PPV and can be attributed to the dense packing of long chain segments in the well known polycrystalline morphology of PPV.35,36 On the other hand, the absorption spectra of MEH-PPVs do not show resolved vibronic bands which is in line with their more disordered morphology, recently described as nematic-like.37
3.2 Third-harmonic generation
THG spectroscopy is a versatile method to resolve χ(3)(-3ω;ω,ω,ω) where the frequency ω is related to the laser
wavelength λL. The so-called three-photon resonance is frequently encountered if λL is close to 3λmax which causes the
maximum χ(3)
max. For materials comparison we present the modulus of the orientation average <χ(3)max> evaluated at
TE polarization, and the corresponding laser wavelengths λL(χ(3)max) of thin films of PPV and MEH-PPVs in Table 2
Table 2. Linear and nonlinear optical data of thin films of PPV and MEH-PPVs, see text for definitions. (a) Data from Mathy et al.10 The refractive indices n
TE and nTM were measured by prism coupling, except those labelled (b)
which were determined with reflectometry.
Polymer
λmax
[nm]
± 2 nm
αmax
[104 cm-1]
± 5 %
nTE
at 1064 nm
± 0.0005
nTM
at 1064
nm
± 0.0005
λL(χ(3)max)/3
[nm]
± 5 nm
<χ(3) max>
[10-11 esu]
± 10 %
PPV(a) 450 34 2.01 ± 0.02(b) 445 16
MEH-PPV-1 472 13.2 1.6193 1.6146 480 2.43
MEH-PPV-2 474 13.9 1.6220 1.617 480 2.78
MEH-PPV-3 477 15.0 1.6415 490 3.84
MEH-PPV-4 489 16.6 1.6531 1.6182 510 6.50
MEH-PPV-5 494 14.6
MEH-PPV-6 489 18.2 1.6880 1.5636 510 7.58
MEH-PPV-7 491 18.4 1.6913 1.5610 500 7.67
MEH-PPV-8 495 19.1 1.7113 1.5315 500 9.17
MEH-PPV-9 495 19.4 1.711(b) 500 8.95
Similar to the case of absorption spectra, PPV has a larger value of <χ(3)
max> than MEH-PPV because of its larger
density of chromophores. The <χ(3)
max> data of MEH-PPVs show a significant increase for polymers with larger
molecular weight as we observed already for αmax which we attribute to a preferred orientation of chain segments
parallel to the layer plane as described in detail recently.23,24 Additionally, higher local fields and increased conjugation
lengths appear at higher molecular weights as will be presented in detail elsewhere.38 Based on the data of Table 2, one might be attempted to argue that PPV is a much more promising candidate for all-optical switching applications due to its superior χ(3)max. But for a final conclusion, we should look at the NIR transparency and the waveguide properties as
presented below.
3.3 Linear optical properties of slab waveguides
500 1000 1500 2000 0,1
1 10 100
3 2 1
1 PPV(precursor route) 2 MEH-PPV(Gilch) 3 MEH-PPV(Horner)
αααα
[
c
m
-1
]
λ λ λ λ
[nm]
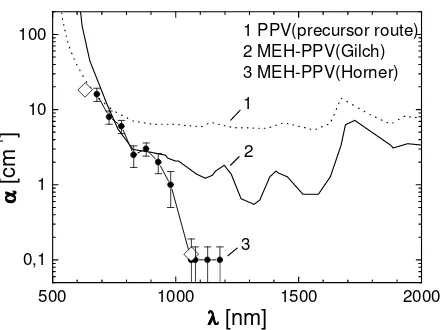
Fig. 4. Comparison of residual sub-bandgap absorptions of PPV and MEH-PPVs.17 Spectra 1 and 2 refer to data from photothermal deflection spectroscopy (Seager et al.39) and data 3 show waveguide loss experiments of MEH-PPV-4 from Koynov et al, respectively (open diamonds: straylight detection method, full circles: m-line method).21 The polymers are from different synthetic routes as indicated by their key words given in brackets.
The residual absorptions of the three polymers roughly agree at 600 – 750 nm which indicates that these values result from the intrinsic residual electronic absorption of PPV and MEH-PPV, respectively. At larger wavelengths, however, the residual losses of the soluble MEH-PPVs are significantly smaller because they can be purified by reprecipitation. The remaining loss coefficient α of MEH-PPV-4 (Horner) at λ > 1064 nm is caused mainly by light scattering, see below.
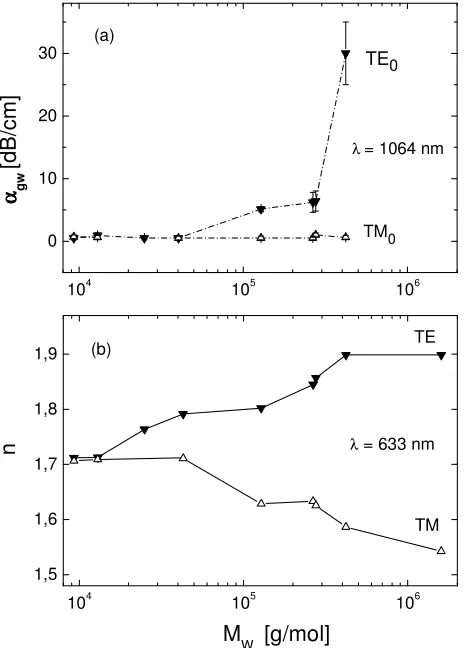
The total waveguide loss coefficient αgw is the sum of intrinsic absorptions and scattering losses. It was measured at TE
and TM polarizations with the straylight detection method as described in Section 2. Fig. 5a shows the data of αgw(TE0)
and αgw(TM0) at 1064 nm for all MEH-PPVs studied, except for MEH-PPV-9.We were not able to prepare a waveguide
of 9 due to solubility problems. Waveguides prepared from 1 - 4 with Mw < 5 104 g/mol have very low attenuation
losses αgw(TE0) < 1 dB/cm, whereas higher-Mw MEH-PPVs 5 - 8 have significantly larger values of αgw(TE0) which
increase strongly with Mw. Interestingly, all MEH-PPVs studied at TM polarization have nearly identical data of
αgw(TM0) in the range of 0.5 – 1.0 dB/cm.
As the intrinsic absorption of the MEH-PPV waveguides is negligibly small at 1064 nm, the measured loss coefficients αgw are caused by scattering losses only. Light scattering can arise from surface roughness and from scattering within
the film. Because the surface roughness of all MEH-PPV films was rather low and did not show any significant dependence on Mw, we have to discuss our data in terms of the morphology of the films. Whereas films of MEH-PPVs
with low Mw (Horner route) were reported to be amorphous,40 films of high-Mw (Gilch route) MEH-PPVs show a
nematic-like texture.37 It was also reported that gel formation and aggregation phenomena can occur already in solutions of high-Mw MEH-PPVs.41,42 These aggregates can be preserved through the casting process and were observed in the
films.42,43 Obviously, the morphology of MEH-PPV depends significantly on the molecular weight as discussed in detail
separately.24
We used the m-line technique (see Section 2 and Fig. 2) to measure the refractive index of MEH-PPV waveguides with typical thicknesses of 400 nm to 800 nm at both transverse electric polarization (nTE) and transverse magnetic
polarization (nTM). Fig. 5b shows nTE and nTM values as a function of Mw for all polymers studied. Because we were not
able to prepare sufficiently thick films of polymer 9 due to solubility problems, nTE of 9 was obtained by reflectometry
only. The nTM value of this polymer was extrapolated from Tammer et al who measured the birefringence of the same
polymer by means of variable angle spectroscopic ellipsometry.44 At high molecular weights M
w > 5 105 g/mol, the
birefringence is very large and seems to approach a saturation limit. The values of nTE and nTM in this region are in good
reduced and at Mw < 1.5 104 g/mol a nearly complete loss of birefringence is observed with a remaining birefringence
nTE - nTM < 0.005. Although MEH-PPVs were synthesized in different laboratories via different routes, the results
displayed in Fig. 5b show good reproducibility and a continuous dependence of the refractive index data on the molecular weight.
We discuss the molecular weight dependence of αmax, nTE and nTM of MEH-PPV films by means of the average
orientation of polymer chain segments with respect to the layer plane. The spin cast films exhibit uniaxial anisotropy due to preferred alignment of the polymer backbones parallel to the layer plane. The average chain orientation is strongly related to the optical constants of thin films. The main electronic π-π* transition at λmax, and the major electric
polarizability which is related to n, are both polarized parallel to the polymer backbone. Consequently, αmax and n are
largest if the electric field vector E of incident light is parallel to the chain direction. If the PPV chain segments become increasingly aligned parallel to the layer plane, clearly αmax which is measured at E parallel to the film plane, and nTE
will increase, and correspondingly nTM will decrease. Our experimental results show this correlation of nTE, nTM, αmax
and <χ(3)
max> with Mw quite well.
To address the first two questions from the Introduction: Obviously, the optical data of conjugated polymers measured in different laboratories can agree only if the polymer used has the identical molecular weight and polydispersity (Mw/Mn). Slab waveguides of conjugated polymers show lowest possible attenuation loss if the films have a nearly
amorphous morphology which, according to our results, is more likely with polymers of low molecular weight.
104 105 106
0 10 20 30
TM0
TE0
λ = 1064 nm
αααα g
w
[d
B
/c
m
]
(a)
104 105 106
1,5 1,6 1,7 1,8 1,9
TM TE
λ = 633 nm
n
M
W[g/mol]
(b)
3.4 Intensity dependent prism coupling of slab waveguides
The principle of prism coupling is sketched in Fig. 2. Nonlinear prism coupling occurs when the incident intensity I is so large that the refractive index of the film (nf) becomes intensity dependent. Similarly, the absorption coefficient of the
film (αf) can also change because of increased two-photon absorption, for example. The quantitative evaluation of the
nonlinear refractive index n2 and nonlinear absorption coefficient α2 is described in detail elsewhere.20,21 A crucial step
in the evaluation of n2 and α2 is the determination of the thickness of the air-gap between the prism base and the film
surface which is accomplished by simulation of the angular dependence of the reflected intensity IR. Fig. 6 shows an
example of intensity dependent prism coupling. The minimum of the resonance coupling angle θ shifts with increasing energy of the incident laser pulses. This is directly related to a change of nf. The resonance curve also becomes deeper
due to an increase of αf. The intensity-dependent shifts of the coupling curves were fully reversible at the input laser
pulse energy below a certain limiting value which was approximately 3 µJ for 1064 nm < λ < 1600 nm and < 1 µJ for λ < 1064 nm.
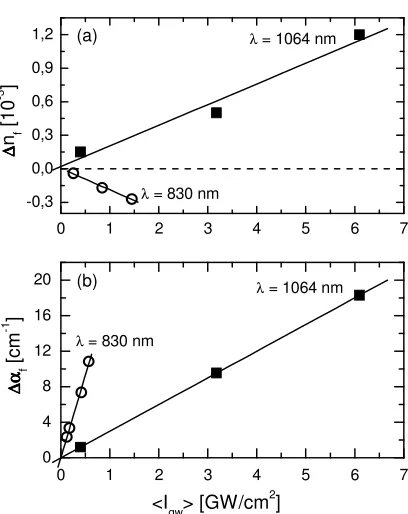
The knowledge of the air-gap thickness enables the evaluation of the average intensity <Igw> in the waveguide.20,21 Fig.
7 shows examples of the changes in refractive index ∆nf and absorption coefficient ∆αf at wavelengths 830 nm and 1064
nm as a function of <Igw>. The data of ∆nf and ∆αf increase linearly with <Igw> which is typical for a cubic nonlinear
optical process and allow the evaluation of n2 and α2 of the waveguide. A remarkably large ∆nf up to 10-3 with complete
reversibility of the coupling curves was observed at 1064 nm.
We like to point out that the optically induced changes of n and α observed here have a pure electronic origin, i.e. they are not thermally induced because of the short pulse duration (20 ps) and low repetition rate (10 Hz) of our laser system. Furthermore, thermal “nonlinearities” would normally show ∆n < 0 only.
The intensity dependent prism coupling experiments were performed in the range 680 nm < λ < 1600 nm. The spectral dependences of the nonlinear absorption coefficient α2 and nonlinear refractive index n2 are shown in Fig. 8. Very large
values of α2 were observed at wavelengths around 800 - 850 nm that are caused by two-photon absorption. At λ > 1000
nm, α2 decreases strongly and does not show any other significant resonance. At λ > 1000 nm the value of α2 is smaller
than 10-8 cm/W. Negative n2 values were observed at λ < 980 nm. Around 980 nm, n2 is zero and becomes positive at
longer wavelengths. The maximum of n2 = (2.2 ± 0.4) x 10-13 cm2/W was observed at λ = 1080 nm. At λ > 1100 nm, the
n2 values decrease monotonically.
-10,2 -10,0 -9,8 -9,6 -9,4 -9,2
0,6 0,7 0,8 0,9 1,0
λ = 1064 nm
0.1 µJ 1.0 µJ 2.0 µJ
I
R[
a
.u
.]
θ
[deg.]
0 1 2 3 4 5 6 7 -0,3
0,0 0,3 0,6 0,9 1,2 (a)
λ = 830 nm
λ = 1064 nm
λ = 1064 nm
∆
α
∆
α
∆
α
∆
α f
[
c
m
-1 ]
<Igw> [GW/cm2]
∆∆∆∆
n f
[
1
0
-3 ]
0 1 2 3 4 5 6 7
0 4 8 12 16 20 (b)
λ = 830 nm
Fig. 7. Optically induced and fully reversible changes in (a) refractive index ∆nf and of (b) absorption coefficient ∆αf at laser wavelengths 830 nm (open circles) and 1064 nm (full squares) as a function of the average intensity <Igw> in the waveguide of MEH-PPV-4 (TE0mode).
We interpret the main spectral features of the dispersions of α2 and n2 as being due to two processes:21 First, the broad
maximum of α2 at approximately 830 nm is caused by two-photon absorption, which is in good agreement with the peak
observed in the two-photon excitation spectra of the fluorescence, see Section 3.5. Second, the negative n2 data from
680 to 950 nm are assigned to saturable absorption, which is the dominant nonlinear optical process that occurs for intense laser pulses at the long-wavelength tail of the main absorption band displayed in Figs. 3b and 4, respectively.
3.5 Two-photon excited fluorescence spectroscopy of MEH-PPV solutions
To verify the α2 data, we performed two-photon excited fluorescence experiments with a solution of MEH-PPV-4 in
toluene (concentration: 3% by weight). At laser wavelengths between 700 nm and 1000 nm, the fluorescence intensity (recorded at 600 nm) scales with the square of the intensity of the laser pulses which allows the calculation of the imaginary part of the cubic nonlinearity Im[χ(3)]in arbitrary units.
The two-photon fluorescence excitation spectrum is shown in Fig. 8 for comparison with the α2 data. The agreement of
both spectra is excellent. This means that the chromophores of MEH-PPV behave very similar in the solid state (film) as compared to the solution state which indicates that aggregation of chromophores does not have significant influence on the nonlinear optical spectra of MEH-PPV. Furthermore, the relative experimental error of Im[χ(3)] is much smaller than
that of α2. Therefore, the more accurate values can be used to evaluate the figures of merit with reduced experimental
0,0
0,5
1,0
1,5
2,0
-6
-4
-2
0
2
600
700
800
900
1000
1100
1200
-8
-6
-4
-2
0
2
4
(b)
n
2[
1
0
-4
c
m
2
/G
W
]
λ
λ
λ
λ
[nm]
600
700
800
900
1000
1100
1200
0,0
0,1
0,2
0,3
( )
αααα
2[
1
0
3
c
m
/G
W
]
(a)
αααα
2222[
c
m
/G
W
]
n
2[
1
0
-5
c
m
2
/G
W
]
Fig. 8. Nonlinear optical spectra of MEH-PPV measured at the laser wavelength λ. (a) Comparison of data of α2 from nonlinear prism coupling (films of 4, full large dots, left scale), from two-photon excitation spectra of fluorescence (solutions of 4, open circles, arbitrary units scaled to the peak of film data, error bars are smaller than symbol size), and from z-scan (solution of 6, small dots, right scale). (b) Dispersion of n2 from nonlinear prism coupling (films of 4, full large dots, left scale), and z-scan (solution of 6, small dots, right scale).
3.6 Z-scan experiments of MEH-PPV solutions
For further verification of the n2 and α2 data, we performed z-scan studies of solutions of MEH-PPV-6 in chloroform
(concentration: 0.14 % by weight). We used a 1 mm cuvette and a lens with 350 mm focal length in our setup which is similar to the basic configuration reported by Sheik-Bahae et al.34 Open-aperture and closed-aperture scans were
performed and evaluated according to the standard approach.34 The n2 and α2 data of the z-scan studies are also plotted
3.7 Spectra of the figures of merit
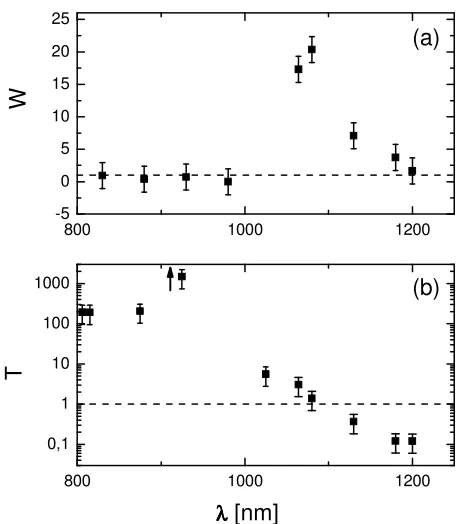
The measured values of αgw, α2 and n2 from linear and nonlinear prism coupling were used to calculate the spectral
dependences of the figures of merit W and T as defined in Section 1.We have used the total waveguide loss coefficient αgw instead of α0 because it contains also the scattering losses and is more appropriate for device applications, and a
light intensity I = 1 GW/cm2 as in earlier estimates of W.2 The values of the two-photon excitation spectra of
fluorescence (shown in Fig. 8a) were used to perform a refined estimate of α2 for the evaluation of T in the NIR region,
because their experimental error is much smaller than that of α2 as obtained from nonlinear prism coupling. The
dispersions of W and T are shown in Fig. 9. W is very large (as much as W = 20) near 1080 nm according to the maximum nonlinear refractive index. The dispersion of T shows high values at short wavelengths owing to strong two-photon absorption. Toward longer wavelengths λ > 1000 nm T decreases and becomes < 1 at λ> 1100 nm because of the decrease of the two-photon absorption band.
We like to compare MEH-PPV with other possible candidates for all-optical switching applications. Surveys of FOM of different material systems i.e. dielectrics, semiconductors, and organic materials were reported earlier.1-4 Because of its fabrication with ultimate purity, SiO2 shows largest W > 103 and T << 1 which is the basis for successful nonlinear
optical fiber applications. But on the other hand, some applications require a certain minimum value of n2 to achieve
nonlinear optical response at shorter propagation distances. In this respect, our data of MEH-PPV appear as the most promising ones, to the best of our knowledge.
For all-optical device concepts, it may be interesting to note which all-optical refractive index changes ∆n are feasible. In our intensity dependent prism coupling experiments, we have already demonstrated ∆n = 0.001 (λ = 1064 nm, <Igw>
= 5 GW/cm2, see Fig. 7) with MEH-PPV.21 In the case of PPV, we already showed ∆n = 0.002 (λ = 925 nm, <Igw> = 0.5
GW/cm2).20 These intensities are still below the damage thresholds of the polymers which were reported: > 12 GW/cm2 for MEH-PPV and 5 GW/cm2 for PPV.17
800 1000 1200
0,1 1 10 100
1000
(b)
W
T
λ λλ
λ
[nm]
800 1000 1200
-5 0 5 10 15 20 25
(a)
4. SUMMARY AND CONCLUSIONS
We have studied and compared the linear and nonlinear optical properties of thin films of the model conjugated polymers PPV and MEH-PPV. We conclude that MEH-PPV is the most promising materials candidate for the realization of an integrated all-optical switching device because it shows a superior combination of large third-order nonlinearity, ultimately low waveguide propagation losses and sufficient photostability.
We have studied the optical properties of thin films of MEH-PPV with large variations of molecular weight in the range of Mw = 104 - 106 g/mol. We observe that the molecular weight has strong impact on the alignment of the polymer chain
segments with respect to the layer plane, and consequently, on the optical birefringence, waveguide propagation loss and cubic nonlinearity. Thin films of high Mw have most chain segments oriented parallel to the layer plane which
causes large birefringence, whereas films prepared from low Mw MEH-PPV have nearly random orientation of chain
segments and show small birefringence. We conclude that MEH-PPV with lower Mw is most favorable for the
realization of all-optical switching devices because it enables easier fabrication of slab waveguides and offers a good combination of large nonlinearity and ultimately low waveguide propagation losses at transverse electric polarization. These results have major consequences on device applications using thin films of conjugated polymers because the polymer chain orientation directly relates to their optoelectronic properties. Control of molecular weight is a prerequisite for a reproducible preparation of thin polymer films with identical morphology and optical properties. Furthermore, our results suggest an easy way for fine-tuning of optical constants by appropriate choice of the molecular weight.
We have shown that MEH-PPV satisfies the figures of merit requirements for all-optical switching in a spectral window at 1100 nm to 1200 nm, located at the lower energy tail of the two-photon absorption. In this region, the losses due to two-photon absorption are already negligibly small but the nonlinear refractive index n2 is still enhanced by the
two-photon absorption resonance. This result can provide a guideline for future materials development for nonlinear optical applications. The spectral region that fulfills the figures of merit requirements could be shifted to the telecommunication windows at 1300 nm or 1550 nm by an appropriate design of molecular structures.
ACKNOWLEDGEMENTS
We like to thank Prof. H.-H. Hörhold (University of Jena) for valuable advice, discussions, supply of several batches of MEH-PPV-3, -4, Dr. H. Becker (Covion) for the gift of MEH-PPV-9, G. Herrmann, H. Menges and W. Scholdei for their help with film preparation and optical spectroscopy, respectively. Financial support was given in parts by the Deutscher Akademischer Austauschdienst (DAAD, PhD-stipend to A. B.), European Community (Marie Curie Fellowship to K. K.), Alexander von Humboldt Foundation (T. A.) and the Bundesministerium für Bildung und Forschung.
REFERENCES
1. G. I. Stegeman and R. H. Stolen, J. Opt. Soc. Am. B 6, 652-662 (1989). 2. G. I. Stegeman, SPIE 1852, 75-89 (1993).
3. A.G. Astill, Thin Solid Films 204, 1-17 (1991).
4. J. L. Brédas, C. Adant, P. Tackx, and A. Persoons, Chem. Rev. 94, 243-278 (1994). 5. U. Gubler and Ch. Bosshard, Adv. Poly. Sci. 158, 123-191 (2002).
6. P. N. Butcher and D. Cotter, The Elements of Nonlinear Optics, Cambridge University Press, Cambridge, 1990. 7. J. L. Brédas and R. R. Chance (Eds.), Conjugated Polymeric Materials: Opportunities in Electronics,
Optoelectronics, and Molecular Electronics, NATO ASI Series E vol.182, Kluwer Acad. Publ., Dordrecht, 1990. 8. G. Hadziioannou and P. F. van Hutten (Eds.), Semiconducting Polymers – Chemistry, Physics and Engineering,
Wiley-VCH, Weinheim, 2000.
9. C. Bubeck, A. Kaltbeitzel, R. W. Lenz, D. Neher, J. D. Stenger-Smith and G. Wegner, in Nonlinear Optical Effects in Organic Polymers, J. Messier, F. Kajzar, P. N. Prasad, and D. Ulrich, Eds., NATO ASI Series E vol. 162, Kluwer Acad. Publ., Dordrecht, pp. 143-147 (1989).
11. C. Bubeck, K. Ueberhofen, J. Ziegler, F. Fitrilawati, U. Baier, H. Eichner, C. Former, K. Müllen, S. Pfeiffer, H. Tillmann and H.-H. Hörhold, Nonlinear Optics 25, 93-104 (2000).
12. U. Bartuch, A. Bräuer, P. Dannberg, H.-H. Hörhold and D. Raabe, Int. J. Optoelectronics 7, 275-279 (1992). 13. F. Michelotti, T. Gabler, H.-H. Hörhold, R. Waldhausl and A. Bräuer, Opt. Commun. 114, 247-254 (1995). 14. Th. Gabler, R. Waldhäusl, A. Bräuer, U. Bartuch, R. Stockmann and H.-H. Hörhold, Optics Commun. 137, 31-36
(1997).
15. Th. Gabler, A. Bräuer, R. Waldhäusl, U. Bartuch, H.-H. Hörhold and F. Michelotti, Pure and Appl. Optics 7, 159-168 (1998).
16. S. J. Martin, D. D. C. Bradley, P. A. Lane, H. Mellor and P. L. Burn, Phys. Rev. B 59, 15133-15142 (1999). 17. F. Fitrilawati, M. O. Tjia, S. Pfeiffer, H.-H. Hörhold, A. Deutesfeld, H. Eichner and C. Bubeck, Opt. Mater. 21,
511-519 (2002).
18. R. H. Friend, R. W. Gymer, A. B. Holmes, J. H. Burroughes, R. N. Marks, C. Taliani, D. D. C. Bradley, D. A. Dos Santos, J. L. Bredas, M. Lögdlund and W. R. Salaneck, Nature 397, 122-128 (1999).
19. M. D. McGehee and A. J. Heeger, Adv. Mater. 12, 1655-1668 (2000).
20. K. Ueberhofen, A. Deutesfeld, K. Koynov and C. Bubeck, J. Opt. Soc. Am. B 16, 1921-1935 (1999).
21. K. Koynov, N. Goutev, F. Fitrilawati, A. Bahtiar, A. Best, C. Bubeck and H.-H. Hörhold, J. Opt. Soc. Am. B 19, 895-901 (2002).
22. M. A. Bader, G. Marowsky, A. Bahtiar, K. Koynov, C. Bubeck, H. Tillmann, H.-H. Hörhold and S. Pereira, J. Opt. Soc. Am. B 19, 2250-2262 (2002).
23. K. Koynov, A. Bahtiar, T. Ahn, C. Bubeck and H.-H. Hörhold, Appl. Phys. Lett. 84, 3792-3794 (2004). 24. K. Koynov, A. Bahtiar, T. Ahn, H.-H. Hörhold and C. Bubeck, Macromolecules, submitted (2006). 25. H. G. Gilch and W. L. Wheelwright, J. Polym. Sci., Part A-1: Polym. Chem, 4, 1337 (1966). 26. F. Wudl and G. Sradanov, US-Pat. 5189136.
27. S. Pfeiffer and H.-H. Hörhold, Macromol. Chem. Phys. 200, 1870-1878 (1999).
28. W. Holzer, A. Penzkofer, H. Tillmann and H.-H. Hörhold, Synth. Met. 140, 155-170 (2004). 29. D. Neher, A. Wolf, C. Bubeck and G. Wegner, Chem. Phys. Lett. 163, 116-122 (1989).
30. K. Koynov, A. Bahtiar, C. Bubeck, B. Mühling and H. Meier, J. Phys. Chem. B 109, 10184-10188 (2005). 31. F. Kajzar and J. Messier, Phys. Rev. A 32, 2352-2363 (1985).
32. A. Mathy, H. U. Simmrock and C. Bubeck, J. Phys. D: Appl. Phys. 24, 1003-1008 (1991). 33. R. Ulrich and R. Torge, Appl. Opt. 12, 2901-2908 (1973).
34. M. Sheik-Bahae, A. A. Said, t.-H. Wei, D. J. Hagan and E. W. van Stryland, IEEE J. Quantum Electronics, 26, 760-769 (1990).
35. D. D. C. Bradley, J. Phys. D: Appl. Phys. 20, 1389-1410 (1987).
36. J. D. Stenger-Smith, R. W. Lenz and G. Wegner, Polymer 30, 1048-1053 (1989).
37. S. H. Chen, A. C. Su, H. L. Chou, K. Y. Peng and S. A. Chen, Macromolecules 37, 167-173 (2004). 38. A. Bahtiar, K. Koynov and C. Bubeck, to be published.
39. C. H. Seager, M. Sinclair, D. McBranch, A. J. Heeger and G. L. Baker, Synth. Met. 49-50, 91-97 (1992).
40. G. Kranzelbinder, E. Toussaere, J. Zyss, A. Pogantsch, E. W. J. List, H. Tillmann and H.-H. Hörhold, Appl. Phys. Lett. 80, 716-718 (2002).
41. T.-Q. Nguyen, V. Doan and B. J. Schwartz, J. Chem. Phys. 110, 4068-4078 (1999).
42. T.-Q. Nguyen, I. B. Martini, J. Liu and B. J. Schwartz, J. Phys. Chem. B 104, 237-255 (2000). 43. C. Y. Yang, F. Hide, M. A. Diaz-Garcia, A. J. Heeger and Y. Cao, Polymer 39, 2299-2304 (1998). 44. M. Tammer and A. P. Monkman, Adv. Mater. 14, 210-212 (2002).
45. A. Boudrioua, P. A. Hobson, B. Matterson, I. D. W. Samuel and W. L. Barnes, Synth. Met. 111-112, 545-547 (2000).