Refer to Important disclosures on the last of this report
Stock DataTarget price (Rp) Rp440
Prior TP (Rp) Rp620
Shareprice (Rp) Rp358
Upside/downside (%) +22.9
Sharesoutstanding (m) 26,361
Marketcap. (US$ m) 636
Estimate Change; Vs. Consensus 2018 2019 PT Indo Premier Securities
[email protected] +62 21 5793 1168
Lower order book due to project delays
Increased production capacity by 15% by the end of 2018.
We lower our earnings forecast by 10/14% in FY18F/19F.
Improved cash flow from several project payment of Rp6.5tn.
Maintain Buy with lower TP of Rp440 (target P/E of 9.8x).
Production capacity hike to 3.75tn ton (+15% yoy) by end 2018.
As of
8M18, WSBP has production capacity at 3.5mn ton/year (+7.7% yoy) from the
expansion at its existing plants in Gasing and Bojonegoro of 100k and 150k ton,
respectively. WSBP targets to increase production capacity to 3.75mn ton/year by
the end of 2018. The additional capacity might come from either existing plant or
a new plant, based on project needs and locations.
Revised down our earnings forecast due to guidance downward revision.
Due to several project tender delay and WSKT’s decision to postponed the
attainment of several toll road project, WSBP decided to reduce its FY18F new
contract guidance to Rp8.3tn (from Rp11.5tn). As of 8M18, WSBP has achieved
new contract of Rp4tn, forming 49% of company’s FY18F new guidance of
Rp8.3tn. WSBP’s low new contract achievement was resulted from several toll
road project delays such as Krian-Legundi-Bunder-Manyar, Cibitung-Cillincing,
Pasuruan-Probolinggo and Cimanggis-Cibitung part 2. Given lower FY18F new
contract guidance, we reduce our earnings forecast for FY18F/19F by 10/15% as
we implement lower new contract assumption to Rp8tn and Rp8.5tn for FY18F and
FY19F (from Rp11tn and Rp11.5tn).
Received payment of Rp6.5tn for major turnkey projects.
As of 8M18,
WSBP has received terminal payment of Rp6.5tn from several major project such
as Becakayu, Pemalang-Batang, Batang Semarang toll roads. In the remaining
2H18, WSBP is scheduled to receive another payment of Rp1tn from Becakayu
section 1A. In addition, company also expecting additional payment of ±Rp3tn
from two projects, namely, Legundi-Bunder, and Cimanggis-Cibitung Toll Ways
(CCTW) I & II. WSBP is currently negotiating the payment term for those projects
in order to change it to working progress payment instead of the initial agreement
of turnkey payment. Note: WSBP has previously succeeded to change the
payment term for Becakayu project section 1B and C in 1H18 worth Rp1.8tn from
turnkey to working progress.
Maintain Buy with lower TP of Rp440 (from 620).
Despite slower than
expected new contract attainment in 8M18, we continue to like WSBP given its
robust production capacity growth and its low DER at 0.78x. However, downward
revision on our FY18F/19F earnings forecast have led our DCF-based TP to
decrease to Rp440 (from Rp620), representing target FY18F PE of 9.8x. Key risk
to our call might come from further projects tender delay from governments.
Waskita Beton
(
WSBP IJ
)
Source: WSBP, IndoPremier Share Price Closing as of : 14-Sept-2018
2
Refer to Important disclosures on the last of this report
Fig. 1: Production capacity to increase to 4mn to/year ton Fig. 2: Order book has peaked in 2017
Source: Company, IndoPremier Source: Company, IndoPremier
Fig. 3: Earnings to grow by 24% CAGR in FY17F-FY19F Fig. 4: Revenue to grow by 17% CAGR in FY17-FY19F
Source: Company, IndoPremier Source: Company, IndoPremier
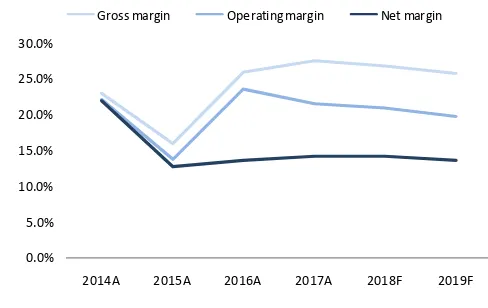
Fig. 5: Gross margin to slightly decrease due to increase debt Fig. 6: Contract contribution from parent is still at 60%
Source: Company, IndoPremier Source: Company, IndoPremier
64%
2015A 2016A 2017A 2018F 2019F
%
k ton/year
Installed capacity Used capacity Utilization rate
4,408
2014A 2015A 2016A 2017A 2018F 2019F
(Rp bn) Order book
334
2015A 2016A 2017A 2018F 2019F
(Rp bn) Net Profit (LHS) growth (RHS)
158%
2015A 2016A 2017A 2018F 2019F
(Rp bn)
Precast Ready mix Construction growth (%)
0.0%
2014A 2015A 2016A 2017A 2018F 2019F Gross margin Operating margin Net margin
3
Refer to Important disclosures on the last of this report
Fig. 7: Earnings change
Old New Differences
2018 2019 2018 2019 2018 2019
Revenue 9,150.7 10,912.5 8,450.8 9,683.8 -7.6% -11.3%
Gross profit 2,472.2 2,823.7 2,256.4 2,482.5 -8.7% -12.1%
Operating profit 1,940.0 2,189.0 1,764.2 1,918.0 -9.1% -12.4%
Net profit 1,322.1 1,526.8 1,188.8 1,311.9 -10.1% -14.1%
Gross margin 27.0% 25.9% 26.7% 25.6%
Operating margin 21.2% 20.1% 20.9% 19.8%
Net margin 14.4% 14.0% 14.1% 13.5%
Source: Company, IndoPremier
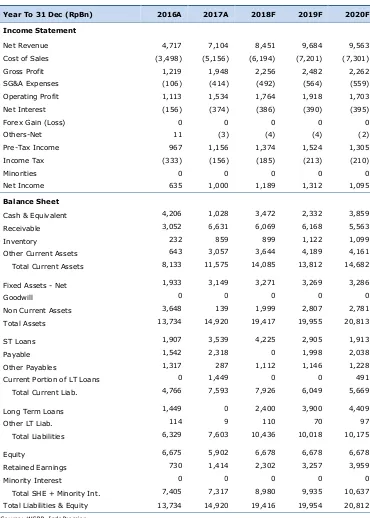
Year To 31 Dec (RpBn) 2016A 2017A 2018F 2019F 2020F
Income Statement
Net Revenue 4,717 7,104 8,451 9,684 9,563
Cost of Sales (3,498) (5,156) (6,194) (7,201) (7,301)
Gross Profit 1,219 1,948 2,256 2,482 2,262
SG&A Expenses (106) (414) (492) (564) (559)
Operating Profit 1,113 1,534 1,764 1,918 1,703
Net Interest (156) (374) (386) (390) (395)
Forex Gain (Loss) 0 0 0 0 0
Others-Net 11 (3) (4) (4) (2)
Pre-Tax Income 967 1,156 1,374 1,524 1,305
Income Tax (333) (156) (185) (213) (210)
Minorities 0 0 0 0 0
Net Income 635 1,000 1,189 1,312 1,095
Balance Sheet
Cash & Equivalent 4,206 1,028 3,472 2,332 3,859
Receivable 3,052 6,631 6,069 6,168 5,563
Inventory 232 859 899 1,122 1,099
Other Current Assets 643 3,057 3,644 4,189 4,161
Total Current Assets 8,133 11,575 14,085 13,812 14,682
Fixed Assets - Net 1,933 3,149 3,271 3,269 3,286
Goodwill 0 0 0 0 0
Non Current Assets 3,648 139 1,999 2,807 2,781
Total Assets 13,734 14,920 19,417 19,955 20,813
ST Loans 1,907 3,539 4,225 2,905 1,913
Payable 1,542 2,318 0 1,998 2,038
Other Payables 1,317 287 1,112 1,146 1,228
Current Portion of LT Loans 0 1,449 0 0 491
Total Current Liab. 4,766 7,593 7,926 6,049 5,669
Long Term Loans 1,449 0 2,400 3,900 4,409
Other LT Liab. 114 9 110 70 97
Total Liabilities 6,329 7,603 10,436 10,018 10,175
Equity 6,675 5,902 6,678 6,678 6,678
Retained Earnings 730 1,414 2,302 3,257 3,959
Minority Interest 0 0 0 0 0
Total SHE + Minority Int. 7,405 7,317 8,980 9,935 10,637
Total Liabilities & Equity 13,734 14,920 19,416 19,954 20,812
5
Refer to Important disclosures on the last of this report
Year to 31 Dec 2016A 2017A 2018F 2019F 2020F
Cash Flow
Net Income (Excl.Extraordinary&Min.Int) 635 1,000 1,189 1,312 1,095
Depr. & Amortization 117 375 396 486 542
Changes in Working Capital (2,188) (4,376) 1,543 (947) 749
Others 2 (2,184) (61) (93) 425
Cash Flow From Operating (1,434) (5,184) 3,066 758 2,812
Capital Expenditure (2,369) 1,918 (2,378) (1,292) (533)
Others 40 91 113 123 117
Cash Flow From Investing (2,329) 2,009 (2,265) (1,169) (416)
Loans 2,595 1,632 1,637 180 7
Equity 5,819 0 0 0 0
Dividends (380) (317) (300) (357) (394)
Others (212) (1,347) 379 (553) (483)
Cash Flow From Financing 7,822 (32) 1,716 (730) (870)
Changes in Cash 4,060 (3,207) 2,518 (1,141) 1,527
Financial Ratios
Gross Margin (%) 25.8 27.4 26.7 25.6 23.6
Operating Margin (%) 23.6 21.6 20.9 19.8 17.8
Pre-Tax Margin (%) 20.5 16.3 16.3 15.7 13.6
Net Margin (%) 13.5 14.1 14.1 13.5 11.5
ROA (%) 7.0 7.0 6.9 6.7 5.4
ROE (%) 14.5 13.6 14.6 13.9 10.6
ROIC (%) 10.8 8.9 8.6 8.9 7.0
Acct. Receivables TO (days) 137.7 248.5 274.0 230.4 223.6
Acct. Receivables - Other TO (days) 0.4 0.2 0.2 0.2 0.3
Inventory TO (days) 24.4 9.5 7.0 7.1 6.6
Payable TO (days) 118.5 136.6 144.6 116.2 100.9
Acct. Payables - Other TO (days) 0.0 0.0 0.0 0.0 0.0
Debt to Equity (%) 45.3 68.2 73.8 68.5 64.0
Interest Coverage Ratio (x) 0.2 0.3 0.3 0.3 0.3
Net Gearing (%) (11.5) 54.1 35.1 45.0 27.8
Head Office
PT INDO PREMIER SECURITIES
Wisma GKBI 7/F Suite 718
Jl. Jend. Sudirman No.28
Jakarta 10210 - Indonesia
p +62.21.5793.1168
f +62.21.5793.1167
INVESTMENT RATINGS
BUY : Expected total return of 10% or more within a 12-month period HOLD : Expected total return between -10% and 10% within a 12-month period SELL : Expected total return of -10% or worse within a 12-month period
ANALYSTS CERTIFICATION.
The views expressed in this research report accurately reflect the analysts personal views about any and all of the subject securities or issuers; and no part of the research analyst's compensation was, is, or will be, directly or indirectly, related to the specific recommendations or views expressed in the report.
DISCLAIMERS