Volume 14, Number 2, February 2017 (Serial Number 132)
Jour nal of US-China
Public Administration
Dav i d
Publication Information:
Journal of US-China Public Administration is published monthly in print (ISSN 1548-6591) and online (ISSN 1935-9691) by David Publishing Company located at 616 Corporate Way, Suite 2-4876, Valley Cottage, NY 10989, USA.
Aims and Scope:
Journal of US-China Public Administration, a professional academic journal, commits itself to promoting the academic communication about analysis of developments in the organizational, administrative and policy sciences, covers all sorts of researches on social security, public management, educational economy and management, national political and economical affairs, social work, management theory and practice etc. and tries to provide a platform for experts and scholars worldwide to exchange their latest researches and findings.
Editorial Board Members:
Andrew Ikeh Emmanuel Ewoh (Texas Southern University, USA) Beatriz Junquera (University of Oviedo, Spain)
Lipi Mukhopadhyay (Indian Institute of Public Administration, India)
Ludmila Cobzari (Academy of Economic Studies from Moldova, Republic of Moldova) Manfred Fredrick Meine (Troy University, USA)
Maria Bordas (Corvinus University of Budapest, Hungary) Massimo Franco (University of Molise, Italy)
Patrycja Joanna Suwaj (Stanislaw Staszic School of Public Administration, Poland) Paulo Vicente dos Santos Alves (Fundação Dom Cabral—FDC, Brazil)
Robert Henry Cox (University of Oklahoma, USA) Sema Kalaycioglu (Istanbul University, Turkey)
Manuscripts and correspondence are invited for publication. You can submit your papers via Web Submission, or E-mail to [email protected]. Submission guidelines and Web Submission system are available at http://www.davidpublisher.com
Editorial Office:
616 Corporate Way, Suite 2-4876, Valley Cottage, NY 10989
Tel: 1-323-984-7526; 323-410-1082 Fax: 1-323-984-7374; 323-908-0457 E-mail: [email protected]; [email protected]
Copyright©2017 by David Publishing Company and individual contributors. All rights reserved. David Publishing Company holds the exclusive copyright of all the contents of this journal. In accordance with the international convention, no part of this journal may be reproduced or transmitted by any media or publishing organs (including various websites) without the written permission of the copyright holder. Otherwise, any conduct would be considered as the violation of the copyright. The contents of this journal are available for any citation, however, all the citations should be clearly indicated with the title of this journal, serial number and the name of the author.
Abstracted / Indexed in:
Chinese Database of CEPS, Airiti Inc. & OCLC
Chinese Scientific Journals Database, VIP Corporation, Chongqing, P.R. China Academic Key
Google Scholar
Index Copernicus, Poland
Norwegian Social Science Data Services (NSD), Norway Hein Online Database, W.S.HEIN, USA
Social Science Research Network (SSRN)
Subscription Information:
Print $560 Online $360 Print and Online $600 (per year)
For past issues, please contact: [email protected], [email protected]
David Publishing Company
616 Corporate Way, Suite 2-4876, Valley Cottage, NY 10989
Journal of US-China
Public Administration
Volume 14, Number 2, February 2017 (Serial Number 132)
Contents
Management Issues and Practice
Performance Management and Development System: A Case Study of
the Office of the Premier in South Africa 63 P. K. Manye, D. M. Mello
Micro Retail Enterprises in China: Challenging the Stereotype 74 Walter Huber, Martin Brady, Qin Deng, Xinxin Wei, Man Zhang, Ruizhen Zhang, Xiaoxuan Zhang
Research on the Relationship Between Entrepreneur Human Capital and
Entrepreneurial Performance 83
Pingping Liu
Social Governance
Working Poor in Mainland China: Concept and Life Trajectory of Its Main
Working Groups 91
Jinghong Liu
Female Principals in the Israeli Arab Society: Between Social Conventions and
Self-fulfillment Career 100
Husein Saris
Governments and Democracy
Journal of US-China Public Administration, February 2017, Vol. 14, No. 2, 63-73 doi: 10.17265/1548-6591/2017.02.001
Performance Management and Development System: A Case
Study of the Office of the Premier in South Africa
P. K. Manye, D. M. Mello
North-West University, Mafikeng Campus, South Africa
Public institutions across the globe are confronted with the challenge of achieving more objectives with limited
resources. Human resource managers and line managers have even fewer resources to incentivize performance. The
limitation in resources makes performance management a difficult task. Top management has performance
expectations on the one hand while employees on the other hand expect fair reviews and rewards that are
commensurate to their performance from immediate supervisors and their institutions. Despite persistent challenges
in the Performance Management and Development System (PMDS), the South African public service has not
initiated internal surveys to establish perceptions of employees regarding the system. In such instances, the
employer assumes that employees are happy or utilizes the number of grievances lodged as a benchmark for
effective implementation of PMDS. This study closes the gap between what the employer thinks and the real
perception of employees at operational level.
Keywords: performance, assessment, management, development, South Africa
The perceptions of employees regarding performance management and its effectiveness need to be assessed regularly to ensure that PMDS (Performance Management and Development System) still meets the primary objectives that it was established for. This paper represents an attempt, albeit at a smaller scale, to assess the effectiveness of the PMDS. A questionnaire was used to establish the perceptions of officials of the Office of the Premier who are assessed annually according to the current PMDS. This paper outlines the method followed in conducting the research, presents and analyzes data, discusses results, outlines main findings, and makes recommendations.
Research Method
The research method is a careful planning of operations to be followed in collecting the data in a rigorous, systematic way, in accordance with methods and ethics of social research. There are several types of research designs used for research purposes. The critical part in any study is to choose the most appropriate design. Creswell (2013, p. 12) emphasized this by stating that the researcher not only selects qualitative, quantitative, or mixed methods of the study she/he conducts; the researcher also needs to critically decide on a type of study within these three choices. Creswell’s statement is corroborated by Brynard and Hanekom (2006, p. 38) who
P. K. Manye, BAdmin Hons, North-West University, Mafikeng Campus, South Africa; research fields: public administration, performance management.
Corresponding author: D. M. Mello, DAdmin, North-West University, Mafikeng Campus, South Africa; research fields: public administration, monitoring and evaluation of performance.
PERFORMANCE MANAGEMENT AND DEVELOPMENT SYSTEM 64
are of the view that the researcher chooses either of the designs or uses mixed designs for better insight into the research area. Research designs have three types of inquiry, namely qualitative, quantitative, and mixed methods approaches, and they provide specific path for procedures in a research design (Creswell 2013, p. 13). The quantitative strategy was followed in the process of data collection and data analysis to explore the implementation of PMDS. In this study, a questionnaire was used to collect data.
Population and Sample
Population
Newman (2004, p. 205) defined population as a gathering of people of specified categories possessing a characterized space at a specific time or an aggregate gathering of life forms of the same species (or different gatherings inside of people may trade hereditary data). Population incorporates the total collection of all units of analysis about which the researcher wishes to draw specific conclusion from their study (Welman, Kruger, & Mitchel 2005, p. 52). Population can thus be said to be a group of potential participants to whom the researcher wants to generalize the results of a study. In this study, the population consists of employees in the Office of the Premier in South Africa. Johnson and Christensen (2010, p. 257) affirmed that a target population is the bigger populace to whom the research study results are to sum up. For the purpose of this investigation, a sample was drawn from the Office of the Premier which had a total of 748 employees at the time the research was conducted. All these employees constituted the population of the study.
Sampling
Daniel (2011, p. 1) defined sampling as the selection of a subset of the members of a population for inclusion in a study. Antonius (2003, p. 108) defined a sampling design as a detailed plan for arriving at a sample. Sampling design is specific about the type of sample used, and mentions the units from which the sample is selected, the number of units necessary, and the precise method of selecting them. A sample is regarded as a small number of individuals whom the researcher picks from the main group for the purpose of the study they are conducting. Bryman (2008, p. 187) defined a sample as segment of a population that is carefully chosen for research purposes.
A sample of 90 participants was selected for this study. The 90 participants constitute 12% of the total population. Not all questionnaires were returned. Questionnaires that were returned were fully completed, and identities of individuals who filled out questionnaires were kept confidential. The population for this study comprised of employees ranging from senior management, middle management, and subordinate staff. There are mainly two types of sampling, Antonius (2003, p. 109) stated that they are namely: probabilistic samples and non-probabilistic samples. For the purposes of this research undertaking, the simple random sampling method was employed.
Questionnaires
PERFORMANCE MANAGEMENT AND DEVELOPMENT SYSTEM 65
Presentation and Analysis of Data
In this section, data which were gathered through questionnaires are presented.
Biographical Data
Table 1 below represents gender distribution and indicates that from the questionnaires received, the sample had more females (56%) than males who are 44% of the sample. This means that there are more females employed in the Office of the Premier. These figures are a sign that the Office of the Premier has some success in the implementation of the Employment Equity Act of 1998.
Table 1
Gender Description of Participants
Gender Frequency Percentage
Female 50 56%
Male 40 44%
Total 90 100%
Table 2 below gives an illustration of age distribution of the sample. The findings from the sample show that most of the respondents who are employed in the Office of the Premier are between the age of 35 and 43 years, followed by those who are in the age range of 25 to 34 years, and the least being in the range between 18 and 24 years. It can be observed that employees in the age range 35-43 are almost twice the number of those in the age range 18-24.
Table 2
Age Description of Participants
Age range Frequency Percentage
18-24 years 14 16%
25-34 years 27 30%
35-43 years 32 35%
44+ years 17 19%
Total 90 100%
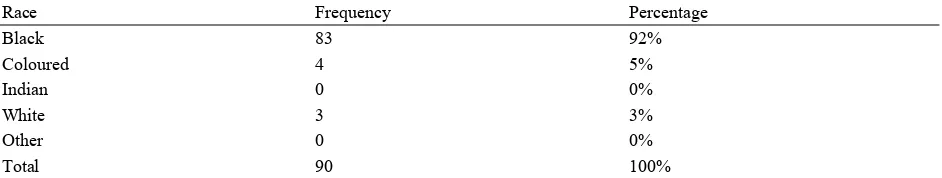
Table 3
Distribution in Terms of Race
Race Frequency Percentage
Black 83 92%
Coloured 4 5%
Indian 0 0%
White 3 3%
Other 0 0%
Total 90 100%
PERFORMANCE MANAGEMENT AND DEVELOPMENT SYSTEM 66
because of the high number of black residents in the area of study. These figures suggest that the Office of the Premier may have to consider hiring more Indian people in proportion to the provincial demographics.
Table 4 below indicates that 79% of the employees in the sample are permanently employed, followed by interns who constitute 18% of sample and only 3% of employees are on contract. From the sample, it can be observed that there are a high number of interns as opposed to contract workers.
Table 4
Type of Contract
Type of contract Frequency Percentage
Permanent 71 79%
Intern 16 18%
Contract 3 3%
Total 90 100%
Employee Performance and Development
Section B of the questionnaire encompasses employee performance and development. This section tries to establish whether employees are motivated by their managers to develop and do more in relation to PMDS.
Table 5 indicates that 32.22% of the respondents agreed that there are incentives put in place to make them perform better, while the smallest portion of the sample (7.78%) strongly disagreed. This could be that employees do not have any incentives put in place for them to perform better. The sample further points out that 26.67% were neutral, 17.78% disagreed, and 15.56% strongly agreed.
Table 5
Question 1: There Are Incentives Put in Place to Motivate Me to Perform Well
Variable Percentage of responses
Strongly disagree 7.78%
Disagree 17.78% Neutral 26.67% Agree 32.22%
Strongly agree 15.56%
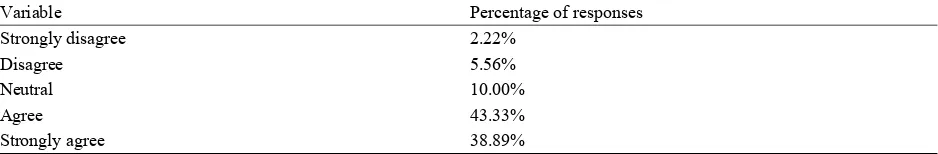
Table 6 below demonstrates that the majority of the sample (43.33%) agreed that they are assessed based on the criteria agreed upon by them and their supervisors, while a small fraction disagreed (5.56%). The 38.89% strongly agreed, 2.22% strongly disagreed, and the rest of the respondents (10%) were not quite sure and decided to be neutral. The reason for this could be the number of interns employed in the Office of the Premier. Interns serve for a period of one year and may not have the full knowledge of PMDS.
Table 6
Question 2: I Am Assessed Based on Criteria Agreed Upon Between Myself and the Supervisor
Variable Percentage of responses
Strongly disagree 2.22%
Disagree 5.56% Neutral 10.00% Agree 43.33%
PERFORMANCE MANAGEMENT AND DEVELOPMENT SYSTEM 67
Table 7 indicates that majority of the respondents in the sample (46%) agreed that their work is evaluated as per work agreement, followed by 36% of the respondents who strongly agreed. This could be that such respondents are well aware of what is expected of them and is developed in relation to PMDS and how it is implemented in the Office of the Premier. The rest of the responses were spread amongst those who were neutral (10%), disagreed (5%), and strongly disagreed (3%).
Table 7
Question 3: My Work Is Evaluated as per Work Agreement
Variable Percentage of responses
Strongly disagree 3%
Disagree 5% Neutral 10% Agree 46%
Strongly agree 36%
Of the sample collected based on Table 8, the majority of respondents who constitute 42.22% agreed that their managers positively influence their performance, while the smallest fraction of the sample 6.67% strongly disagreed. The reason could be that some employees do not have good working relations with their managers.
Table 8
Question 4: My Manager Influences My Performance Positively
Variable Percentage of responses
Strongly disagree 6.67%
Disagree 8.89% Neutral 24.44% Agree 42.22%
Strongly agree 17.78%
Table 9 illustrates the number of employees who find their job to be stimulating. The majority of respondents (37.78%) agreed that they find their job to be stimulating, while 24.44% strongly agreed. These are employees who are fairly happy with the work they do and are able to go an extra mile in their work. This sample also encompasses a small portion of 2.22% of employees who strongly disagreed, while 27.78% were neutral and 7.78% disagreed.
Table 9
Question 5: I Find My Job to Be Stimulating
Variable Percentage of responses
Strongly disagree 2.22%
Disagree 7.78% Neutral 27.78% Agree 37.78%
Strongly agree 24.44%
PERFORMANCE MANAGEMENT AND DEVELOPMENT SYSTEM 68
were neutral were followed by 28% who agreed that there is sufficient action taken towards improving their performance. The rest of the respondents were divided into 7% who strongly disagreed, 15% who disagreed, and 10% who strongly agreed.
Table 10
Question 6: There Is Sufficient Action Taken to Improve My Performance
Variable Percentage of responses
Strongly disagree 7%
Disagree 15% Neutral 40% Agree 28%
Strongly agree 10%
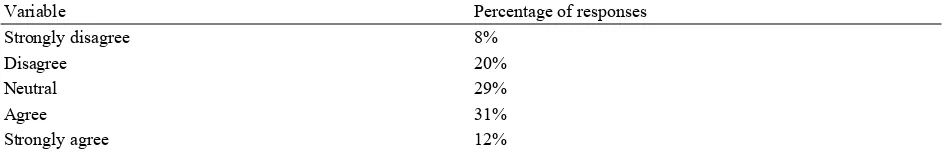
Table 11 indicates that of the sample drawn, a large number (31%) indicated that they agree that the current performance management is effective, meaning that they are happy with it and are seeing best results. Those who strongly agree were 12%. The rest of the respondents were spread amongst 8% strongly disagreed, 29% neutral, and 20% disagreed. In a related study conducted by Makamu (2016, p. 254), 60.2% of respondents drawn from a sample of national government departments agree that the system is effective. The 74.1% in the same study pointed out that there are challenges in the implementation of the performance management system in South Africa.
Table 11
Question 7: The Current Performance Management and Development System Is Effective
Variable Percentage of responses
Strongly disagree 8%
Disagree 20% Neutral 29% Agree 31%
Strongly agree 12%
Employee Performance Assessment and Development
Section C of the questionnaire evaluates employee assessment and development.
Table 12 illustrates that all the participants (100%) understand the work they do. The researchers have established that although employees might encounter problems in the work they do, they fairly understand it, and they just need development.
Table 12
Question 8: I Understand the Work I Do
Variable Percentage of respondents
Yes 100% No 0%
PERFORMANCE MANAGEMENT AND DEVELOPMENT SYSTEM 69
Table 13
Question 9: I Have Performance Objectives That Are Within My Control
Variable Percentage of respondents
Yes 89% No 11%
Table 14 shows that 60% of the participants agreed that they get beneficial feedback, while 40% disagreed. The 40% who disagreed to get beneficial feedback may be underperforming employees who often get negative feedback based on unsatisfactory performance.
Table 14
Question 10: I Receive Beneficial Feedback on My Performance
Variable Percentage of respondents
Yes 60% No 40%
As illustrated in Table 15 below, 31% of the respondents said no to that there are opportunities for them to develop their skills. The rest of the sample agreed (69%). These could be that individuals are well developed and well suited to benefit from PMDS.
Table 15
Question 11: There Are Opportunities for Me to Develop My Skills
Variable Percentage of respondents
Yes 69% No 31%
Table 16 indicates that 48% of the respondents were not satisfied with opportunities available for them to develop their careers, while 52% agreed. For those who disagreed, it could be that they still need more training to develop and like the work they do.
Table 16
Question 12: I Am Satisfied With Opportunities Available for Career Development
Variable Percentage of respondents
Yes 52% No 48%
Table 17 indicates the percentage of employees who are always motivated to attend development programmes. The figures show that of the 90 respondents, 73% agreed that they are always looking forward to attending development programmes while the 27% disagreed.
Table 17
Question 13: I Am Always Motivated to Attend Development Programmes
Variable Percentage of respondents
Yes 73% No 27%
PERFORMANCE MANAGEMENT AND DEVELOPMENT SYSTEM 70
them, or the other reason could be that they are motivated to do more. The rest of the sample (28%) disagreed.
Table 18
Question 14: I Am Satisfied With the Assessment of My Performance
Variable Percentage of respondents
Yes 72% No 28%
As illustrated in Table 19, 59% of the respondents agreed that they have attended PMDS training, while the remaining 41% disagreed. Most of the respondents who disagreed (41%), as observed, may be interns and newly appointed officials in the public service.
Table 19
Question 15: Have You Attended Any PMDS Workshop or Training
Variable Percentage of respondents
Yes 59% No 41%
Open-Ended Question
The questionnaires handed out to employees for the sample had only one open-ended question. Responses to this question were categorized accordingly, coded into numerical data descriptions, and analyzed accordingly. These responses are presented in a bar graph below.
Figure 1. Question 16: What can be done to improve PMDS and your individual performance.
30 29
7 7
4 3
PERFORMANCE MANAGEMENT AND DEVELOPMENT SYSTEM 71
Figure 1 above is an illustration of how the sample responded to the open-ended question. The responses were analyzed under relevant themes. From the graph, the majority which was 30 respondents wanted to attend more training and workshops and need development. The reason for this might be that individuals want to learn and develop more in relation to the work they do. Seven of the respondents wanted fair scoring or moderation on their performance, while the other seven said they wanted proper mentoring by their managers. Four respondents from the sample stated that they needed incentives to be put in place. Of the sample drawn, 29 did not write anything or just “N/A”.
Findings and Discussion of Results
The researchers find the following in relation to the main research questions posed:
Are There Incentives to Motivate Employees
Questions 1, 11, and 15 of the questionnaire attempted to determine what the sample drawn thought about the abovementioned statement. Many of the respondents in relation to the data analyzed agreed to these questions. In the data analyses with regard to question 1, 32.22% of the sample agreed that they have incentives put in place. This explains why just a few of the respondents strongly agreed. These are employees who need to be more informed of the incentives put in place provided they perform according to set standards. Question 11 also relates to the above statement, where 69% of the respondents agreed. This could be because these employees are well aware of which incentives are there and are satisfied, although the 31% need to be motivated more to take opportunities available to make use of incentives. Lastly, question 15 indicates that 59% of the respondents agreed that they have attended PMDS training; the rest of the sample disagreed. These are employees who need to attend training for them to be equipped with more PMDS knowledge.
What Is the Extent of Objectivity in the Appraisal of Employees
Questions 5, 7, 8, and 9 of the questionnaire were put in place to establish whether there is fairness in how employees are appraised. Question 5 was set to determine whether employees find their work stimulating, where only 2.22% of respondents strongly disagreed. These employees need to be guided by supervisors to find ways of making their job stimulating. Question 7 tried to establish whether the current PMDS is effective. Out of the sample drawn, 31% agreed, followed by 29% respondents who remained neutral. The 20% of the respondents disagreed; these included those respondents who said PMDS should be scrapped in the open-ended question. Question 8 reflected on whether or not employees understand their work. All 90 respondents said yes. Lastly, question 9 tried to establish whether employees have performance objectives that are within their control. From the sample used, 89% respondents said yes, while 11% respondents said no.
How Often Performance Is Evaluated
Questions 3 and 14 tried to establish how often employee performance is evaluated. In question 3, 46% of the respondents agreed that their work is evaluated as per their work plan, while 3% strongly disagreed. This shows that the department needs to put more time in ensuring that the 3% should be more informed to satisfy their work needs. Question 14 showed that over 50% of participants are satisfied with how they are assessed.
How Does the Role of Management Influence Employee Performance
PERFORMANCE MANAGEMENT AND DEVELOPMENT SYSTEM 72
disagreed, and the reason could be that there is no clear communication between employee and supervisor. Question 4 on the other hand tried to evaluate whether managers influence performance of employees positively. The 17.78% strongly agreed and 6.67% strongly disagreed. This indicates that supervisors and employees need to establish clear working relations. Lastly, question 13 established whether employees are motivated to attend development programmes. Motivation in the workplace is mostly developed by supervisors and managers. Out of 90 respondents, 73% agreed that they are motivated to attend more development programmes, and this shows that employees are eager to learn more about PMDS.
Is There Sufficient Action Taken to Improve Performance Appraisal
Questions 6, 10, 12, and 16 attempted to discover whether there is sufficient action taken to improve personal performance of employees. Question 6 probed whether sufficient action is taken to improve individual performance of employees. From the respondents, the majority (40%) ticked neutral. The reason for this might be due to lack of communication between supervisor and employee, or even time constraints. Question 10 stated that I receive beneficial feedback on my performance. The 60% of the respondents agreed that they get beneficial feedback, while 40% disagreed. Many employees find it motivating to receive beneficial feedback from their supervisor on their work. This gives them motivation to do more and achieve greater standards. Question 12 established that employees are satisfied with opportunities available to develop their careers. Out of the 90 participants, 52% agreed that they are satisfied, while 48% disagreed. The reason for this might be that employees are not happy with the work they do.
Lastly, question 16 was an open-ended question which tried to establish what can be done to improve PMDS in the department. Many respondents (30) stated that they needed more training, which is what the department needs to put in place. Seven respondents stated that they needed fair scoring or moderation. Many employees do not get fair scoring due to the fact that supervisors give them a low score for them not to get a performance bonus. The other reason could be a huge workload that does not allow employees to do all their work on time. This can be circumvented by setting targets or standards that are within the employees’ control for them to perform better.
Conclusions and Recommendations
(1) With regard to training, the Office of the Premier needs to come up with a survey to establish which employees need PMDS training;
(2) Newly appointed managers and employees should undergo PMDS training within 30 days after they have been employed into the Office;
(3) Employees should be given a chance to voice out their opinion with regard to being assessed; this will assist with knowing which areas need improvement for better performance in the long run;
(4) PMDS workshops should include assessment instruments to provide both employees and managers with the opportunity for them to assess themselves for all training they have attended;
(5) After concluding PMDS training, the Office of the Premier should ensure that employees understand how their individual performance impacts the overall productivity, through regular assessments;
PERFORMANCE MANAGEMENT AND DEVELOPMENT SYSTEM 73
References
Antonius, R. (2003). Interpreting quantitative data with SPSS. London: Sage Publishers.
Brace, B. (2013). Questionnaire design: How to plan, structure and write survey material for effective market research. Britain: Kogan Page Publishers.
Bryman, A. (2008). Social research methods (3rd ed.). Cape Town: Oxford University Press.
Brynard, P. A., & Hanekom, S. X. (2006). Introduction to research in management related fields (2nd ed.). Pretoria: Van Schaik Publishers.
Creswell, J. (2013). Research design: Qualitative, quantitative, and mixed methods approaches. New York: Sage Publications. Daniel, J. (2011). Sampling essentials: Practice guidelines for making sampling. United States of America: Sage Publishers. Johnson, B., & Christensen, L. (2010). Educational research: Qualitative, quantitative, and mixed method. United States of
America: Sage Publishers.
Makamu, N. I. (2016). Assessment of performance management and development system in selected South African national government departments. Unpublished thesis, North-West University, Mafikeng, South Africa.
Newman, M, C. (2004). Quantitative methods in aquatic ecotoxicology. United States of America: CRP Press.
Journal of US-China Public Administration, February 2017, Vol. 14, No. 2, 74-82 doi: 10.17265/1548-6591/2017.02.002
Micro Retail Enterprises in China: Challenging the Stereotype
Walter Huber, Martin Brady, Qin Deng, Xinxin Wei, Man Zhang, Ruizhen Zhang, Xiaoxuan Zhang Muskingum University, Ohio, USA
Micro Retail Enterprises (MREs) are ubiquitous in cities and countryside of China. They are however generally
ignored in the literature and generally lumped with Small and Medium Enterprises (SMEs). MREs are unique in a
number of key ways and how they have responded to the slowing economy in China has yet to be examined. This
paper seeks to shed light on how MREs have dealt with the changes in China’s economy. Not all sectors of the
economy have responded the same to China’s “new normal” growth during the past year. The authors conducted
1,440 surveys of MREs in seven cities and gathered data on access to bank loans, acceptance of credit cards, which
business strategies they adopted, and which government programs would provide the most assistance to them.
Results suggest that MREs are much more likely to have access to loans, use credit cards, and employ sophisticated
business strategies than previously thought.
Keywords: micro retail enterprise, China’s retail sector, bank loans, credit card use in China
China has long been characterized by fast economic growth and while it is still growing at a pace much of the developed world economies can only envy, there is no doubt that China’s growth is slowing. As the University of Pennsylvania’s Warton School’s Public Policy Pacific Asia blog argued,
For much of the past year, Chinese President Xi Jinping has been urging his country to stay cool in the face of China’s “new normal” of slower economic growth. “We must boost our confidence, adapt to the new normal conditions based on the characteristics of China’s economic growth in the current phase and stay cool-minded”, he said last May. On January 19, the National Bureau of Statistics announced that the country’s 2014 GDP growth rate came in at 7.4%—slightly higher than an expected rate of 7.3%, but below Beijing’s 7.5% target range. This year’s target is set even lower at 7%. (University of Pennsylvania’s Warton School, 2015)
The new normal of comparatively slower economic growth has proven real. The Chinese economy’s 6.7% average economic growth rate in 2016 was the lowest rate of growth for the Chinese economy since 1990 (BBC News, 2017).
Corresponding author: Walter Huber, Ph.D., professor of Political Science, Department of Political Science and director of the Center for Regional Planning and Development, Muskingum University, Ohio, USA; research fields: education policy, economic policy, environmental policy, political economy, comparative public policy.
Martin Brady, MAcc, CPA, CMA, CFM, professor of Accounting, Department of Economics, Accounting, and Business, Muskingum University, Ohio, USA; research fields: financial accounting and managerial/cost accounting.
Qin Deng, B.A. candidate, Mathematics and Economics, Muskingum University, Ohio, USA; research fields: economic policy, mathematics.
Xinxin Wei, B.A. candidate, Accounting, Muskingum University, Ohio, USA; research fields: economic policy, accounting. Man Zhang, B.A. candidate, Digital Media Design, Muskingum University, Ohio, USA; research fields: marketing, China’s economy.
Ruizhen Zhang, B.A. candidate, Business Management, Muskingum University, Ohio, USA; research fields: economic policy, management.
Xiaoxuan Zhang, B.A. candidate, Business Management, Muskingum University, Ohio, USA; research fields: economic policy, management.
MICRO RETAIL ENTERPRISES IN CHINA 75
Given the size of China’ economy, the effect of this slowing growth will reverberate around the world in a number of ways. The effects inside China will be even greater and more immediate. China has responded to the slowing growth in a proactive fashion and is committed to doing all possible to mitigate any number of negative externalities that might arise from slowing growth. So far, the Chinese government has put forth a number of policies and backed them with a substantial amount of public money but most efforts are intended to make changes at the macroeconomic level such as the “One Belt One Road” initiative (an international trade route linking China to the Middle East and Europe) (Tsao, 2015). While the government has put forth some policies intended to assist small businesses including a reform to the Value Added Tax (VAT) intended to decrease tax payments for smaller mainland firms (Ren, 2016). While policies such as these are no doubt of benefit to some, there are several categories of businesses being left out.
Effects of a Slowing China
The effect of the economic slowdown in China on each business sector is not the same. According to the Financial Times, China’s official manufacturing purchasing managers’ index fell to 49 in February 2016 from 49.8 in January 2016, equaling its weakest since February 2009 and the seventh straight month of decline (Waldmeir, 2016). However, not all sectors are faring the same and broad economic data can hide as much as it reveals. For example, the catering and the retail industries present unusual trends. China’s National Bureau of Statistics released data that demonstrated that in 2015, China’s catering industry sales grew 11.7%. Despite overall downward pressure on the economy and a tightening of official’s use of luxury services, the catering industry is growing (Feng, 2016).
Overall, China’s economy has been slowing. China’s economy grew by 6.7% in 2016, compared with 6.9% a year earlier, according to official data, marking its slowest growth since 1990 (BBC News, 2017). The slowdown in China’s growth has become a major worry to the business sector. A recent survey of CFO of Chinese companies found that 48% of interviewees considered the economic slowdown as the major macro-economic issue that held the potential to undermine their business (J.P. Morgan, 2016).
Growth of the retail sector overall has declined steadily since 2012. There is pressure on retail stores including department stores and specialty retails in order to keep sales high. However, the growth of club stores and convenience stores has placed pressure on traditional retail stores to maintain profitability (2016 Present Situation Analysis of China’s Retail Industry and Trend of Development, 2016). According to the Report on the Development of China’s Convenience Store, convenience stores still show potential for growth, albeit slower, as the entire retail industry grows and inevitably slows from the economic slowdown. “Retail sales in China rose 9.5 percent year-on-year in January-February of 2017, it was the weakest growth on record from 2010 to 2017” (China Retail Sales, 2017). In addition, new entrants concentrated on low-tier cities where competition is less intense. Comprehensive analysis of the data shows that the convenience store industry is still in its second expansion (Gai, 2015). While several sectors of retail have outperformed the industry as a whole, overall growth is slowing.
Small and Very Small Enterprises
MICRO RETAIL ENTERPRISES IN CHINA 76
of SMEs in China is their contribution to the improvement of the rate of employment. SMEs are the main channel for job creation and lessen the unemployment pressure” (Wang, 2004, p. 36). The ability of SMEs to mop up recently laid-off state workers is especially important at a time when China is seeking to reduce excess capacity in a number of sectors dominated by state-owned firms such as coal mining and steel manufacturing. Since the reforms of 1978, SMEs have grown to become an essential part of the Chinese economy. In terms of China’s private sector, it is the main driver of economic growth: SMEs contributed about 59% of GDP and represented more than 65% of the imports and exports in China (Liu, 2008). Although SMEs play an outsized role in the economy, the government does not currently have adequate legislation to support the growth of SMEs which is correlated with China’s SMEs’ generally having a lower degree of specialization and cooperation in production areas (Dudovsky, 2012). The lack of government policies regarding SMEs has created unintended challenges and barriers for SMEs’ growth (Mu, 2003).
Problems with crafting policy proposals to assist SMEs are compounded by the broad range of economic activity SMEs in China cover. Originally, in China, the definition of SME was
Written in the Law of the People’s Republic of China on Promoting Small and Medium-Sized Enterprises. In accordance with Article 2 of the Law, SMEs refer to various enterprises which are established with the Territory of the People’s Republic of China (PRC), and owned by different entities and in various forms, with small and medium production and operation size, excluding those enterprises whose 25 percent stock ownership or investment are held by a large-sized enterprise. (Wang, 2004, p. 35)
The most recent change to the Law of the People’s Republic of China on Promoting Small and Medium-Sized Enterprises was in 2017. SMEs engaged in manufacturing are defined as having fewer than 100 employees and assets of no more than 30 million RMB. For other industries, SMEs are defined as having fewer than 80 employees and assets of no more than 10 million RMB (Liu, 2008).
Small firms and enterprises are beginning to play an increasing and important role in the development of China’s economy (Siu, 2001). CBRC (China Banking Regulatory Commission) states that the official number of SMEs in China exceeded 12 million in 2005 which accounted for 99% of private sector companies and they contributed more than 50% of the GDP in 2005, more than 48% of overall tax collected by the government came from SMEs in China (CBRC, 2006). Most SMEs operate mainly in labor-intensive small and medium industries because they lack access to technology and funding (Li, Guo, Liu, & Li, 2007). Liu and Huang (2016) indicated another distinct characteristic that Chinese entrepreneurs tend to operate businesses that are small in scale and the majority of entrepreneurs hired no employee outside of their families.
MICRO RETAIL ENTERPRISES IN CHINA 77
infrastructure, therefore the government has started to support them in the same way as publicly-owned companies.
To its credit, the PRC has adopted a number of effective measures to assist SMEs in general. For example, China’s Ministry of Science and Technology adopted the Law of Small and Micro Enterprises Promotion. The law created a number of programs for SMEs including financial subsidies, tax credits, preferential procurement, loan assistance, business counseling, and entrepreneurial training programs (Liu & Huang, 2016). Policies of these sorts will be helpful to a broad group of companies but there is at least one sector that has received scant attention: Micro Retail Enterprises (MREs).
A MRE in China is defined by the authors of this paper as a private owner-operated non-franchise retail business with a single location with fewer than five employees outside of members of the owner’s family. They are ubiquitous in China and take the form of venders setting up shop on the sidewalk, small souvenir stands, specialty retail stores (e.g. flower shops), convenience stores, small restaurants, service providers (e.g. barbers), and venders of household goods (e.g. plumbing supplies). These entrepreneurs have different problems than comparatively larger SMEs. To cite one instance, unpaid bills have become a problem in China once again (Liu & Huang, 2016). This is of concern to the broader economy since triangular debt (solvent companies being dragged into bankruptcy because insolvent creditors do not pay their accounts payable bills in a timely fashion) exacerbated the Asian Financial Crisis of the 1990s. This is less of a concern for MREs than SMEs since they are less likely to have accounts payable accounts.
By surveying 1,440 MREs in seven Chinese cities, this paper examines how MREs in general, and by sector, have been affected by and responded to the new normal of slower economic growth. Understanding how these businesses are affected and coping is of particular importance because along with being a pressure release for layoffs in the SOE (state-owned enterprises) sector, they are an engine of growth. In China, the majority of privately held firms are being as small-scale family owned and operated businesses (Pistrui, Huang, Oksoy, Jing, & Welsch, 2001).
Research Design
The authors conducted a survey of 1,440 MREs in seven cities in China. A 10-question instrument was developed and translated into Mandarin. Surveys were administered in person during a six-week period in June and July of 2016. Surveys were administered in the cities of Xi’an, Lanzhou, Beijing, Shenzhen, Fangchenggang, Chengdu, and Jinchang. The cities were chosen to provide geographic and economic diversity. Xi’an, Lanzhou, and Jinchang are located in northwest China, Beijing is located in north China, Shenzhen is in south China, Chengdu is located in the southwest, and Fangchenggang is located on the coast. Beijing and Shenzhen are first-tier cities, Chengdu and Xi’an are second-tier cities, Lanzhou is a third-tier city, and Fangchenggang and Jinchang are prefecture level cities.
The first part of the survey had two questions. MREs were classified into one of seven types of business: convenience store, souvenir, specialty retail, restaurant, vender, service, and household good stores. Second, MREs were asked whether sales and expenses were up, down, or stagnant compared to a year ago. The authors broke this into a question on whether sales were increasing, decreasing, or unchanged compared to last year and whether costs were increasing, decreasing, or unchanged compared to last year.
MICRO RETAIL ENTERPRISES IN CHINA 78
access to credit, whether they wanted easier access to credit, and how they would use a loan (pay off debt or grow their business). Respondents were asked whether they accepted credit cards and for those who did not, the authors asked the reason. Respondents were also asked whether suppliers allowed them a grace period to pay for goods and services. The goal of this section was to gauge access to credit for MREs and how they were connected to the digital economy.
The final section of the survey asked respondents which business strategies they used in the past six months and what type of government program would be of the most help to them. These questions sought to better understand both how MREs are coping with a changing economy and what types of programs would be of the most assistance to them.
Results
The authors surveyed a total of 1,440 MREs (259 convenience stores, 115 souvenir, 177 specialty retail, 241 restaurants, 195 venders, 217 service providers, and 230 household good stores with 9 declining to be classified). A total of 38.3% of the businesses surveyed reported declining sales, 32.6% reported rising sales, and 29.1% reported flat sales. Of those surveyed, costs were lower than the previous year for 11.6%, higher for 46.6%, and flat for 41.7%. A chi-square test to determine whether higher costs were associated with higher (or lower) sales determined that there was no significant relationship between the variables. MREs with rising costs did not report a reduction in sales and those with falling sales did not report higher input costs.
Despite anecdotal reports that small businesses have a very hard time getting bank loans, 41.6% of respondents reported that they did have a current loan from a bank to support their business. A chi-square test revealed differences in the types of MREs likely to have a bank loan, with souvenir stores and restaurants less likely to have a loan and venders much more likely to have a loan and convenience stores somewhat more likely to have a loan than would be expected. The generated chi-square of 17.543 was significant at the 0.01 level (p = 0.007). Those who had a loan from a bank were (as expected) more likely to believe that bank loans were easier to get (chi-square of 26.837, p = 0.000). Additionally, those MREs that had a loan from the bank were also more likely to accept bank cards than those that did not have a bank loan (chi-square of 48.271, p = 0.000), likely because of their relationship with a bank that issued the loan or credit card.
A surprising 59.2% of MREs accepted bank cards and almost half that did not; 20.1% of the total surveyed were considering accepting them in the future. Of the 40.8% that did not accept bank cards, 27% felt that the service fee was too high, 11% lacked easy access to the machine, 31.5% cited personal reasons, and 21.3% reported they did not know how to gain access. The adoption of bank cards by MREs is important since just a few years ago, studies found that acceptance of bank cards by retailers was limited. This phenomenon was in conflict with the desires of Chinese consumers who have gradually accepted the convenience of bank and credit cards (Li, Chao, Hui, & Zhou, 2014).
MICRO RETAIL ENTERPRISES IN CHINA 79
were surprised at the high rate of bank card acceptance by MREs given that the figures were quite low just a few years ago. Clearly, the situation has changed and future research should consider to what extent MREs find acceptance of credit cards to be beneficial to their bottom line.
Only 28.9% of MREs surveyed have a grace period before their suppliers demand payment for all goods. For 22.4%, it varies by supplier, and 48.7% of those surveyed must pay immediately. Interestingly, this is actually good for MREs in general since the payment on accounts payable in China shifted upward from an average of 54 days in 2015 to 83 days in 2016. This can trigger a triangular debt crisis but the lack of accounts payable by so many helps insulate MREs from this problem.
Looking at different business strategies MREs might adopt, the authors found that in the six months prior to the survey being administered, 36.3% increased their hours of operation, 34.2% lowered prices, 13.6% reduced staff, 20.8% expanded their business, 30.0% advertised, and 41.9% ran a promotion. Using chi-square, the authors analyzed the effect of the type of business, whether they had a current bank loan, changes to sales, changes to costs, and whether they accepted bank cards in terms of any influence it might have on which business strategy they would employ.
For type of business, two chi-squares were significant at the 0.01 level. For increasing their hours of operation, the authors found that venders and service were more likely to adopt this strategy than expected and home suppliers were less likely to adopt this strategy (chi-square of 26.055, p = 0.000). The authors also found a significant difference in whether they chose to advertise in the previous six months. Restaurants were more likely than expected to adopt this strategy and convenience stores and venders were less likely than expected (chi-square of 17.590, p = 0.007). The authors looked for differences in business strategy by whether the MREs had a current bank loan but found no significant differences at the 0.01 level.
MREs did respond differently depending on whether sales rose or fell compared to the previous year. For MREs that experienced lower sales, they were more likely to lower prices (chi-square of 31.840, p = 0.000), less likely to expand their business (chi-square of 14.810, p = 0.001), and less likely to advertise (chi-square of 10.000, p = 0.007). For MREs that reported higher costs than the previous year, there were no significant differences in the types of business strategy they would adopt. Finally, the authors looked whether MREs that accept bank cards are different in the types of business strategies they adopt compared to MREs that do not accept bank cards. The data revealed three key differences. Those that accepted bank cards were more likely to have increased their hours of operation (chi-square of 18.329, p = 0.000) and also more likely to have run a promotion (chi-square of 11.340, p = 0.003). In terms of advertising, those that are not currently accepting bank cards but are considering it, are significantly more likely to advertise than expected (chi-square of 36.325, p = 0.000).
The final question the authors asked was what type of government program would most help a business such as yours. Tax breaks for companies like mine was favored by 45%. The 20.9% wanted subsidies for consumers to encourage spending, 18.5% wanted lower rates on bank loans, and 15.6% wanted better access to loans for companies like mine.
Conclusions
MICRO RETAIL ENTERPRISES IN CHINA 80
sector. As entrepreneurship in China continues to grow, this sector will become even more important. This study provides an early look at how MREs are faring in a slowing Chinese economy.
At one level, it may seem surprising that they are generally doing well overall and less than 40% are experiencing slower sales. This is likely because the slowdown of the economy has been sharpest in the extractive mining industry, the manufacture of steel and related industries. Smaller retail enterprises appear to have been less impacted. This is not entirely surprising. Many of the retail services and products MREs sell (e.g. haircuts, inexpensive meals for workers, etc.) are less prone to economic slowdowns. The larger than expected percentage of MREs reporting they have a bank loan is surprising. It runs counter to most accounts and raises questions as to why the results are not in line with what would be expected. Three possibilities emerge. It is well established that state-run banks have been directed (or at a minimum encouraged) to issue loans to state-run firms. First, it is possible that changes banks have enacted during the past several years to become more orientated toward service have resulted in more loans being given to small businesses than previously thought. Second, it is possible that banks have been giving out loans to both preferred state-run firms and small loans to MREs. Third, it is possible that respondents conflated the question “Do you currently have a loan from the bank to support your business?” with a broader question of whether they have a loan from any entity to support their business. Additional research will be needed to tease out which of the three possibilities is supported by evidence.
The adoption rate of bank cards by MREs is very impressive, compared to research conducted just three years ago. There is an explosion of a non-cash economy and it appears that MREs are more sophisticated in adopting new technology than some may have previously thought. For those that do not yet use bank cards, almost half plan to do so in the future. This finding is encouraging but was unexpected. Future surveys of MREs should include a question on whether the adoption of credit cards was a strategy put in place to increase or to maintain sales to better judge how quickly bank card acceptance is for retail business success. For those that do not yet accept bank cards, over 20% report that they do not know how to gain access. It appears that banks, which increasingly are moving to seek profits from services would benefit from an information campaign aimed at MREs to better educate them in how to access bank card machines.
While differences were noted in which MREs adopted different business strategies, the most popular strategy overall was to run a promotion (41.9%). Between 30 and 39 percent of MREs increased their hours of operation (36.3%), lowered prices (34.2%), or advertised (30.0%). The two least popular strategies were to expand the business (20.8%) or to reduce staff (13.6%). Changes to the structure of the business are less popular business strategies in today’s China for MREs and they seem to be adopting aggressive strategies to lure business and remain convenient for their customers.
MICRO RETAIL ENTERPRISES IN CHINA 81
but only 15.6% of those surveyed identified it as the most pressing issue for their business.
This paper’s findings suggest that: there may be some emerging changes in China’s credit market; bank cards are much more ubiquitous than previously thought; MREs have better access to credit than previously imagined by most; and the story of a slowing Chinese economy is much less uniform than previously imagined. Given how few studies exist on Chinese MREs, more field work is needed to confirm these findings. Although the authors conducted 1,440 surveys in seven Chinese cities, there are not enough studies done on this subject to know how representative these findings are.
References
2016 present situation analysis of China’s retail industry and trend of development. (2016). Retrieved from http://www.chyxx. com/industry/201609/447043.html
BBC News. (2017). China’s economy grows 6.7% in 2016. Retrieved from http://www.bbc.com/news/ business-38686568 CBRC (China Banking Regulatory Commission). (2006). Strengthening regulation, improving city commercial bank’s reform and
development.
China Daily. (2015). Loans to small businesses rise by 3.08t yuan in 2014. Retrieved from http://www.chinadaily.com. cn/china/2015twosession/2015-03/06/content_19744200.htm
China retail sales. (2017). Retrieved from http://www.tradingeconomics.com
Dudovsky, J. (2012). SMEs in China: Overview. Retrieved from http://research-methodology.net/small-and-medium-enter prises-in-china-overview/
Feng, Q. (2016). 2015 China’s catering industry get out of the trough and entered a new stage. Economic Daily News.
Gai, H. (2015). Chinese convenience store: Growing against economy trend. Retrieved from http://www.eeo.com.cn/2015/ 0304/272971.shtml
Gan, C. E., Cohen, D. A., Hu, B. D., Tran, M. C., Dong, W. K., & Wang, A. (2016). The relationship between credit card attributes and the demographic characteristics of card users in China. International Journal of Bank Marketing, 34(7), 966-984.
IFeng News. (2013). Small micro enterprises accounted for over 90% of the total number of Chinese companies products and services of GDP (translated from Mandarin). Retrieved from http://wallstreetcn.com/node/272959
J.P. Morgan. (2016). J.P. Morgan survey: China’s currency reforms had biggest impact on business, treasurers say. Retrieved from http://www.jpmorganchina.com.cn/country/cn/zh/detail/1320553031109
Li, S., Chao, X. Hui, L., & Zhou, Z. F. (2014). Research on simulation of credit risk of credit card based on multi-agent. Procedia Computer Science, 31, 517-522.
Li, Y., Guo, H., Liu, Y., & Li, M. F. (2007). Incentive mechanisms, entrepreneurial orientation, and technology commercialization:
Evidence from China’s transitional economy. Product Innovation Mangement, 25(1), 63-78.
Liu, C. Y., & Huang, X. (2016). The rise of urban entrepreneurs in China: Capital endowments and entry dynamics. Growth and Change, 47(1), 32-52.
Liu, X. F. (2008). SME development in China: A policy perspective on SME industrial clustering. In H. Lim (Ed.), SME in Asia and globalization (pp. 37-68). ERIA Research Project Report 2007-5. Retrieved from http://www.eria.org/SME%20 Development%20in%20China_A%20Policy%20Perspective%20on%20SME%20Industrial%20Clustering.pdf
Mu, Y. B. (2003). Impediments to SME access to finance and credit guarantee schemes in China. SSRN Electronic Journal. Retrieved from http://dx.doi.org/10.2139/ssrn.486204
Pistrui, D., Huang, W., Oksoy, D., Jing, Z., & Welsch, H. (2001). Entrepreneurship in China: Characteristics, attributes, and family forces shaping the emerging private sector. Family Business Review, 14(2), 141-152.
Ren, D. (2016). China’s VAT tax reforms are pushing small businesses to the brink. Retrieved from http://www.scmp.com/ business/china-business/article/2024061/chinas-vat-tax-reforms-are-pushing-small-businesses-brink
Shi, H., Peng, S. Z., Liu, Y., & Zhong, P. (2008). Barriers to the implementation of cleaner production in Chinese SMEs: Government, industry and expert stakeholders’ perspectives. Journal of Cleaner Production, 16(7), 842-852.
MICRO RETAIL ENTERPRISES IN CHINA 82
University of Pennsylvania’s Warton School. (2015). China in 2015: Gauging the new normal. Retrieved from http://knowledge. wharton.upenn.edu/article/gaging-the-new-normal-in-china/
Waldmeir, P. (2016). China data signal deepening slowdown. Retrieved from https://www.ft.com/content/51fa4cfe-df5b-11e5- b072-006d8d362ba3
Wall Street. (2016). The State Council: To encourage retail online mergers and acquisitions online. Retrieved from http://wallstreetcn.com/node/272959
Wang, C. L. (2009). Little emperors! The future of China’s consumer market. Young Consumers, 10(2), 95-97.
Journal of US-China Public Administration, February 2017, Vol. 14, No. 2, 83-90 doi: 10.17265/1548-6591/2017.02.003
Research on the Relationship Between Entrepreneur Human
Capital and Entrepreneurial Performance
Pingping Liu
Beijing Wuzi University, Beijing, China
The performance of entrepreneurial enterprises is mainly due to the ability level of entrepreneurial entrepreneurs
and their productive efforts. This paper firstly discusses how to solve the entrepreneurs’ capacity problem. For
different ability of entrepreneurs, the paper establishes information screening model to eliminate the asymmetric
information of the entrepreneurial capacity between venture investors and entrepreneurs. Its aim is to choose a
really good entrepreneurial entrepreneur and promote the performance of entrepreneurial enterprises. Secondly,
the paper discusses how to solve entrepreneurs’ productive efforts problem. The paper mainly studies on the
following aspects that are entrepreneurs’ gains, entrepreneurs’ control right, the need for reputation, and
supervision and restraint mechanisms. At the same time, the paper researches on the impact of entrepreneurial
productive effort on entrepreneurial performance. At last, the paper discusses the mutual influence between
entrepreneurs’ competence and their productive effort, as well as the transformation of each other under certain
conditions.
Keywords: entrepreneur, human capital, entrepreneurial performance, entrepreneur capacity, productive efforts
In the current era of knowledge economy, innovation ability has become the key to economic development. International competition comes down to the competition between intellectual resources and human capital. The key to success depends on whether human capital can be internalized into the institutional elements, thus to fully stimulate the enthusiasm of the owner of human capital and creativity (Schultz, 1992). High-tech start-up enterprises rely on the means of production which is mainly human capital. Strategic resources are become information, technology, management talent, and so on. Human capital occupies a large proportion in the total investment in enterprises. The dependence on the talents (entrepreneurial spirit of the management personnel and professional and technical personnel) is very strong. The human capital’s contribution to the growth of the enterprise is more and more big. The condition of human capital and its utilization efficiency are crucial to the success or failure of venture capital. The famous economist Schumpeter pointed out that the entrepreneur is the engine of economic development and is the source of economic development. The history of contemporary world economic development shows that entrepreneurs are a kind of special human capital in economic development. For venture capital, the impact of entrepreneurs on the start-ups is very large. “Invest in the second-rate technology and the first-class business talent is better than to invest in the first-class technology and the second-rate business talent company”, which is a golden rule for venture capital industry (Xie & Song,
Corresponding author: Pingping Liu, Ph.D., professor, Beijing Wuzi University, Beijing, China; research fields: human resource management, organizational behavior, and management science.
HUMAN CAPITAL AND ENTREPRENEURIAL PERFORMANCE 84
2017). Therefore, the development and management on entrepreneur human capital has a great significance to promote the development of a country’s economy.
This paper sets the function of enterprises that is to achieve efficiency, and achieving fairness and other functions is by the government. Therefore, the entrepreneur’s primary function is the pursuit of business performance, evaluation of entrepreneurs and rewards and punishments are based on business performance. The performance of the enterprise comes from two internal variables: the entrepreneur’s ability level and the entrepreneur’s productive effort. Meanwhile, it is also related to the external factors such as quantity and quality of resources and random factors of the environment. Variables work together on firm performance (Yang & Xu, 2017). This paper discusses how to address entrepreneurial competencies and their productive efforts and their relationship to business performance, and discusses the interplay between the two.
The Level of Entrepreneur’s Ability
Many scholars believe that entrepreneurs are the most important for the entrepreneurial enterprises. Entrepreneurs’ abilities, such as management ability, marketing ability, risk prediction ability, and technological innovation ability, have a huge impact on the future success of the enterprises. The ability to correctly and effectively evaluate entrepreneur’s competence is an important factor affecting the performance of entrepreneurial enterprises. Whether to correctly and effectively evaluate the ability of entrepreneurs is an important factor affecting the performance of enterprises. From the perspective of agency theory, that is how to overcome the adverse selection problem caused by the prior information asymmetry. This is because the ability of entrepreneurs in most cases is private information, as there is no general business history as a reference, and the ability is difficult to identify. Therefore, efforts should be made to take various measures to obtain information and improve its effectiveness to solve the problem of hidden information. At the same time, entrepreneurs have the enthusiasm to show their true information and their ability level (Sahlman, 1988). It can set up information screening model for entrepreneurial entrepreneurs with different abilities, and establish optimal contract arrangement for entrepreneurs with different abilities (Liu, 2009).
When venture capital is introduced into the venture enterprises, venture capitalists will be given part of the control and residual claims as the price. Therefore, entrepreneurial entrepreneurs of different abilities are very concerned about the proportion of residual claims
E and control rights
E . While high-abilityentrepreneurs pay more attention to the proportion of control rights, low-ability entrepreneurs pay more attention to residual claims. More generally, there are
E2
E1,
E2
E1. In entrepreneurial investment,the observable variable has only the final output
. For different
, the entrepreneur has a psychological expectation value for
E,
E, thus deciding a certain utility functionU
E,
E
. Therefore, with
asthe
x
-axis andU
E,
E
as they
-axis, it can establish a coordinate system, and in the coordinate system, we can get the equal utility curves of entrepreneurial entrepreneurs with different abilities. And there are the only separation equilibrium solutions about high-capacity and low-capacity entrepreneurial entrepreneurs.HUMAN CAPITAL AND ENTREPRENEURIAL PERFORMANCE 85
entrepreneurs to participate in venture capital investment activities, it must meet two conditions: The first is the participation constraint (IR), that is, the deterministic equivalence income of entrepreneurial entrepreneur involvement in venture capital investment should be greater than the income (opportunity cost) of the selected selling technology, and employed by other firms, that is IR
E
E. The second condition is incentivecompatibility constraint (IC), that is, the optimal equivalence income of
,
E, and
E
obtained by entrepreneurial entrepreneur should be greater than the deterministic equivalence of any
,
E, and
E.And also, it should be greater than the use of other means of financing (such as loans) income, at this time, there is IC
MaxE
E. In this way, the model of optimal residual claim and control arrangement betweenventure capitalist and entrepreneur can be obtained, and the corresponding combinations of
(entrepreneur ability),
E, and
E of different ability entrepreneurs are obtained, and identify the entrepreneur’s ability. Inthis way, it can eliminate the asymmetry information between venture capitals and entrepreneurs on the ability of entrepreneurs, but also be conducive to the choice of really good entrepreneurial entrepreneurs, and promote entrepreneurial enterprises to improve performance.
The Productive Efforts of Entrepreneurs
The factors influencing the entrepreneurial entrepreneur effort include the following: the income of the entrepreneur, the size of the control of the entrepreneur, the need of reputation, and the supervisory and restraining mechanism; these aspects work together on entrepreneurial productive efforts.
Entrepreneurs’ Gains
Due to the high degree of uncertainty in the start-up enterprises, the management, technology, and market problems are very complicated. The problem of the information asymmetry and the moral hazard between the principal-venture capitalist and the agent-entrepreneur is serious, thus leading the difficulties of the principal supervising the agent. Moreover, the interests of the two are non-complete consistency, and also make it possible for that the agent may be in their own interests at the expense of the principal interests. Therefore, we must establish an effective remuneration mechanism to regulate the agent’s business behavior, to ensure that the operator does not deviate from the profit maximization goal, so that the entrepreneur will be from the self-motivation to act in line with the interests of the principal action, that is to achieve the compatibility between the principal interests and the interests of entrepreneurs.
HUMAN CAPITAL AND ENTREPRENEURIAL PERFORMANCE 86
From the perspective of the human capital property rights of the entrepreneur, the stock system is not only an incentive problem, but a further recognition of the property rights of human capital issues; recognition of human capital and material capital has the status of equal wealth creation. Entrepreneurs with human capital should have residual rights to operate the business (Guo & Yang, 2015). With the development of economy and society, material wealth has been continuously enriched, and the leading role of human capital in economic development has been continuously strengthened. Human capital, especially entrepreneur human capital is more scarce and important. Entrepreneur human capital has more advantages during the game process between human capital and material capital. Entrepreneurs by virtue of their business skills enjoy the surplus of business which is an inevitable trend. Of course, in practice, property rights and their size are often determined by the repeat game of a variety of human capital owners and physical capital owners. The residual claim and the size of the residual claim are the result of all the parties involved in the enterprise contract game playing the role of risk preference, scarcity, collateral, supervision, and game ability.
The Control Right of Entrepreneur
Although entrepreneur’s income has a direct incentive, but the right to control has a more important significance to the entrepreneur. In the process of development of the start-up enterprises, the technology, product, market, management, and so on have the very high uncertainty. In the investment operation process, it has the information asymmetry, as well as the moral hazard which produces, and this will cause the venture investment contract to be more incomplete (Hart & Moore, 1988). In the case of incomplete contracts, the allocation of control rights of entrepreneurs is very important. In fact, the issue of control is very complex in entrepreneurial firms, and the distribution of control over entrepreneurs and venture capitalists depends on information asymmetry, skills, participation constraints, control gains, bargaining ability, and many other factors (Hellmann, 1998). Entrepreneurs’ objectives in the distribution of control include: leading enterprises, reasonable income, and higher consumption levels of working. By introducing the continuous variable of control right, we can study the results of the allocation of control rights between investors and entrepreneurs. At the same time, we analyze the important factors that affect the distribution of control rights.
If a venture capitalist invests in a start-up firm by buying a certain number of shares
of the price
. He expects to offer the start-up firm the lowest price and the largest stake, while the entrepreneur expects to offer the investor the highest price and the minimum proportion of shares. Therefore, the venture capitalist’sstrategy is to develop the optimal