Computing Networks
from cluster to cloud computing
Pascale Vicat-Blanc
Sébastien Soudan
First published 2011 in Great Britain and the United States by ISTE Ltd and John Wiley & Sons, Inc. Apart from any fair dealing for the purposes of research or private study, or criticism or review, as permitted under the Copyright, Designs and Patents Act 1988, this publication may only be reproduced, stored or transmitted, in any form or by any means, with the prior permission in writing of the publishers, or in the case of reprographic reproduction in accordance with the terms and licenses issued by the CLA. Enquiries concerning reproduction outside these terms should be sent to the publishers at the undermentioned address:
ISTE Ltd John Wiley & Sons, Inc. 27-37 St George’s Road 111 River Street London SW19 4EU Hoboken, NJ 07030
UK USA
www.iste.co.uk www.wiley.com
© ISTE Ltd 2011
The rights of Pascale Vicat-Blanc, Sébastien Soudan, Romaric Guillier, Brice Goglin to be identified as the authors of this work have been asserted by them in accordance with the Copyright, Designs and Patents Act 1988.
____________________________________________________________________________________ Library of Congress Cataloging-in-Publication Data
Reseaux de calcul. English
Computing networks : from cluster to cloud computing / Pascale Vicat-Blanc ... [et al.]. p. cm.
Includes bibliographical references and index. ISBN 978-1-84821-286-2
1. Computer networks. I. Vicat-Blanc, Pascale. II. Title. TK5105.5.R448613 2011
004.6--dc22
2011006658 British Library Cataloguing-in-Publication Data
A CIP record for this book is available from the British Library ISBN 978-1-84821-286-2
Introduction . . . 13
Chapter 1. From Multiprocessor Computers to the Clouds . . . 21
1.1. The explosion of demand for computing power. . . 21
1.2. Computer clusters . . . 24
1.2.1. The emergence of computer clusters . . . 24
1.2.2. Anatomy of a computer cluster . . . 24
1.3. Computing grids . . . 26
1.3.1. High-performance computing grids . . . 29
1.3.2. Peer-to-peer computing grids . . . 30
1.4. Computing in a cloud . . . 32
1.5. Conclusion . . . 36
Chapter 2. Utilization of Network Computing Technologies . . . 39
2.1. Anatomy of a distributed computing application . . . . 39
2.1.1. Parallelization and distribution of an algorithm . . 41
2.1.1.1. Embarrassingly parallel applications. . . 42
2.1.1.2. Fine-grained parallelism . . . 43
2.1.2. Modeling parallel applications . . . 44
2.1.3. Example of a grid application. . . 44
2.1.4.1. Widely distributed computing . . . 48
2.1.4.2. Loosely coupled computing. . . 49
2.1.4.3. Pipeline computing . . . 50
2.1.4.4. Highly synchronized computing . . . 50
2.1.4.5. Interactive and collaborative computing . . . 51
2.1.4.6. Note . . . 51
2.2. Programming models of distributed parallel applications . . . 52
2.2.1. Main models . . . 52
2.2.2. Constraints of fine-grained-parallelism applications . . . 53
2.2.3. The MPI communication library . . . 54
2.3. Coordination of distributed resources in a grid . . . 57
2.3.1. Submission and execution of a distributed application . . . 57
2.3.2. Grid managers . . . 59
2.4. Conclusion . . . 60
Chapter 3. Specificities of Computing Networks . . . 63
3.1. Typology of computing networks. . . 63
3.1.1. Cluster networks . . . 65
3.1.2. Grid networks . . . 65
3.1.3. Computing cloud networks . . . 67
3.2. Network transparency . . . 68
3.2.1. The advantages of transparency. . . 68
3.2.2. Foundations of network transparency . . . 69
3.2.3. The limits of TCP and IP in clusters . . . 72
3.2.4. Limits of TCP and network transparency in grids . . . 75
3.2.5. TCP in a high bandwidth-delay product network . . . 75
3.2.6. Limits of the absence of communication control. . . 76
3.3. Detailed analysis of characteristics expected from protocols . . . 78
3.3.1.1. Number of sites involved . . . 78
3.3.1.2. Number of users involved . . . 79
3.3.1.3. Resource-localization constraints . . . 79
3.3.2. Performance criteria . . . 80
3.3.2.1. Degree of inter-task coupling . . . 80
3.3.2.2. Sensitivity to latency and throughput . . . . 81
3.3.2.3. Sensitivity to throughput and its control . . . 83
3.3.2.4. Sensitivity to confidentiality and security . . 84
3.3.2.5. Summary of requirements. . . 84
3.4. Conclusion . . . 85
Chapter 4. The Challenge of Latency in Computing Clusters . . . 87
4.1. Key principles of high-performance networks for clusters . . . 88
4.2. Software support for high-performance networks. . . . 90
4.2.1. Zero-copy transfers . . . 90
4.2.2. OS-bypass. . . 90
4.2.3. Event notification . . . 91
4.2.4. The problem of address translation . . . 93
4.2.5. Non-blocking programming models . . . 95
4.2.5.1. Case 1: message-passing . . . 96
4.2.5.2. Case 2: remote access model . . . 97
4.3. Description of the main high-performance networks . . 99
4.3.1. Dolphins SCI . . . 99
4.3.2. Myricom Myrinet and Myri-10G . . . 100
4.3.3. Quadrics QsNet. . . 104
4.3.4. InfiniBand. . . 105
4.3.5. Synthesis of the characteristics of high-performance networks . . . 107
4.4. Convergence between fast and traditional networks . . 108
4.5. Conclusion . . . 111
Chapter 5. The Challenge of Throughput and Distance . . . 113
5.1. Obstacles to high rate . . . 113
5.2.1. Slow Start . . . 116
5.2.2. Congestion avoidance . . . 117
5.2.3. Fast Retransmit. . . 117
5.2.4. Analytical model . . . 119
5.3. Limits of TCP over long distances . . . 120
5.4. Configuration of TCP for high speed. . . 122
5.4.1. Hardware configurations . . . 123
5.4.2. Software configuration. . . 124
5.4.3. Parameters of network card drivers. . . 126
5.5. Alternative congestion-control approaches to that of standard TCP . . . 126
5.5.1. Use of parallel flows . . . 127
5.5.2. TCP modification . . . 129
5.5.2.1. Slow Start modifications . . . 129
5.5.2.2. Methods of congestion detection . . . 130
5.5.2.3. Bandwidth-control methods . . . 131
5.5.3. UDP-based approaches . . . 132
5.6. Exploration of TCP variants for very high rate . . . 133
5.6.1. HighSpeed TCP . . . 133
5.6.2. Scalable . . . 134
5.6.3. BIC-TCP . . . 134
5.6.4. H-TCP. . . 135
5.6.5. CUBIC . . . 135
5.7. Conclusion . . . 136
Chapter 6. Measuring End-to-End Performances . . . 139
6.1. Objectives of network measurement and forecast in a grid . . . 139
6.1.1. Illustrative example: network performance and data replication . . . 140
6.1.2. Objectives of a performance-measurement system in a grid. . . 143
6.2. Problem and methods . . . 144
6.2.1. Terminology . . . 145
6.2.2. Inventory of useful characteristics in a grid . . . . 149
6.2.3.1. Active method . . . 152
6.2.3.2. Passive method . . . 152
6.2.3.3. Measurement tools. . . 154
6.3. Grid network-performance measurement systems . . . 155
6.3.1. e2emonit . . . 155
6.3.2. PerfSONAR. . . 155
6.3.3. Architectural considerations . . . 156
6.3.4. Sensor deployment in the grid . . . 160
6.3.5. Measurement coordination . . . 161
6.4. Performance forecast . . . 164
6.4.1. The Network Weather Service tool . . . 164
6.4.2. Network-cost function . . . 166
6.4.3. Formulating the cost function. . . 167
6.4.4. Estimate precision . . . 169
6.5. Conclusion . . . 170
Chapter 7. Optical Technology and Grids . . . 171
7.1. Optical networks and switching paradigms . . . 172
7.1.1. Optical communications. . . 172
7.1.1.1. Wavelength multiplexing . . . 173
7.1.1.2. Optical add-drop multiplexers . . . 174
7.1.1.3. Optical cross-connect . . . 175
7.1.2. Optical switching paradigms . . . 176
7.1.2.1. Optical packet switching . . . 176
7.1.2.2. Optical burst switching . . . 177
7.1.2.3. Optical circuit switching . . . 177
7.1.3. Conclusion . . . 179
7.2. Functional planes of transport networks . . . 179
7.2.1. Data plane. . . 181
7.2.2. Control plane . . . 182
7.2.2.1. Routing . . . 182
7.2.2.2. Signaling . . . 182
7.2.3. Management plane . . . 182
7.2.4. Conclusion . . . 184
7.3.1. Label-switching . . . 184
7.3.2. Protocols: OSPF-TE/RSVP-TE/LMP/PCEP . . . 185
7.3.3. GMPLS service models . . . 187
7.3.4. Conclusion . . . 188
Chapter 8. Bandwidth on Demand . . . 189
8.1. Current service model: network neutrality . . . 190
8.1.1. Structure . . . 191
8.1.2. Limits and problems . . . 192
8.1.3. Conclusion . . . 193
8.2. Peer model for bandwidth-delivery services. . . 194
8.2.1. UCLP/Ca*net. . . 194
8.2.2. GLIF. . . 194
8.2.3. Service-oriented peer model . . . 195
8.2.4. Conclusion . . . 196
8.3. Overlay model for bandwidth-providing services. . . . 196
8.3.1. GNS-WSI . . . 196
8.3.2. Carriocas . . . 197
8.3.3. StarPlane . . . 198
8.3.4. Phosphorus . . . 198
8.3.5. DRAGON. . . 198
8.3.6. Conclusion . . . 199
8.4. Bandwidth market . . . 200
8.5. Conclusion . . . 201
Chapter 9. Security of Computing Networks . . . 203
9.1. Introductory example . . . 203
9.2. Principles and methods . . . 205
9.2.1. Security principles . . . 206
9.2.2. Controlling access to a resource . . . 207
9.2.3. Limits of the authentication approach . . . 209
9.2.4. Authentication versus authorization . . . 210
9.2.5. Decentralized approaches . . . 211
9.3. Communication security. . . 212
9.4.1. Classic network-virtualization approaches. . . 213
9.4.2. The HIP protocol . . . 215
9.5. Conclusion . . . 216
Chapter 10. Practical Guide for the Configuration of High-speed Networks . . . 217
10.1. Hardware configuration . . . 218
10.1.1. Buffer memory. . . 218
10.1.2. PCI buses. . . 218
10.1.3. Computing power: CPU . . . 219
10.1.4. Random access memory: RAM . . . 220
10.1.5. Disks . . . 220
10.2. Importance of the tuning of TCP parameters . . . 221
10.3. Short practical tuning guide . . . 222
10.3.1. Computing the bandwidth delay product . . . 223
10.3.2. Software configuration . . . 224
10.3.3. Other solutions. . . 225
10.4. Use of multi-flow . . . 226
10.5. Conclusion . . . 228
Conclusion: From Grids to the Future Internet . . . 229
Bibliography . . . 235
Acronyms and Definitions . . . 251
Since the advent of the computer in 1940, computing power needs have not ceased to increase. Today, great scientific fields such as high-energy physics, astrophysics, climatology, biology and medical imagery rely on new mutualization technologies and worldwide sharing of computer potential across international grids to meet the huge demand for data processing. Every day, researchers submit hundreds of computations to large-scale distributed infrastructures such as the European Enabling Grids for E-sciencE grid (EGEE) [EGE 04], which gathers more than 100,000 processors. Soon European Grid Infrastructure (EGI) and TeraGrid [PRO 11] in the United States will each be able to aggregate more than double this number of processors. In the near future many industrial domains, such as automobile, energy and transport, which are increasingly relying on digital simulation, will be able to benefit from large shared reservoirs of computer resources. This approach will shortly be extended to e-commerce, finance and the leisure industry.
Over the past 15 years, three key technologies have followed each other in response to this growing computing power demand. These technologies embody the revolution of network computing: computer clusters, computing grids and computing clouds. A quick definition of these is as follows:
– a computing grid is the aggregation of a very large number of distributed computing and storage resources, interconnected via wide-area networks. There are computing grids dedicated to intensive computations of data grids that store, process and give access to massive amounts of data in the order of hundreds of gigabytes or even several terabytes;
– a computing cloud provides access services to resources via the Internet. The underlying infrastructure is totally concealed from users. The available resources are generally virtual machines housed in resource centers, also called data centers.
Originally, it was the spectacular advances in transmission and communication technologies that enabled researchers to imagine these distributed architectures. These technologies made the aggregation and mutualization of computer equipment possible, which led to the rise in power of global computing. The hardware and software of interconnection networks, which are transparent in appearance, play a complex role that is difficult to grasp and not often studied. Yet the place of the network is central and its evolution will certainly be a key to ubiquitous computer systems to come.
for communication software protocols and architecture design. For example, the size of an Ethernet frame (between 64 and 1,500 bytes) – a parameter that indirectly conditions the maximum size of transfer units sent over an IP network – was defined to satisfy propagation constraints on a 200 m coaxial cable and a throughput of 10 Mbit/s. Today optical links are used and throughputs can be greater than 10 Gbit/s. At the time when the Internet Protocol (IP) was being designed, access rates were in the order of 64 kbit/s in wide-area networks. Today, optical fibers are deployed with access rates from 100 Mbit/s to 1 Gbit/s. There are links of over 100 Gbit/s in network cores.
In the Internet, since the workload is not controlled by the network itself, it is traditionally the transport layer – the first end-to-end layer – that carries out the adaptation to fluctuations in performance linked to load changes. The complexity of the transport layer depends on the quality of service offered by the underlying network in terms of strict delay or loss-ratio service guarantees. In the IP model, which offers a best-effort network service, two main transport protocols are classically used:
– a rudimentary protocol, the User Datagram Protocol or UDP, which only carries out stream multiplexing; and
– a very sophisticated reliable protocol, Transmission Control Protocol or TCP, which carries out the adaptation to packet losses as well as congestion control by send-rate control. TCP was designed for a network layer with no guaranteed quality of service (IP), for local-area networks and low-speed wide-area networks, and for a limited number of application classes.
few milliseconds) to congestion phenomena. It is not very reactive, however, in such conditions!
Over the past 10 years, a certain number of alternatives to TCP have been put forward and introduced in modern exploitation systems.
The protocol aspect is not the sole parameter to take into consideration for evaluating and improving end-to-end performance. Actually, in the very core of the communication nodes used, delays due to different data movement and control operations within a machine are significant compared to the delays encountered on the network itself (cables and routers). The heterogeneity of performance needs must also be taken into consideration.
The protocols used in the context of distributed computing have gradually became increasingly diverse because of the heterogeneity of the underlying physical technologies and applications needs. When the end-user of a cluster or a grid struggles to obtain the performance, however, he or she could expect delays with regard to the theoretical performance of the hardware used. He or she often has difficulties understanding where the problems with performance come from.
This book therefore has two objectives:
– to enable the reader who is familiar with communication networks to better understand the stakes and challenges that the new distributed computing revolution poses to networks and to their communication software;
– to enable the reader who is familiar with distributed computing to better understand the limits of current hardware and software tools, and how he or she can best adapt his or her application to the computing and communication infrastructure that is at his or her disposal to obtain the best possible performance.
To achieve these two objectives, we alternately move from one point of view to the other, introducing the core principles of distributed computing and networks and progressively detailing the most innovative approaches in these two fields.
In Chapter 1, we identify the needs, motivations and forces pushing the computer sector, over the years, towards distributed computing and the massive use of computing networks. We go into the details of the different network computing technologies that have evolved and show the technological and conceptual differences between them.
In Chapter 2 we classify distributed computing applications and analyze the communication specificities and constraints of each one of these classes of applications. In particular, we introduce the Message-Passing Interface communication library, or MPI, which is frequently used by distributed parallel application programmers.
In Chapter 3 we review the core principles of traditional communication networks and their protocols. We make an inventory of their limits compared to distributed computing constraints, which are introduced in the previous chapter. We then analyze the path of communications in a TCP/IP context.
throughput. Two types of characteristic applications serve to illustrate their aim:
– delay-sensitive parallel computing applications; and – communication-intensive, throughput-sensitive applications
In these chapters, we also discuss the direct interaction between the hardware level and the software level – a characteristic element of distributed computing.
Chapter 4 studies how the challenge of latency was overcome in computer cluster infrastructures to address the needs of applications that are very sensitive to information-routing delay between computing units.
Chapter 5 focuses on the needs of applications transferring significant masses of data in order to take them from their acquisition point to the computing centers where they are processed as well as to move them between storage spaces to conserve them and make them available to large and very scattered communities. We therefore study how the TCP protocol reacts in high bandwidth-delay product environments and detail the different approaches put forward to enable high-speed transport of information over very long distances.
Chapter 6 deals with performance measurement and prediction. It enables the reader, coming from the field of distributed computing, to understand the contributions of network performance measurement, prediction infrastructures and tools.
Chapter 7 shows how new optical switching technologies make it possible to provide a protected access to a communication capability adapted to the needs of each application.
Chapter 9 introduces the issue of security and its principles in computing networks. This chapter presents the main solutions currently deployed as well as a few keys capable of increasing user confidence in distributed computing infrastructures.
Chapter 10 proposes a few protocol- and system-parameterization examples and exercises for obtaining high performance in a very-high-speed network with tools currently available in the Linux system.
From Multiprocessor Computers
to the Clouds
1.1. The explosion of demand for computing power
The demand for computing power continues to grow because of the technological advances in methods of digital acquisition and processing, the subsequent explosion of volumes of data, and the expansion of connectivity and information exchange. This ever-increasing demand varies depending on the scientific, industrial and domestic sectors considered.
Scientific applications have always needed increasing computing resources. Nevertheless, a new fact has appeared in the past few years: today’s science relies on a very complex interdependence between disciplines, technologies and equipment.
For example, life science researchers today have to analyze enormous quantities of experimental data that can only be processed by multidisciplinary teams of experts carrying out complex studies and experiments and requiring extensive calculations. The organization of communities and the intensification of exchanges between researchers that has occurred over the past few years has increased the need to mutualize data and collaborate directly.
Thus these teams, gathering diverse and complementary expertise, demand cooperative work environments that enable them to analyze and visualize large groups of biological data, discuss the results and address questions of biological data in an interactive manner.
These environments must combine advanced visualization resources, broadband connectivity and access to important reserves of computing resources. With such environments, biologists hope, for example, to be able to analyze cell images at very high resolution. Current devices only enable portions of cells to be visualized, and this at a low level of resolution. It is also impossible to obtain contextual information such as the location in the cell, the type of cell or the metabolic state.
Another example is that of research on climate change. One of the main objectives is to calculate an adequate estimate of statistics of the variability of climate and thus anticipate the increase in greenhouse gas concentration. The study areas are very varied, going from ocean circulation stability to changes in atmospheric circulation on a continent. It also includes statistics on extreme events. It is a fundamental domain that requires the combination of a lot of data originating from sources that are very heterogeneous and by nature geographically remote. It involves the coupling of diverse mathematical models and crossing the varied and complementary points of view of experts.
phenomena (resistance of a material, wearing away of a mechanism under different types of operating conditions, etc.) using a computer program. The engineer can therefore study the operation and properties of the system modeled and predict its evolution. Scientific digital simulations rely on the implementation of mathematical models that are often based on the finite elements technique and the visualization of computing results by computer-generated images. All of these calculations require great processing power.
In addition to this, the efficiency of computer infrastructure is a crucial factor in business. The cost of maintenance, but also, increasingly the cost of energy, can become prohibitive. Moreover, the need to access immense computing power can be sporadic. A business does not need massive resources to be continuously available. Only a few hours or a few nights per week can suffice: externalization and virtualization of computer resources has become increasingly interesting in this sector.
The domestic sector is also progressively requiring increased computing, storage and communication power. The Internet is now found in most homes in industrialized countries. The asymmetric digital subscriber line, otherwise known as ADSL is commonplace. In the near future Fiber To The Home (FTTH) will enable the diffusion of new domestic, social and recreational applications based, for example, on virtual-reality or increased-reality technologies, requiring tremendous computing capacities.
Computing resource needs are growing exponentially. Added to this, thanks to the globalization of trade, the geographical distribution of communicating entities has been amplified. To face these new challenges, three technologies have been developed in the past few years:
– computer clusters; – computing grids; and
In the following sections, we analyze the specificities of these differentnetwork computing technologiesbased on the most advanced communication methods and software.
1.2. Computer clusters
1.2.1. The emergence of computer clusters
The NOW [AND 95] and Beowulf [STE 95] projects in the 1990s launched the idea of aggregating hundreds of standard machines in order to form a high-power computing cluster. The initial interest lay in the highly beneficial performance/price relationship because aggregating standard materials was a lot cheaper than purchasing the specialized supercomputers that existed at the time. Despite this concept, achieving high computing power actually requires masking the structure of a cluster, particularly the time- and bandwidth-consuming communications between the different nodes. Many works were therefore carried out on the improvement of these communications in conjunction with the particular context of parallel applications that are executed on these clusters.
1.2.2. Anatomy of a computer cluster
Server clusters or computer farms designate the local collection of several independent computers (called nodes) that are globally run and destined to surpass the limitations of a single computer. They do this in order to:
– increase computing power and availability;
– facilitate load increase;
– enable load balancing;
– simplify the management of resources (central processing unit or CPU, memory, disks and network bandwidth).
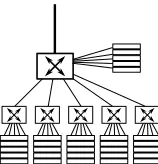
Figure 1.1.Typical architecture of a computer cluster
machines making up a server cluster are generally of the same type. They are stacked up in racks and connected to switches. Therefore systems can evolve based on need: nodes are added and connected on demand. This type of aggregate, much cheaper than a multiprocessor server, is frequently used for parallel computations. Optimized use of resources enables the distribution of data processing on the different nodes. Clients communicate with a cluster as if it were a single machine. Clusters are normally made up of three or four types of nodes:
– computing nodes (the most numerous – there are generally 16, 32, 64, 128 or 256 of them);
– storage nodes (fewer than about 10); – front-end nodes (one or more);
– there may also be additional nodes dedicated to system surveillance and measurement.
Nodes can be linked to each other by several networks:
– the computing network, for exchanges between processes; and
– the administration and control network (loading of system images on nodes, follow-up, load measurement, etc.).
a very broad bandwidth and above all has a very low latency. This network is ahigh performancenetwork and is often based on a specific communication topology and technology (see Chapter 2). The speeds of computing networks can reach 10 Gbit/s between each machine, and latency can be as low as a few nanoseconds. The control network is a classic Ethernet local area network with a speed of 100 Mbit/s or 1 Gbit/s. The parallel programs executed on clusters often use the Message Passing Interface communication library, enabling messages to be exchanged between the different processors distributed on the nodes. Computing clusters are used for high performance computing in digital imagery, especially for computer-generated images computed in render farms.
Should a server fail, the administration software of the cluster is capable of transferring the tasks executed on the faulty server to the other servers in the cluster. This technology is used in information system management to increase the availability of systems. Disk farms shared and linked by a storage area network are an example of this technology.
1.3. Computing grids
The term “grid” was introduced at the end of the 1990s by Ian Foster and Carl Kesselman [FOS 04] and goes back to the idea of aggregating and sharing the distributed computing power inherent in the concept of metacomputing which has been studied since the 1980s. The principal specificity of grids is to enable the simple and transparent use of computing resources as well data spread out across the world without worrying about their location.
get access to aglobal and virtual computer. According to this vision, computing power would be delivered by many computing resources, such as computing servers and data servers available to all through a universal network.
In a more formal and realistic way, grid computing is an evolution of distributed computing based on dynamic resource sharing between participants, organizations and businesses. It aims to mutualize resources to execute intensive computing applications or to process large volumes of data.
Indeed, whereas the need for computing power is becoming increasingly important, it has become ever more sporadic. Computing power is only needed during certain hours of the day, certain periods of the year or in the face of certain exceptional events. Each organization or business, not being able to acquire oversized computing equipment for temporary use, decides to mutualize its computing resources with those of other organizations. Mutualization on an international scale offers the advantage of benefiting from time differences and re-using the resources of others during the day where it is nighttime where they are. The grid therefore appeared as a new approach promising to provide a large number of scientific domains, and more recently industrial communities, with the computing power they need.
Time-sharing of resources offers an economical and flexible solution to access the power required. From the user’s point of view, theoretically the origin of the resources used is totally abstract and transparent. The user, in the end, should not worry about anything: neither the power necessary for his or her applications, nor the type of machines used. He or she should worry even less about the physical location of the machines being used. Ideally, it is the grid platform management and supervision software that runs all these aspects.
The concept of the grid is therefore particularly powerful because it offers many perspectives to the computer science domain. Indeed, it enables providers of computing facilities to:
Figure 1.2.Systematic architecture of a computing grid: interconnection of clusters across a wide-area network
– make the resource consumable on an on-demand basis, and this in a simple and transparent way;
– make it possible to use and share the capacity of unused resources;
– limit the cost of the computer resource to the part that is really consumed.
Furthermore, for the user, the reasons that justify the development and deployment of applications on computing grids are mainly:
– the increase in and sporadic nature of computing power demand;
– the need for dynamic resolution of increasingly complex problems;
– the need for large-scale sharing of information or rare and costly equipment.
computing technology in general. The main reason is that the term “grid computing” refers to an analogy with the electricity distribution network, which is called the power grid.
The grid was first defined as a material and software infrastructure giving reliable and universal access to very high-performance computing and storage resources. This definition was revised in the 2000s. The notion of service was substituted for the concept of resource. The Open Grid Services Architecture or OGSA, for example, merges the concepts of the grid and web services. The coordination of shared resources, dynamic problem-solving and concurrent use by different communities (or virtual organizations) became the leading topics. Today the resources considered are not only distributed computers and shared storage facilities, but also network elements, mobile terminals, sensor networks, large data-acquisition instruments, very high-definition viewing devices as well as databases and application codes. The term “grid” is therefore often associated with a large variety of different meanings and notions.
Two large grid system families have been developed:
– high-performance grids; and
– peer-to-peer grids.
1.3.1. High-performance computing grids
1.3.2. Peer-to-peer computing grids
The objective of a “peer-to-peer” or P2P grid is to enable large computations to be solved by benefiting from the unused computing capacity of participating nodes. These worker nodes are usually isolated and made available by dispersed users. The equipment is voluntarily enrolled by its owner, who permits it to be used by a collective P2P computing application when idling. In these grids, resources are therefore volatile and the performance of communications is very hard to predict.
The term grid remains associated with the scientific domain. In theory, grid computing tends to go beyond the services offered by the traditional Internet, by making computing and communications converge. In practice, however, this concept is very difficult to implement and use. The deployment and use of current grids requires significant expertise as well as a non-negligible investment on the user’s part. Therefore, outside a few limited applications such as SETI@home, the grid has failed to gain popularity with the general public and small-to medium-sized businesses.
The ideal of a grid that exploits all unused resources from each computer has remained the preserve of a minority of businesses. What is possible for large businesses or research centers, however, could also be achieved by the general public, be it at an individual or a local community level. The latter actually have large number of pieces of computer equipment and in the near future will need computer power 10 times as great in order to be able to use the new virtual reality and 3D simulation tools. Many communities could organize their computer equipment into grids, without any price increase, in order to have computing power at their disposal corresponding to their future needs. This would be done by making some of the communities’ servers available to other communities.
link and carry out computations for researchers working for a public organization or a large business. For example, many research and development centers could mutualize all their computers to carry out jobs that are particularly demanding in computing power.
It is this idea that was successfully developed and implemented in the experimental Grid5000, which is the daily work tool for several hundreds of computer science researchers and students in France [BOL 06a, CAP 05].
Grid5000 is an experimental grid platform, the purpose of which is to study algorithms and protocols for intensive distributed computing and P2P applications. This instrument, the only one of its kind in the world because of its technical specificities, gathers more than 5,000 computing cores. These are divided into nine clusters located in different regions of France and interconnected by a dedicated optical network, provided by the French National Telecommunications Network for Technology, Teaching and Research (RENATER). Grid5000 has a very powerful mechanism for automatic reconfiguration of all the processors. Researchers can therefore deploy, install, run and execute their operating system images – including their own stack of network protocols – in order to communicate on the private network. This capability for reconfiguration has led users of Grid5000 to adopt the following workflow:
(1) reserve a partition of Grid5000 (group of machines);
(2) deploy a software image on each of the reserved nodes;
(3) reboot all the machines of the partition with this new software image;
(4) run the experiment;
(5) collect results;
(6) release the machines in an automated operation that re-initializes the memory and temporary files.
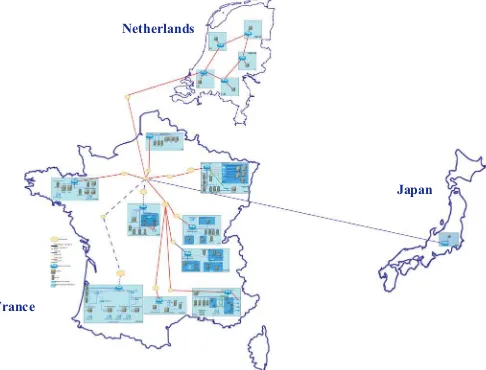
of resources during successive experiments, install and activate their own experimental conditions and measurement software. For a time limited to the reservation period, the user has total control over the set of reserved resources. The Grid5000 infrastructure gradually extends internationally and integrates remote sites via virtual private links, as indicated in Figure 3.1.
Netherlands
France
Japan
Figure 1.3.The international infrastructure of Grid5000
1.4. Computing in a cloud
Having emerged in 2007, the concept of cloud computing pushes the idea of transparency and virtualization of resources even further than grid computing does. Cloud computing is a concept that refers to the use of processing and storage capacities of servers distributed throughout the world and linked by a network, such as the Internet.
or individual users do not own the computer servers making up the infrastructure. They access external resources online without having to manage the underlying hardware, which is complex to install, configure and keep up-to-date, and is subject to failures. Whereas in the grid the economic model is based on the reciprocity of supply and maintenance of resources, in cloud computing the user pays per use (typically, a few dollars to rent a remote processor for a few hours). The applications and data are not deployed on the user’s local computer, but – metaphorically speaking – in a cloud composed of a huge number of interconnected remote servers. The computation results are retransmitted to the client or sent over other specified sites. Access to the service is through a readily available standard application, usually a web browser. In the grid the user invokes a job execution service by using a specific description language (Job Description Language or JDL). To use the computing power in the cloud, on the other hand, an access service to virtual resources is invoked. The service given is of a lower abstraction level and is therefore easier to account and bill than in a grid.
The cloud therefore represents an abstract infrastructure supplying resources and their associated services via the Internet. It is primarily aimed at customers that were not able to access the grid: private individuals and small- and medium-sized businesses. Every type of management, communication, business and/or leisure application is capable of using the resource services offered by cloud computing technology because it is available from any computer connected to the Internet.
Various types of clouds are available:
– a storage cloud offers storage services (services at the block or file level);
– a data cloud provides data-management services (based on records, columns or objects); and
– a computing cloud exposes data-processing services.
developing distributed applications. By providing an invisible and extendable infrastructure service, the infrastructure as a service (IaaS) paradigm perfectly completes the software as a service (SaaS) concept, which deals with the management of software licenses that are predeployed and made available to users. The majority of cloud computing infrastructures are made up of reliable services provided by data-processing centers that rely on computing- and storage-virtualization technologies.
Cloud computing relies on the Internet’s availability and connectivity. Nevertheless, excellent bandwidth will quickly be mandatory to the fluidity of such a system. Finely-tuned, high-speed Internet connections are seen as a major factor of the deployment of cloud computing, enabling optimization of the response time of an infrastructure currently designed in a centralized way.
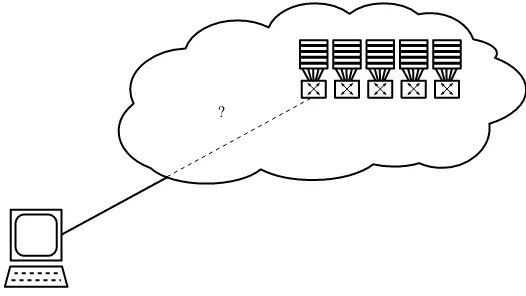
Figure 1.4.Systematic architecture of a computing cloud
scale to the general public and small businesses. The most significant examples of cloud computing services are:
– EC2 infrastructures (Elastic Compute Cloud);
– S3 storage cloud;
– Amazon’s SimpleDB data cloud;
– Google File System (GFS);
– Google BigTable;
– Google MapReduce; and
– the open-source system Hadoop.
Google GFS is, for example, capable of running petabytes of data. Three levels of cloud services are distinguished:
– IaaS;
– platform as a service (PaaS); and
– SaaS.
Below we concentrate more on the aspect of IaaS, which deals with the supply of digital resources over the Internet.
Returning to the idea of the grid and the metaphor of the electric power distribution system, the concept of cloud computing above all introduces an economic model, a very simple security model and architecture. Computing and information-storage power is offered for consumption by specialized companies. The customer only communicates with a single supplying entity that offers a unique portal and, quite often, relies on a centralized infrastructure. For this reason, businesses no longer need to acquire and maintain their own servers but can invest in renting this resource from a service supplier who guarantees computing and storage power on demand. Billing is based on the computing power and duration actually consumed.
technologies in the management and analysis of data. For the majority of applications, databases make up the preferred infrastructure for managing data sets. As the size of these data sets increases and reaches several hundred terabytes, more specialized solutions such as storage services will become more competitive than classic databases.
1.5. Conclusion
In the previous sections, we have seen that the concepts of computing clusters, grids and clouds have followed each other by subtly competing with one another. Clusters aggregate individual computers that are interconnected by a local network in order to supply a greater computing power at low cost. Grids link up heterogeneous resources, often computer clusters, via a WAN to mutualize and spread out resources. The cloud, through a paid and secured service, enables the remote and transparent use of clusters or grids composed of rare and/or powerful resources whether interconnected with each other or not. Furthermore, for intensive computing infrastructures there is a return in interest with regards to massive parallelism using multicore approaches and petascale systems. For the sake of coherence and conciseness, in this book we do not develop these new approaches as, from the point of view of the network, they pose problems similar to those encountered in high-performance networks for computer clusters studied, which is discussed in Chapter 4.
In Chapter 2 we detail the different classes of applications that run on these computing infrastructures. These very diverse applications can have different sensitivities to the performance of communications. We analyze, in particular, the place and constraints of the network within these infrastructures. We present the challenges posed to network technologies to enable computing networks to reach their full potential and for their users to benefit to the greatest degree from them.
Appearance Unit component Type of network Use Supercomputer 1980s processor internal bus intensive parallel
Cluster 1990 standard PC high performance intensive parallel Grid 1999 PC or PC cluster high speed intensive distributed Multicores 2005 processor high performance intensive parallel
Cloud 2007 PC, cluster, grid Internet remote computing Petascale machines 2010 multicore blades high performance intensive parallel
Utilization of Network Computing
Technologies
In less than 20 years, parallel and distributed computing infrastructures have experienced three profound revolutions: clusters, grids and clouds. Each of these technologies is more or less adapted to certain types of use. In this chapter we present the anatomy of distributed computing applications and then give a classification of these applications. The objective is to highlight factors that should guide the user when choosing one or other type of infrastructure and the network or protocol designer when choosing this or that technical approach.
2.1. Anatomy of a distributed computing application
into several pieces. Next, piece by piece, the interactions between these different systems are calculated. Then, to simulate the system’s behavior in time, these equation sets are resolved iteratively.
In another family of applications – called stochastic or optimization applications – the problem is split up into independent parts, or several instances of the same problem are calculated independently in parallel.
Therefore, these applications often use parallel-computing techniques to accelerate the resolution of a problem that can be very large in size and can sometimes require several days of computing on a simple processor.
When the job is distributed, each part or instance of the problem is calculated by a different computer. When the distributed tasks work in parallel, they sometimes have data or intermediate results to exchange.
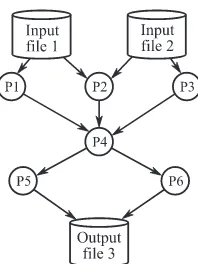
For example, in Figure 2.1, the program is broken down into six tasks (P1 to P6), also sometimes called processes or jobs. P1, P2 and P3 are executed in parallel and are synchronized at the level of task P4. P4 then distributes the job so that P5 and P6 can be executed in parallel. The input data of this program are File 1 and File 2. The result is returned at the end of the program in File 3.
Figure 2.2.Diagram of the distribution of a multiprocess application
Figure 2.2 shows how the different tasks of the application above can be distributed (or mapped) over desktop computers.
2.1.1. Parallelization and distribution of an algorithm
2.1.1.1. Embarrassingly parallel applications
In some applications, data domains can be completely divided in advance and the data distributed upon initialization. These applications are said to be embarrassingly parallel. The distribution of initial data on different computers corresponds to the preprocessing phase (stage-in). In general, a process, called themasterprocess, is in charge of data distribution and activation of processes called workers. Each process works on its own data on an independent computer. In the end, the results are collected to be stored or displayed. This is the post-processingphase (stage-out).
The programming model “MapReduce” for processing masses of data on a large number of computers is a very popular, particularly in the case of this type of embarrassingly parallel application. Processing can be carried out on data stored in a file system (unstructured) or in a database (structured). This framework corresponds to a large number of data-mining applications, e.g. searches for web pages containing a key word (search engine).
In theMapstage, a master node takes the mass of input data and cuts it up finely into sub-problems, which it distributes toworkernodes. A worker node can in turn re-do some cutting, which leads to a multilevel tree structure. In theReduce stage, the master node takes the answers for all of the sub-problems and combines them in such a way as to get the answer to the problems submitted. The advantage of MapReduce is that it enables all the operations to be processed in a distributed and theoretically parallel way. Today MapReduce can be used on a large-sized server cluster to sort a petabyte of data in only a few hours. Parallelism also offers the possibility of supporting server or storage breakdowns during the operation: if a mapper or a reducer fails, the job can be transferred to another processor.
a different domain:
Map(k1, v1)−→list(k2, v2).
2.1.1.1.1. TheMapfunction
TheMapfunction is applied in parallel to each element in the input dataset. This produces a list of (k2, v2)pairs for each call. After that, MapReduce collects all the pairs with the same key from all the lists and groups them together, thus creating a group for each of the different keys generated. TheReducefunction is then applied in parallel to each group which, in turn, produces a collection of values in the same domain:
Reduce
k2,list(v2)
−→list(v3)
2.1.1.1.2. TheReducecall
EachReducecall generally produces either a value,v3, or an empty return. The returns of all calls are collected in the desired results list. Thus, the MapReduce framework transforms a list of (key, value) pairs into a list of values. In MapReduce, data exchanges are produced at the end of each processing step. The tasks are completely independent.
2.1.1.2. Fine-grained parallelism
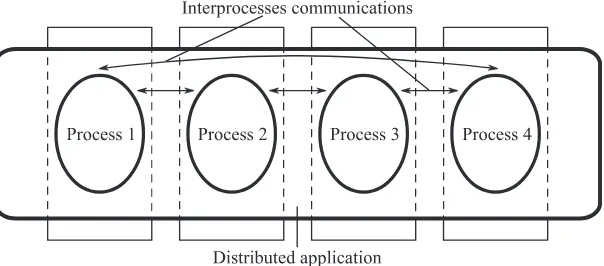
When in the parallelization phase of an application, data split-up cannot be completely clear and a non-empty intersection remains between the subdomains. Intermediate data must be communicated from one computer to the other. These exchanges take place during the processing phase, at each iteration step for example. This is called inter-process communication (IPC). Parallel applications that communicate during computing phases are said to exhibitfine-grained parallelism.
materials science, seismology, reservoirs, meteorology, virtual reality, etc. – are often heterogeneous and consume large volumes of data. They often have distributed and asynchronous control and are constructed in layers and by composition. In these applications, a large number of proprietary components are found. Each component implements a part or a stage of the simulation that can be implemented in parallel with, for example, the Message Passing Interface or MPI library,threadsor even vector processing.
2.1.2. Modeling parallel applications
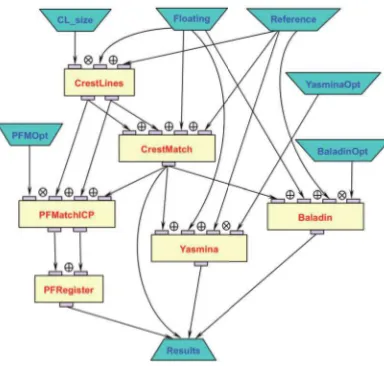
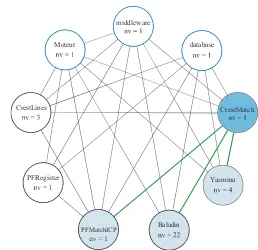
Parallel applications are generally modeled in the form of graphs representing the logical progression of the processing. Some complex applications are expressed using workflows; others are carried out in batchsequential processing viabatch queueson computers with varied architecture. Workflows used for describing complex applications are graphs indicating the modules to execute and the existing relations or data dependencies between the modules. Figure 2.3 represents a workflow of an application for processing medical images. To run such applications on computing grids, specific tools capable of analyzing and executing a workflow description file were developed [GLA 08]. Figure 2.4 represents a distribution of the tasks of this medical application. For fine-grained applications, the dependences between elementary tasks are generally represented by a graph of tasks or directed acyclic graph (DAG).
2.1.3. Example of a grid application
Figure 2.3.Workflow of a medical-imagery application
for Nuclear Research or CERN in Switzerland. It forms a global instrument shared by 2,000 physicians belonging to 150 universities distributed in 34 countries and is called theLarge Hadron Collider or LHC.
The energy level required by these experiments is seven times greater than that required by traditional instruments used by physicians and the rate of data generated is 40 times greater. In this ring, 150 million sensors acquire petabytes of data per second. These raw data are filtered and coded and generate 15 petabytes of data each year. These data require immense storage space and about 100,000 processors for processing them. These enormous data collections are shared by a very large number of users, each with unforeseeable data-access patterns.
Moteur
CrestLines
PFRegister
middleware
database
CrestMatch
Yasmina
PFMatchICP Baladin
Figure 2.4.Task graph of the medical application in Figure 2.3
model adopted in order to store and process data is highly hierarchical, as shown in Figure 2.5.
Figure 2.5.Hierarchical architecture of the LCG data grid
2.1.4. General classification of distributed applications
Intensive distributed computing applications are classified according to two important characteristics: computing intensity and data intensity. Computing intensity is defined as being the computing quantity per unit of data transferred between processes or read from a storage space. Data intensity is the opposite of computing intensity, i.e. the quantity of data processed per computing unit.
The useful metrics for these two types of applications are run time and processing speed. Run time (turnaround or completion time) is the duration that separates a task being started and the results being obtained. It is the performance metric in which the user of a computing infrastructure is most interested. Throughput is the volume of entries possible without affecting the run time of individual applications. It is this usage metric that the system’s owner tries to optimize.
grid applications has brought five main application classes to the fore that are differentiated by their computing intensity in terms of memory space required, data locality and inter-task communication needs. Thus, in this book we distinguish the following five classes, ordered according to the severity of their resource constraints:
– widely distributed computing;
– loosely coupled computing; – pipeline computing;
– highly synchronized computing;
– interactive and collaborative computing.
2.1.4.1. Widely distributed computing
The applications of this class perform research or modifications, or they unify distributed databases, for example. Computing, memory and data needs are low. The main problem to solve involves effectively enabling remote access to co-localized data and processing resources, with different updating rights and operations. They are applications that are often data-related but not necessarily data-intensive. Computing on demand (cloud computing), which requires access to remote resources to execute a computation, also fall into this category.
Figure 2.7.Deployment of a distributed application over three servers and stage-in and stage-out phases
2.1.4.2. Loosely coupled computing
The applications in this category are composed of bags-of-tasks with low memory needs, few data per task and little inter-task communication. When there are a very large number of such tasks showing low coupling, it is called high-throughput computing. Communications between the computer, the source(s) and/or data sink(s) are often intense in the pre-processing (stage-in) or post-processing (stage-out) phases. Figure 2.6 explains the logical sequence of stage-in and stage-out phases with the rest of the computation. Figure 2.7 shows the communications necessary for routing input data during the stage-in phase to computing resources. Data sources can be digital libraries, sensor networks, acquisition instruments, distributed databases and warehouses. Typical examples of this group include:
– data-grid applications, such as the CERN’s LCG grid;
– biocomputing; – finance; and
Thus, they are computing-intensive but can be conveniently executed on clusters that are highly distributed and connected by low-bandwidth, high-latency networks. On the other hand, interconnections between data warehouses and computers must enable high-speed transfers during the pre- and post-processing phases.
2.1.4.3. Pipeline computing
Pipeline computing applications absorb continuous (streamed) or real-time data. The underlying algorithms are generally memory-consuming and data-intensive. They have an embarrassingly parallel inter-task communication, whereas the tasks themselves are highly parallel. Their data-storage and memory needs are more important than in widely distributed computing, as are their communication needs during the processing phase. Typical examples in this class are real-time signal processing applications and applications related to the filtering/storage of data captured by satellites, sensors, microscopes, etc. By nature, problems are distributed: acquisition resources cannot be co-localized with computing resources or storage spaces.
2.1.4.4. Highly synchronized computing
Applications from this class have very frequent inter-task synchronizations. Such applications include, for example, applications of climate modeling, or physical or molecular phenomena based on explicit iterative methods (cellular automata).
Applications of this class require so-called high-performance computing (HPC) systems. They are the most difficult applications to distribute.
2.1.4.5. Interactive and collaborative computing
This class of application is characterized by the potential interaction of the user during computing. In collaborative applications, several users can intervene during processing or visualize the results. It is often necessary to implement an entire collaborative environment with audio and video facilities to facilitate interactions and decisions.
Collaborative use of the grid accelerates interaction between geographically-distributed users thanks to shared visual spaces. The application for interactive visualization of digital simulation results on a very large video wall (5m × 3m) studied in the Carriocas
project is a good example of this [AUD 09]. These applications have external sources of information (which can themselves be other grid applications), a remote display and information-processing pipelines that link the source to the display.
2.1.4.6. Note
2.2. Programming models of distributed parallel applications
2.2.1. Main models
Communication programming models enable the application programmer to define the system mechanisms used by the different parallel and/or distributed computing tasks. Different programming models authorize different communication styles between application processes during the execution of an application. These models are distinguished by their level of abstraction and their ability to mask the exchanges and hardware details of the network.
The main paradigms are the following:
(1) basic socket programming;
(2) message-passing via a specialized library (e.g. MPI); (3) shared memory;
(4) remote calling;
(5) remote access.
Many distributed applications communicate using the Socket interface, which traditionally uses the Transport Control Protocol (TCP) or User Datagram Protocol (UDP). Parallel applications generally rely on dedicated paradigms of the message-passing or shared-memory type in which communication details are concealed. In applications based on the client-server model, the remote method invocation (RMI, CORBA) or remote procedure call (RPC) is very wide spread. Programming multiprocess applications are complex, even if these models and the tools that come with them aim to limit the complexity. These different models were adapted with relative success and performance to the different infrastructures, whether homogeneous or heterogeneous.
type of application seen in the classification above, even if some models are theoretically better adapted than others to certain use cases.
2.2.2. Constraints of fine-grained-parallelism applications
Intensive scientific computing displays very specific and different needs from communications-based distributed systems, for example, on the client-server model. With the objective being the execution of computing as quickly as possible, this type of processing is distributed across different machines. The total quantity of data to process can currently reach the terabyte level. It therefore cannot be stored in each of the nodes but must be distributed. The greater the computing needs, the higher the number of machines necessary. Modern clusters often gather together several thousand machines. Finally, interdependence between different computing methods implies simultaneous execution, and comparatively periodic synchronizations and communications between the different processes in order to exchange intermediary results. The final aspect of a parallel application therefore consists of running a similar program in each processor of each node that works on a specific subset of data and regularly exchanges information.
This model is very different from the general distributed-systems model, where a variable number of machines can run rather random applications and communicate rather haphazardly. Parallel applications have better-mastered communication diagrams (as they are defined according to the algorithm implemented by the application) but also have significant synchronization and communication requirements, and this with a potentially vast number of machines. Thus, in a cluster, geographically-close machines (gathered in a single room) will be preferred to very distant machines. This proximity drastically modifies retransmission and congestion-control needs.
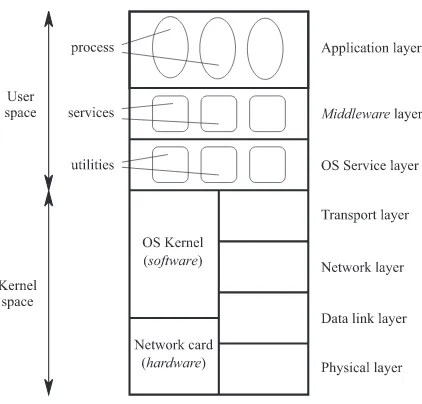
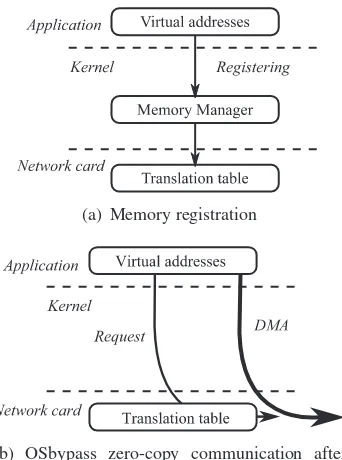
memory copies imposed by the operating system’s protocol layers limit communication speed and consume processor time that the application could have at its disposal. The additional latency costs imposed by the crossing of these software layers and the notification of network events can noticeably slow down the applications. The specific needs of parallel-application communications have therefore favored the emergence of a dedicated programming interface – the MPI, the details of which we will go into in the next section. In addition to this, many reflections have been carried out on network hardware and the software stack exploiting it, the details of which we will go into in Chapter 3.
2.2.3. The MPI communication library
In order to be better adapted to the very specific context and needs of scientific parallel-computing applications, a dedicated programming interface was put forward challenging the standard Socket interface. The first version was introduced in 1994 by the MPI Forum [FOR 94]. MPI is neither a language nor a layout. It is a standard designed for parallelizing scientific computing applications on parallel machines and clusters. It is a set of C and Fortran functions implemented by many libraries, the most famous of which are MPICH and OpenMPI.
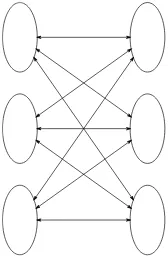
exchange between all processes, as represented in Figure 2.8, whereas a Reduce communication will accumulate data from all processes on one specific process in order to synthesize its contributions at the end of computing.
Figure 2.8.MPI all-to-all communication
Submitting these requests can be non-blocking and the application will then have to test the request terminations later. The non-blocking aspect is primordial because theoretically it enables computing to overlap communications, instead of waiting without doing anything until the request is terminated. The application can therefore benefit by using the available processing time to carry out useful jobs. Different tags can, in addition, be used in order to mark different types of independent communication, for example control and data messages. The operation associating an input message and a reception request available with the same tag is called matching.
Then, since parallel computing, e.g. matrix computing, often hands out different subsets of work to different subsets of processes, the notions of communicator andgroups were defined. Each process has a rank in each communicator to which it belongs and it is thus, for example, possible to implement collective operations based solely on one subset of processes.
Finally, MPI enables the application to clearly expose the organization of data in memory in order to benefit from potential software or hardware optimizations. Datatypes, for example, allow a matrix column to be sent by specifying its characteristics, without giving the set of positions of the different memory segments. During reception, the application can use another datatype to receive data based on another memory organization, which, for example, enables the implementation of an on-the-fly matrix transposition.
The MPI interface initially seemed very complex but was finally imposed as the communication standard for parallel applications, for lack of better options. Industrialists attempted to impose other programming interfaces, Virtual Interface Architecture (VIA) in particular [SPE 99] and more recently Direct Access Portable Layer (DAPL) [COL 07], which offer non-blocking primitives in connected mode. This model was never imposed, however, mainly because the message-passing model put forward by MPI turned out to be more practical and efficient for receiving parallel computing applications [BRI 00].
The MPI norm has been regularly extended since its creation in 1993. It saw the addition of dynamic process management in MPI-21 and was generalized for input-output to storage with extension MPI-IO2. Ongoing discussions to define the third version of the norm aim, among other things, to add the support of non-blocking collective operations in
1. MPI-2: Extensions to the Message Passing Interface, http://www.mpi-forum.org/ docs/mpi-20-html/mpi2-report.html.
order to authorize greater overlap and fault tolerance. These jobs should provide an efficient answer to the requirements of modern parallel applications that are much more consuming and complex than those of the 1990s.
Replacing the Socket interface with MPI in clusters was not the only reason for the leap in parallel computing performance. It was accompanied by the development of dedicated networks that enabled the most to be got out of the advantages of the programming interface by adapting the underlying hardware. Indeed, the specific context of computing clusters – where a closed network (not connected to the Internet) links nodes – the QoS and protocols offered to applications can be adapted.
2.3. Coordination of distributed resources in a grid
2.3.1. Submission and execution of a distributed application
Beyond the modifications it imposes on application programming, the use of a distributed infrastructure such as a computing cluster or grid introduces a certain number of new steps:
(1) user authentication enables the system to acquire the user’s identity and to grant him or her access to the cluster;
(2) the user enters his or her job-execution request via a portal or directly thanks to a description language specific to each infrastructure. The main languages currently used in computing grids are:
- Job Submission Description Language (JSDL), - Globus Resource Specification Language (RSL), - Job Description Language (JDL), and
- Job Description Language (LDT);
(3) the system allocates resources to the user that match his or her needs;
(5) each process is composed of one or more control tasks, sharing a similar address space that is created on the machine that was allocated;
(6) during computing, processes can communicate with each other in order to progress with problem solving;
(7) after computing, the results are given directly to the user or are stored in a space chosen by the user during the submission.
A specific process, created when a job is entered, acts on behalf of the user for the entire duration of this job. The mission of this process is to acquire the resources necessary for running the application, depending on the user’s rights. On the environment’s side, a set of mechanisms and policies must be laid down and activated to enable access, sharing and the use of these resources.
The manager of the cluster or grid, called middleware, is in charge of the global management of all of the environment’s resources. It is this manager that ensures and coordinates execution of all these steps in direct collaboration with the workflow manager. The role of the middleware (or global operating system) is to hide the system’s complexity from applications and provide the abstractions suited to application programming. Functionalities of such an abstract grid machineare listed below:
– security mechanisms management (access control); – resource discovery;
– resource selection and mapping; – secured placement of codes and data; – running of executables on target machines.
Even if the functionalities required to manage a cluster or grid are roughly the same, the grid, compared to the computing cluster, changes the order of magnitude in terms of:
– the number of pieces and heterogeneity ofcooperating equipment;
– size of communities of users; numbers of interdependent processes; and also
We move from 10 or 100 to 1,000 processors, users, processes. Making this set of remote and heterogeneous hardware and software communicate and cooperate efficiently at these larger scales clearly poses different and complex problems. This is the reason why much of the research, throughout the past decade has centered on grid management and usage issues. More recently, the arrival of mega data centers and cloud computing have raised new technological and scientific challenges to even more impressive scales. Indeed, a data center can contain several hundreds of thousands of machines.
2.3.2. Grid managers
Two large middleware families were put forward to manage grid resources and users:
– Massive grid environments aim to share server clusters that are generally localized in computing centers. The management of these environments can be relatively centralized or slightly decentralized.
– Desktop grid environments enable the use of very widely-spread desktop computers. For example, home PCs connected to the Internet via ADSL links can contribute to the computing platform during their standby period. These environments initially rely on a completely distributed technology, called peer-to-peer or P2P.