Size Control to a Sub-Nanometer Scale in Platinum Catalysts on
Graphene
Rikson Siburian,
†,‡Takahiro Kondo,
†and Junji Nakamura
*
,††
Faculty of Pure and Applied Sciences, University of Tsukuba, Tsukuba, Ibaraki 305-8573, Japan ‡
Faculty of Science and Engineering, University of Nusa Cendana, Kupang, 85001, Nusa Tenggara Timur, Indonesia
*
S Supporting InformationABSTRACT: Size controlled Pt catalysts supported by graphene nanosheets (GNS) are successfully prepared by changing the loading of Pt at 10−70 wt % using an impregnation method. It is found that Pt sub-nanoclusters (0.8 nm) with an extremely large surface area (170 m2g−1) are formed on the GNS support in a 10 wt % Pt/GNS catalyst. An increase in loading of Pt leads to an increase in the particle sizes of Pt, which results in lower activities for electro-oxidation of adsorbed CO. A core level shift of Pt 4f in XPS indicates that Pt is chemically interacted with graphene. The modification of catalytic properties and the electronic structure
is ascribed to the interface interaction between Pt and graphene viaπ−d hybridization.
1. INTRODUCTION
Graphene, aflat monolayer of carbon atoms tightly packed into
a two-dimensional honeycomb lattice, has attracted great interests from both fundamental science and applied research, because of its unusual electronic properties and unique character due to its one-atom-thick planar sheet structure.1 Recently, graphene nanosheets (GNS) have been applied to a support material for low-temperature fuel cell catalysts.2 The combination of the large surface area (theoretical value of 2630 m2 g−1), high conductivity (1250 S m−1), unique graphitized basal plane structure, and potential low manufacturing cost makes GNS a promising candidate as a low-temperature fuel cell catalyst support.2
The GNS-supported catalysts have mostly been evaluated for a potential application as anode materials in direct methanol and hydrogen fuel cells.2 Generally, Pt and Pt-based catalysts supported on GNS present higher catalytic activities for methanol oxidation reaction (MOR)3−5 and hydrogen oxidation reaction (HOR)6 than those of catalysts supported on carbon blacks.
Platinum clusters on graphene have attracted considerable attention in theoretical studies7−12
because modification in the
electronic structure of Pt is expected, which may lead to an enhancement in the catalytic activity. The adsorption sites of Pt atoms, geometric structure of Pt clusters, the adsorption energy of Pt atoms, the magnetic properties, and the electronic structure of Pt have been reported on defect-free graphene, defective graphene,7,9 strained graphene, and nitrogen-doped graphene.9 Stabilization of Pt clusters by graphene has been reported, which modifies the d-band structure and the magnetic
properties10 of Pt. Although small clusters of Pt have been extensively studied in theoretical studies, experimental works
have not been studied in detail so far because the sizes of Pt particles of Pt/GNS catalysts in the literature are generally as large as 2−5 nm.2 On the other hand, in our group, Pt sub-nanoclusters are found to be formed on GNS,5 which are composed of 5−40 Pt atoms. They showed a high CO tolerance as an anode catalyst in H2−O2 polymer electrolyte fuel cells (PEFCs).6The high CO tolerance has been ascribed to the interface interaction between Pt and graphene.5,6 The reason why our group can synthesize Pt sub-nanoclusters is due to the preparation method. We have prepared Pt/GNS catalysts by an impregnation method, in which weak and strong reductions of platinum catalyst precursors are combined properly using ethanol and hydrogen. As has been reported previously, the proposed mechanism for the formation of Pt sub-nanoclusters includes the following pivotal surface reactions: the reduction into PtOx particles (Pt2+), the formation of isolated Pt atoms by H2reduction, followed by the formation of Pt sub-nanoclusters by the collision of the Pt single atoms migrating on GNS.13
The importance in the study of graphene supported Pt catalysts lies in a control in the electronic structure of Pt by taking advantage of the Pt−C interaction, which probably varies as a function of Pt particle size. It is thus an interesting subject in experimental studies how to control the particle size of Pt on graphene at a sub-nanometer scale, which may further control the catalytic activity of Pt. If it is possible, the Pt sub-nanocluster on graphene will be a new type of Pt catalyst,
Received: December 2, 2012 Revised: January 17, 2013 Published: January 24, 2013
whose electronic structure can be controlled by the Pt−C interaction.
In this study, we havefirst tried to control the particle size of
Pt on GNS in a region from sub-nanometer to a few nanometers. We have successfully controlled the average particle size of Pt by changing the loading of Pt on GNS. Then, we have studied the relationship among the Pt particle size, the catalytic activity, and the electronic structure of Pt on GNS by X-ray diffraction (XRD), transmission electron
microscope (TEM), electrochemical measurements, and X-ray photoelectron spectroscopy (XPS).
2. EXPERIMENTAL SECTION
GNS were prepared from graphite powder (particle size pass 45
μm, Wako Pure Chemical Industries). First, graphite was oxidized to form graphite oxide.14Second, it was ultrasonicated into distilled water to form graphene oxide sheets. Finally, graphene oxide sheets were reduced by using hydrazine hydrate to produce GNS.
The formation of GNS is confirmed by a significant
reduction in the intensity of the C(002) peak in XRD and a clear thin-sheet structure with a wrinkle in TEM as reported previously (details of XRD and TEM measurements are described in ref 13). In this work, we further confirmed the
GNS structure by high resolution TEM (HRTEM). HRTEM images were recorded using JEM-ARM 200F (electron microscope operated at 200 kV, resolution transmission image 0.19 nm and lattice image 0.11 nm). The HRTEM image of GNS was shown in Figure 1S (Supporting Information), clearly indicating a single layer or a few layers of GNS.
The 10−70 wt % Pt/GNS catalysts were prepared by using the impregnation method with controlling the amount of Pt precursor of [H2PtCl6·6H2O] (Alfa Aesar, A Johnson Matthey Company) on GNS, respectively. An ethanol solution of the Pt precursor was mixed with the ethanol solution of GNS and was stirred for 3 h. The product was then collected byfiltration and
dried in air at 60°C for 12 h. Finally, the product was reduced
by heat treatment in a hydrogen stream (H225 mL/min) at 400°C for 2 h in a furnace. The collected product was used as a
Pt/GNS catalyst.
The 10−70 wt % Pt/GNS catalysts were characterized by thermogravimetric/differential thermal analysis (TG/DTA),
XRD, HRTEM, XPS, and electrochemical measurements. TG/DTA measurements were carried out using TG/ DTA6300, Seiko Instruments Inc. (reference: Pt-pan; air 200 mL/min; T measurement: 50−1000 °C; rate: 10 °C/min,
respectively). XRD measurements were performed at room temperature employing a two-circle diffractometer (PANalytical
PW 3050 Philips X’Pert Pro, Cu Kα radiation of 1.541 Å, without monochromator), installed at a line focus X-ray generator. A reflection free Si plate was used as a sample
stage. Cu Kαradiation obtained by reflection from a singly bent
HOPG crystal was used as the incident X-ray. The diffraction
pattern was recorded using a solid state detector (PANalytical X’Celerator) with a scan speed of 0.005°(in 2θ)/s up to 90°.
XPS measurements were carried out using JEOL, JPS 9010 TR (X-ray source Al Kα, 1486.6 eV, pass energy 50 eV, energy resolution 1.88 eV which was calibrated using Ag 3d5/2 by measuring a clean Ag sample, the uncertainty of binding energy
±0.05 eV). The electrochemical measurements were conducted
using PGSTAT PG12, AUTOLAB Potentiostat/Galvanostat.
The electrochemical measurements were carried out in a three-electrode system in nitrogen saturated 0.1 M HClO4at 60 °C, with Pt-wire, Ag/AgCl, and glassy carbon disk as the
counter electrode, reference electrode, and working electrode, respectively. The cyclic voltammograms (CVs) were obtained at−0.25 to 0.8 V versus Ag/AgCl with a scan rate of 10 mV s−1. The electrochemical active surface area (ECSA) for each of the 10−70 wt % Pt/GNS catalysts was measured by using hydrogen adsorption/desorption (ECSAH) and CO stripping voltammogram (ECSACO), respectively. Commonly, hydrogen adsorption/desorption cyclic voltammetry is carried out to evaluate ECSAH.15,16
For the ECSAHmeasurements, 1 mg of Pt/GNS catalyst was
first diluted into 500μL of Nafion solution (1:50 in methanol,
5 wt % Nafion (Aldrich)). Then, 10μL of catalyst ink solution
was loaded onto a clean glassy carbon disk electrode (0.28 cm2). The Pt loadings of catalysts on working electrode are then calculated as 2.0, 3.0, 4.0, 5.0, 6.0, 7.0, 8.0, 9.0, 10.0, 11.0, 12.0, 13.0, and 14.0μg for 10, 15, 20, 25, 30, 35, 40, 45, 50, 55, 60, 65, and 70 wt % Pt/GNS catalysts, respectively. For example, Pt loading of 10 wt % Pt/GNS is calculated by 1 mg×
(10 wt %/100 wt %)×(10μL/500μL).
For CO stripping measurements, the amounts of Pt set on the working electrode are the same as those measured in ECSAH. Each of the catalyst ink solutions for 10−70 wt % Pt/ GNS catalysts was loaded onto a glassy carbon disk electrode (0.28 cm2) with diluted (1:50 in methanol) 5 wt % Nafion
solution (Aldrich), respectively. Prior to the measurements, the working electrode was first purged by bubbling nitrogen
through the electrolyte solution of 0.1 M HClO4for 20 min, and then it was scanned at−0.2 to 0.8 V versus Ag/AgCl for 50 cycles in nitrogen with a scan rate of 10 mV s−1and a rotation rate of 500 rpm for cleaning and deoxygenates the environ-ment. Subsequently, CO was adsorbed to the surface of the working electrode by bubbling 3% CO/H2into the electrolyte solution of 0.1 M HClO4at 60°C for 1 h, while holding the working electrode potential at−0.15 V vs Ag/AgCl. After 3% CO/H2bubbling, the gas was switched to nitrogen for 30 min and the potential was scanned from−0.2 to 0.8 V vs Ag/AgCl to record the CO stripping voltammogram at 60°C with a scan
rate of 10 mV s−1.17−19
For the comparison, every measurements were also done for the commercial catalysts of 20 and 40 wt % Pt/carbon black (CB) (Johnson Matthey).
3. RESULTS
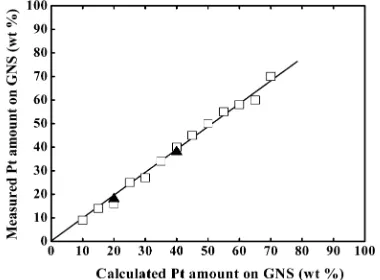
3.1. TG/DTA.The amounts of Pt on GNS for 10−70 wt % Pt/GNS catalysts were measured by TG/DTA (see the Supporting Information, Figure 2S). As shown in Figure 1, the amounts of Pt are exactly the same as those calculated in the catalyst preparation procedure. The results indicate that all the Pt atoms in the catalyst precursors are included in the Pt/ GNS catalysts. We can thus control the amount of Pt on GNS exactly so that one can evaluate the relationship among the particle size, the electronic structure, and the catalytic activity as a function of the Pt amount.
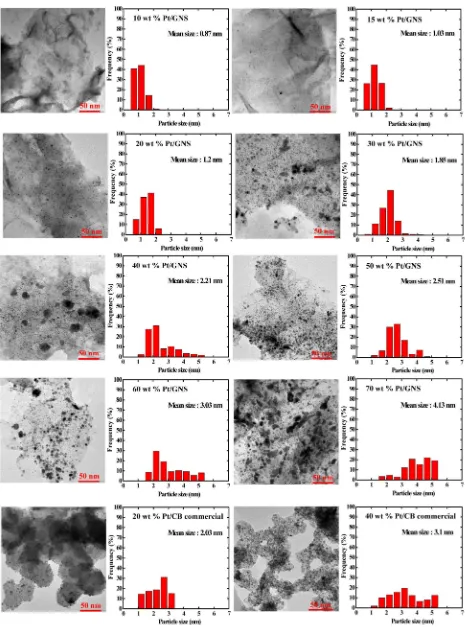
respectively. The TEM images clearly show high dispersions of Pt particles on GNS and carbon black.
It should be noted that Pt sub-nanoclusters are seen for Pt/ GNS catalyst with low loadings of Pt below 40 wt %. For 10 wt % Pt/GNS catalyst, the average Pt particle size is estimated to be 0.87 nm. That is, Pt sub-nanoclusters were mostly formed on GNS. They seem to be homogenously distributed on GNS without aggregation even after heating treatment in N2/H2(4:1 v/v) at 400°C in the catalyst preparation procedure. A large
surface area of Pt is thus expected, which may reduce Pt usage in fuel cells. With increasing amount of Pt for 10−50 wt % Pt/ GNS catalysts, the average Pt particle sizes tend to become large, as shown in Figure 2.
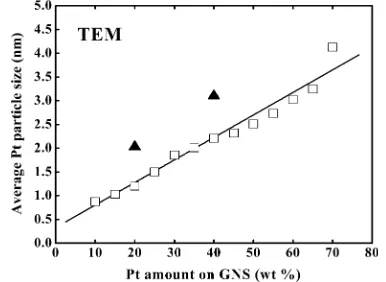
Figure 3 shows the average Pt particle size estimated by TEM as a function of Pt loading. It is clearly shown that the average particle size of Pt linearly increases with increasing amount of Pt. For 10−20 wt % Pt/GNS, the average size of Pt is about 1 nm. On the other hand, for 55−70 wt % Pt/GNS catalysts, the Pt sub-nanoclusters are not seen and the average Pt particle sizes are estimated to be 2.7−3.8 nm. Moreover, larger Pt particles (>10 nm) are present on those catalysts, as shown in the Supporting Information (Figures 3S and 4S).
In comparison, 20 and 40 wt % Pt/CB commercial catalysts were observed by TEM (Figure 2). The average particle sizes of Pt for 20 and 40 wt % Pt/CB (2.0 and 3.1 nm) are larger than 20 and 40 wt % Pt/GNS catalysts (1.2 and 2.2 nm), indicating that the small Pt particles are much more deposited on GNS compared to CB.
3.3. XRD.The XRD patterns for 10−70 wt % Pt/GNS and 20 and 40 wt % Pt/CB commercial catalysts are shown in Figure 4. All the patterns gave peaks at 2θBragg angles around 25 and 39°corresponding to C(002) and Pt(111), respectively.
The C(002) peak appears weak and broad for Pt/GNS catalysts. Note that the C(002) peak usually appears sharp at 26.5°for graphite15corresponding to the interlayer distance of d= 3.4 Å and a broad peak at 10°for graphite oxide (GO)16
corresponding to that ofd= 8.4 Å. In Figure 4, weak and broad peaks at around 25° (d = 3.5 Å) are seen, meaning that
graphene sheets are formed successfully. However, some graphitic (stacked graphene) species should remain due to the weak peak at 25°, suggesting a stacking of graphene to some
extent.
As shown in Figure 4, Pt(111) peaks for 10−50 wt % Pt/ GNS catalysts are very weak and broad, and then gradually become intense and sharp for 55−70 wt % Pt/GNS catalysts.
The weak XRD peaks of Pt are characteristic for Pt/GNS catalysts,13in contrast to the Pt/CB catalysts showing intense XRD peaks of Pt (Figure 4). The weak and broad peaks of Pt(111) for the Pt/GNS catalysts indicate that very small particles of Pt (<2 nm) were formed on graphene. We thus estimated the particle size by XRD using the Scherrer equation,21as shown in Figure 5. The average Pt particle size is not so different at 2.8−4.0 nm below 45 wt %, while the intensity of the XRD peak gradually increases with Pt loading. It is noted that the average size distribution of Pt is not the real one because XRD patterns are not obtained for the Pt sub-nanoclusters as observed by TEM. The average size distribution of relatively large Pt particles is thus measurable by XRD. This is the reason why the average particle size of Pt estimated by XRD is very different from that estimated by TEM.
As for 20 and 40 wt % Pt/CB commercial catalysts, Pt(111) peaks are relatively large in intensity, suggesting that the crystallinity of Pt is higher than those of Pt/GNS. The particle sizes of 20 and 40 wt % Pt/CB commercial catalysts are estimated to be 3.3 and 4.0 nm, respectively (Figure 5).
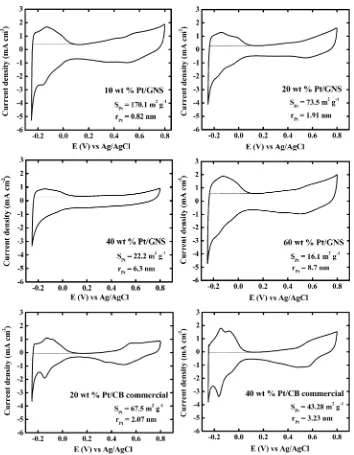
3.4. ECSAH and ECSACO. Cyclic voltammetry (CV) has been performed on Pt/GNS and Pt/CB catalysts to measure the electrochemical surface area (ECSA) of Pt and to evaluate electrocatalytic activities for the oxidation of adsorbed CO. ECSAH and ECSACO were measured by hydrogen desorption and the electro-oxidation of CO to CO2, as shown in Figures 6 and 7, respectively.
The ECSAHwas calculated as reported in the literature.15,16 The cyclic voltammograms for Pt/GNS and Pt/CB catalysts (Figure 6) show three characteristic regions: the hydrogen adsorption potential region between−0.2 and 0.1 V versus Ag/ AgCl is followed by the double layer potential region, while, above 0.45 V versus Ag/AgCl, first OH adsorption and then
oxide formation can be observed.22 It seems that the oxide formation peaks are relatively weak for Pt/GNS catalysts compared to the Pt/CB catalysts.
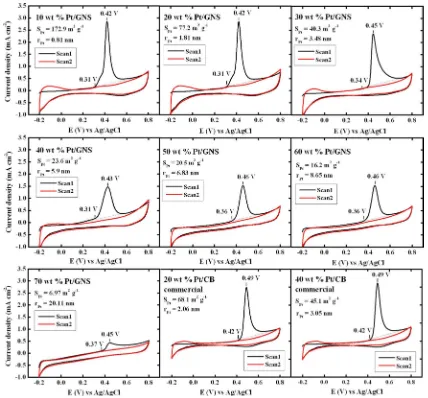
The CO stripping voltammetry was carried out in a N2 -saturated 0.1 M HClO4solution at 60 °C. The CO stripping curves were obtained from two consecutive scan cycles. Figure 7 shows CO stripping voltammograms for 10−70 wt % Pt/ GNS and 20 and 40 wt % Pt/CB catalysts, respectively. It is clearly shown that the CO electro-oxidation peaks are large and sharp for 10−30 wt % Pt/GNS. ECSACOwas then obtained by calculating CO stripping charge area under the CO stripping peak in the potential region from 0.3 to 0.7 V versus Ag/AgCl (Figure 7).17−19
Both ECSAHand ECSACOfor 10−70 wt % Pt/GNS and 20 and 40 wt % Pt/CB are shown in Figure 8a. It is clear that the ECSAHis in good agreement with ECSACO. This indicates that the electrochemical surface area of Pt is accurately estimated as a function of Pt loading by the electrochemical measurements. Note that the Pt surface area (SPt) is extremely large as 170.1 m2g−1
for 10 wt % Pt/GNS, corresponding to an average size of 0.82 nm. The estimated size of Pt cluster is consistent with that measured by TEM in terms of the formation of Pt sub-nanoclusters. It is thus concluded that the majority of Pt particles in 10 wt % Pt/GNS is Pt sub-nanoclusters. Generally, the surface area of Pt is in the range of 60−80 m2g−1for Pt/CB commercial catalysts.21That is, the surface area of 10 wt % Pt/ GNS is 2−3 times larger than ordinal Pt/CB catalysts. The surprisingly large area of the electro-chemically active surface means a possibility to reduce Pt usage in fuel cells if the catalytic activity is as high as those for larger Pt particles. As Figure 1.Pt amount on GNS (wt %) measured by TG/DTA versus
described later, the catalytic activity of Pt/GNS is superior to commercial catalysts in the electro-oxidation of adsorbed CO. As for higher Pt loadings, 20−70 wt % Pt/GNS, ECSAH, and ECSACOsignificantly drop, as shown in Figure 8a. The average
smaller than those measured by ECSA and XRD. This is explained by the coexistence of small and large Pt particles with different size distributions. In fact, Pt sub-nanoclusters
coexisting with larger nanoparticles are observed in TEM images for 15−40 wt % Pt/GNS catalysts (Figure 2). However, the sub-nanoclusters are not formed on 50−70 wt % Pt/GNS catalysts. Here, the average particle sizes estimated by TEM,
XRD, and ECSA are compared, as shown in Table 1. The average sizes measured by TEM are comparable with those measured by ECSA for low Pt loadings of 10−20 wt % for Pt/ GNS. On the other hand, the average sizes measured by XRD are comparable with those measured by ECSA for high Pt loadings of 50−70 wt % for Pt/GNS. Those agreements are explained by the presence of sub-nanoclusters and larger particles of Pt with two different size distributions, which is due
to the formation mechanism of Pt sub-nanoclusters, as has been reported elsewhere.13As shown in Figure 3S, larger particles over 5 nm were frequently observed for 30−70 wt % Pt/GNS. In comparison, for 20 and 40 wt % Pt/CB commercial catalysts, the average particle sizes of Pt measured by TEM, XRD, and ECSA are comparable as 2−4 nm, although XRD overestimates the particle size due to the presence of small particles with the size of ca. 1 nm. In the case of Pt/CB, the size distribution is normal in the absence of large Pt particles over 5 nm as observed for Pt/GNS.
3.5. Electro-Oxidation of Adsorbed CO. The electro-oxidation of adsorbed CO on Pt/GNS in Figure 7 shows characteristic features different from those for Pt/CB in terms
of the electro-oxidation potential and width of the peak. As for 10−20 wt % Pt/GNS, the threshold voltages of the electro-oxidation peaks are very low as 0.31 V versus Ag/AgCl and the electro-oxidation peak is located at 0.42 V, which is in contrast with the results of Pt/CB catalysts with the threshold of 0.42 V and the peak of 0.49 V vs Ag/AgCl. That is, the lower shift in potential is about 1 V. It is clear that the catalytic properties of Pt supported by GNS are very different from those of Pt/CB
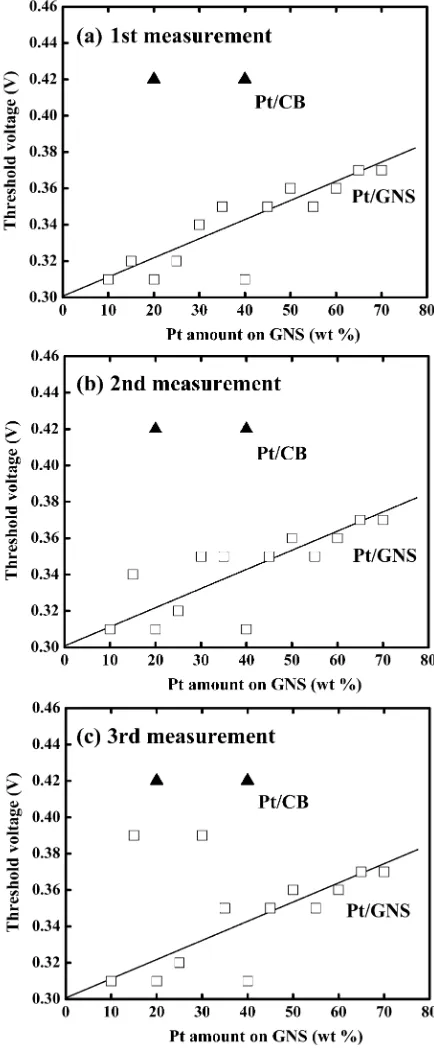
catalysts. With increasing Pt loading on GNS, however, the electro-oxidation peaks are shifted to higher voltages, as shown in Figure 7. The tendency is clearly shown in Figure 9, in which the threshold of the electro-oxidation peak is shifted to higher voltages with increasing Pt loading. Considering that Pt sub-nanoclusters are formed at low loadings of 10−20 wt %, the shift of voltages in the electro-oxidation of adsorbed CO is due to a superior catalytic activity of Pt sub-nanoclusters on GNS. That is, the shift to higher voltages for Pt/GNS catalysts is explained by the particle size effect of Pt. It is also noticed that
the width of the electro-oxidation peaks for Pt/GNS gradually increases with increasing Pt loading from 10 to 70 wt %. This is explained by the coexistence of Pt sub-nanoclusters and larger Pt particles, where two characters of high and low activities are probably mixed in the CO electro-oxidation.
On the other hand, no significant effect of the particle size
was observed for Pt/CB catalysts. As shown in Figures 7 and 9, the thresholds and the peak maxima of the CO electro-oxidation peaks are comparable between 20 and 40 wt % Pt/ CB catalysts, although the particle sizes are different as 2.1 and
3.3 nm, respectively. Furthermore, the width of the peaks for Pt/CB is relatively sharp compared to those for Pt/GNS, indicating the homogeneous catalytic activity of Pt in Pt/CB. Those results indicate that the catalytic properties of Pt/CB are identically independent of the particle size, further suggesting that the support effect of CB is weak. In addition, the threshold
voltages of Pt/CB in Figure 9, 0.42 V, seem to be high compared to those of Pt/GNS, 0.33−0.37 V, although the particle size for 30−70 wt % Pt/GNS (4−21 nm) is much larger than those of Pt/CB (2−3 nm) shown in Table 1. For large Pt particles on GNS, the electronic modification of Pt via
Pt−graphene interface interaction should be insignificant. The
difference in the electro-oxidation activity between Pt/GNS
and Pt/CB is thus explained by the difference in the
Figure 3.Average Pt particle size (nm) estimated by TEM versus Pt amount on GNS (□). The results for 20 and 40 wt % Pt/CB commercial catalysts (▲) are also shown.
Figure 4.XRD patterns of 10−70 wt % Pt/GNS and 20 and 40 wt %
Pt/CB commercial catalysts.
morphology of Pt particles or the surface geometrical structure of Pt particles as described in the Discussion section.
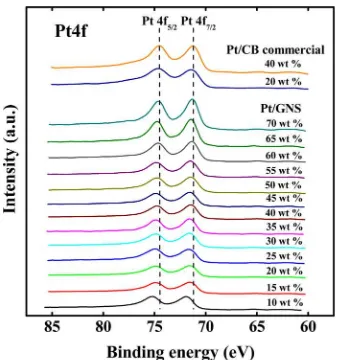
3.6. XPS.The electronic structures of Pt for Pt/GNS and Pt/CB catalysts were examined by XPS. Figure 10 shows XPS spectra of Pt 4f for 10−70 wt % Pt/GNS and 20 and 40 wt % Pt/CB catalysts. It is found that the Pt 4f peak of Pt/GNS is shifted to higher binding energies with decreasing Pt loading. The peak maximum of Pt 4f7/2for 10 wt % Pt/GNS is located at 71.8 eV, which is much higher than that of bulk Pt, 71.2 eV.23 The tendency of the energy shift in 4f7/2 with Pt loading is clearly shown in Figure 11, in which the peak maxima shift to higher energies with decreasing Pt loading. Even at 70 wt % of Pt loading, the peak maximum at 71.3 eV is a little high compared to the bulk value at 71.2 eV. The energy shift should be related to the particle size of Pt on GNS. That is, modification in the electronic state of Pt should become
significant due to the interface interaction between Pt and
graphene when Pt sub-nanoclusters are the majority on GNS. The interface interaction is considered to beπ−d hybridization
of graphene and Pt, respectively, which will be discussed in section 4.4.
On the other hand, binding energies (BEs) of Pt 4f7/2for 20 and 40 wt % Pt/CB at 71.4 and 71.2 eV are close to the bulk value of 71.2 eV, although the particle sizes of Pt in Pt/CB are small as 2.1 and 3.3 nm. For the comparable particle sizes in Pt/ GNS, the high BE shifts correspond to 0.3−0.5 eV, which is greater than those for Pt/CB. The absence of significant BE
shift of Pt 4f7/2 in Pt/CB suggests no significant interface interaction between Pt and CB. The difference in the
modification in the electronic states of Pt between Pt/GNS
and Pt/CB as a function of Pt loading well corresponds to that in electro-catalytic activity of CO oxidation described in section 3.5. That is, the catalytic activity and the BE of Pt 4f7/2 are increased in parallel with decreasing particle size of Pt on GNS. The relationship among the catalytic activity, the BE shift, and the particle size is thus ascribed to the interface interaction between Pt and graphene. As for Pt/CB, no significant change
in both catalytic activity and BE of Pt 4f7/2was observed when
the particle size is changed. That is due to the absence of the interface interaction between Pt and CB.
There are two possible factors contributing to the core level shift: initial state effect associated to changes in the local
electronic structure (valence electron configuration) and final
state effect due to changes in the relaxation process
(extra-atomic response to the positively charged hole).24 The final
state effect is discarded because the core level shift was
observed for Pt/GNS, while no peak shift was observed for Pt/ CB at the same Pt loading or particle size.
The atomic ratios of Pt to C estimated by XPS for 10−70 wt % Pt/GNS and Pt/CB catalysts are summarized in the Supporting Information (Table 1S). It is shown that the atomic ratio of Pt to C increases with increasing Pt loading. Here, the Pt/C ratio of Pt/GNS is comparable with that of Pt/ CB at the same Pt loading.
4. DISCUSSION
4.1. Distribution of Particle Size. Table 1 shows the average Pt particle sizes estimated by XRD, TEM, and ECSA, respectively. Apparently, differences in the estimation of
average Pt particle size are seen, which can be ascribed to the difference in the definition of “average particle size”. The
estimation by TEM is made on the basis of particle number, although large particles include many Pt atoms. In XRD measurements, crystallinity is evaluated, in which information on the large crystallite can be obtained without detecting small particles below 1 nm. It is thus impossible to estimate the size of sub-nanoclusters. On the other hand, ECSA obtained from cyclic voltammetry (CV) measurements give the average particle size on the basis of Pt amount because ECSA (m2 g−1) is the surface area on the basis of Pt amount. In Table 1, the estimations by TEM agree with those by ECSA if the loading of Pt is less than 15%. That is because the particles are mostly composed of very small clusters so that the average size based on particle number is comparable with that based on Pt amount. Here, XRD cannot evaluate the size of sub-nanoclusters. On the other hand, for larger loadings over 55 wt % Pt, the average sizes evaluated by XRD agree with those by ECSA. This can be explained by the majority of large Pt crystallites. However, small particles always coexist with large particles, as shown in TEM images (Figure 2). That is why TEM measurements underestimate the average size of Pt particles if the Pt loading is larger than 20 wt %.
Interestingly, the average particle sizes of Pt catalysts at 25− 50 wt % estimated by XRD, TEM, and ECSA are very different.
Figure 7.CO stripping voltammograms of 10−70 wt % Pt/GNS and 20 and 40 wt % Pt/CB commercial catalysts measured in 0.1 M HClO4at 60
In XRD, the intensities of the Pt(111) peak are very weak, although ECSA estimates relatively large particles as 4−7 nm, indicating that the Pt particles have low crystallinity. One
possible explanation of the low crystallinity is the formation of Pt clusters with a raft-like structure because of the strong interface interaction between Pt and graphene forming the sub-nanoclusters of Pt.
4.2. Sub-Nanoclusters. The results of XRD, TEM, and ECSA experiments clearly indicate that many Pt sub-nano-clusters were formed for 10 wt % Pt/GNS, in which the surface area is found to be extremely high as 170 m2g−1. However, Pt sub-nanoclusters coexist with Pt nanoparticles (2−5 nm) for Figure 8.(a) Pt surface area (m2g−1) estimated by ECSA versus Pt
amount on GNS (wt %): ECASH(●), ECASCO(○). The results for the 20 and 40 wt % Pt/CB commercial catalysts are also shown: ECASH (▲), ECASCO (△). (b) Average Pt particle size (nm) estimated by ECSA versus Pt amount on GNS (wt %): ECASH(●), ECASCO(○). The results for the 20 and 40 wt % Pt/CB commercial catalysts are also shown: ECASH(▲), ECASCO(△).
Table 1. Average Pt Particle Size of Samples
average Pt particle size (nm) TEM
measurement
samples measurementXRD <5 nm >5 nm measurementECSA
10 wt % Pt/GNS 2.9 0.87 0.82
15 wt % Pt/GNS 3.1 1.03 1.18
20 wt % Pt/GNS 3.2 1.2 1.91
25 wt % Pt/GNS 3.3 1.5 2.74
30 wt % Pt/GNS 3.3 1.85 5.23 4.12
35 wt % Pt/GNS 3.5 2.01 5.3 5.2
40 wt % Pt/GNS 3.7 2.21 5.38 6.3
45 wt % Pt/GNS 4.0 2.32 5.54 6.6
50 wt % Pt/GNS 4.8 2.51 5.6 6.9
55 wt % Pt/GNS 7.8 2.73 5.74 7.87
60 wt % Pt/GNS 8.8 3.03 6.13 8.7
65 wt % Pt/GNS 12.1 3.25 7.96 13.6
70 wt % Pt/GNS 21.7 4.13 8.48 21.1
20 wt % Pt/CB
(commercial) 3.3 2.03 6.11 2.07
40 wt % Pt/CB
(commercial) 4.0 3.1 6.54 3.23
Figure 9. Threshold voltages of CO electro-oxidation peak in CO stripping voltammogram as a function of Pt amount on GNS (wt %) (□): (a)first measurement, (b) second measurement, and (c) third
15−50 wt % Pt/GNS. Although Pt catalysts supported by graphene have been extensively studied in the application of electrocatalysts, the formation of the Pt sub-nanoclusters has not frequently reported so far. The reason may be due to the preparation methods. In our preparation method of the Pt sub-nanoclusters, the combination of weak and strong reductions using ethanol and hydrogen is adopted, respectively, where Pt sub-nanoclusters are formed during the hydrogen reduction as reported elsewhere.13That is, Pt oxide particles formed by the ethanol reduction on graphene are then reduced to Pt atoms by hydrogen, which migrate on GNS to form Pt clusters by their collision. In this study, we found that the size of Pt clusters increases with increasing loading of Pt. The relationship between the cluster size and the Pt loading can be explained by an entropy effect that chance in the collision of Pt with each
other depends on the relative surface area of GNS to an amount of Pt atoms. That is, an increase in the amount of Pt causes high probability of the collision between Pt atoms, leading to the formation of larger Pt particles.
4.3. Particle Size Effects on Catalytic Properties.In this study, particle size effects on the catalytic properties of Pt have
been observed in electro-oxidation of adsorbed CO. For smaller Pt particles or sub-nanoclusters, so-called ignition voltages shift to be lower. That is, their catalytic activity in the electro-oxidation of adsorbed CO is higher compared to those of larger
Pt particles on graphene. The high catalytic activity and high ECSA of the Pt sub-nanoclusters is promising as a cost-effective
Pt catalyst.
A question arises as to why smaller Pt particles on graphene are more active for the electro-oxidation of adsorbed CO. The particle size dependence of Pt catalysts on the catalytic performances has been extensively studied for electro-oxidation of adsorbed CO and methanol oxidation reaction.19,22,25 However, the size effect is not straightforward because it is
known that the electro-oxidation of adsorbed CO is structure-sensitive on Pt and defects of Pt surface play a significant role in
the electro-oxidation of CO or methanol.22,26,27 It has been reported that the least active is the (111) terrace site of Pt, while step or kink sites are considered to dissociate water and stabilize OH adspecies as reactive intermediates.22Arenz et al. have clearly reported the importance of defects on Pt nanoparticles supported by carbon using infrared reflection−
absorption spectroscopy (IRAS).22 In their results of CO stripping experiments, the rate of CO2formation increased with increasing particle size (1 nm≤2 nm < 5 nm≪30 nm), which is the reverse order for the present Pt/GNS catalysts. They consider that large particles have“rougher”surfaces than small particles, which have some fairly smooth (111) facets. They also showed that the electro-oxidation activity of Pt particles is sensitively changed if the catalyst is annealed in CO-saturated solution by cycling of the electrode potential between 0.05 V <
E < 1.2 V for 5 min. The CO-annealing removes surface irregularities of Pt. In any case, Arenz et al. consider that defects are active sites for CO electro-oxidation. We also consider that edge Pt atoms at kink or step sites are active in Pt sub-nanoclusters on GNS. Note that the number of Pt atoms in the Pt sub-nanoclusters is very few below ∼40.13 In the case of small Pt sub-nanoclusters, many Pt atoms with low coordination numbers should be there at the edges of clusters, which are probably reactive for the dissociation of H2Oaor the reaction between COa and OHa. That is, the increase in the amount of Pt atoms with low coordination numbers on GNS for smaller Pt clusters such as for Pt sub-nanoclusters on GNS is probably the main origin of the promoted catalytic activity for the electro-oxidation of adsorbed CO. The specific character of
the Pt sub-nanoclusters is probably due to the support effect,
i.e., strong interface interaction between Pt atoms with the graphene sheet as described below.
4.4. Support Effects.The formation of Pt sub-nanoclusters as well as the superior catalytic properties for the electro-oxidation of CO can be ascribed to the support effect or the
interface interaction between Pt and graphene. There have been many theoretical reports concerning the support effect of
graphene on the properties of Pt electrocatalysts, although the experimental works on the support effect of graphene and the
size dependence of Pt are scarce. To the best of our knowledge, the present study is thefirst experimental report concerning the
size dependence of Pt clusters supported by GNS on the catalytic properties and the electronic structure. The present results clearly indicate that the support effects are more
significant for smaller Pt clusters in terms of the catalytic
activity of the electro-oxidation of adsorbed CO as well as the core level of Pt 4f.
The interaction between Pt and graphene is considered to be
π−d hybridization. Even for graphite supported Pt catalysts, the interface interaction has been observed between Pt and graphitic carbon. We have studied the support effect of
graphite on Pt catalysts by surface science methods using a Pt-Figure 10.XPS spectra of 10−70 wt % Pt/GNS and 20 and 40 wt %
Pt/CB commercial catalysts in the Pt 4f region. The results for the 20 and 40 wt % Pt/CB commercial catalysts are also shown.
deposited graphite model catalyst.28−33
We have found the formation of Pt monolayer clusters, which promote activity for H2−D2exchange reaction and CO desorption.28,29 It has also been found that the Pt monolayer clusters are more stable on a nitrogen-doped graphite.30 This suggests that π states in the conjugated system determine the properties of the interaction between Pt and carbon. As a modifiedπstate, nonbondingπ
states may be responsible for theπ−d hybridization.31We have thus studied the local electronic structure in the vicinity of vacancies and doped nitrogen by scanning tunneling spectros-copy (STS), and found that the nonbonding local states propagate from the vacancies or the doped nitrogen.32,33 We thus consider that the support effect observed in the graphene
case is also ascribed to the π−d hybridization. However, the interaction between Pt and graphene seems to be more significant compared to that of graphite because the formation
of Pt sub-nanoclusters seen in Pt/GNS catalysts has never been observed on graphite or nitrogen-doped graphite. We assume that the difference between graphite and graphene is ascribed to
the presence and absence of weak hybridization of pz orbitals between graphene layers.
As described in section 3.6, the large core level shift of Pt 4f is observed toward higher BE for smaller Pt clusters on GNS, which clearly indicates larger interface interactions between Pt and GNS for smaller Pt clusters. This is probably due to the increase in the amount of Pt atoms with low coordination numbers for smaller Pt clusters on GNS. That is, low coordinated Pt atoms such as edge Pt atoms in the Pt sub-nanoclusters make the strong π−d hybridization with carbon atoms of GNS. As a result, smaller Pt clusters on GNS show larger core level shifts in Pt 4f. The π−d hybridization in Pt clusters on graphene has been reported in theoretical reports. Basically, theπ−d hybridization is weak compared with the Pt− Pt bonding in Pt clusters. The interaction between Pt and graphene is more significant for smaller Pt
nclusters (n= 1−5), in which edge Pt atoms in Pt clusters interact with graphene more strongly.10,11 In addition, a raft-like structure of Pt clusters has been reported as a stable geometry.10,11 In this sense, the results in the present study are consistent with those of theoretical reports in terms of more significant interactions
between Pt and graphene for smaller Pt sub-nanoclusters.
5. CONCLUSIONS
We have successfully controlled the average size of Pt particles by changing Pt loading on GNS from 10 to 70 wt %. At a low loading of 10 wt %, Pt sub-nanoclusters are formed, showing a high surface area of 170 m2g−1. The 10 wt % Pt/GNS catalyst exhibits the best performance in the electro-oxidation of adsorbed CO. Therefore, Pt sub-nanoclusters can be expected as excellent electro-oxidation catalysts. An increase in the loading of Pt leads to an increase in the particle size of Pt, resulting in the lower activities for electro-oxidation of adsorbed CO. The core levels of Pt in the electronic structure for Pt sub-nanoclusters are shifted to higher binding energies, indicating chemical interaction between Pt and graphene. The interaction is explained byπ−d hybridization.
■
ASSOCIATED CONTENT*
S Supporting InformationAdditionalfigures of experimental results and references. This
material is available free of charge via the Internet at http:// pubs.acs.org.
■
AUTHOR INFORMATIONCorresponding Author
*E-mail: nakamura@ims.tsukuba.ac.jp. Phone and Fax:
+81-29-853-5279.
Notes
The authors declare no competingfinancial interest.
■
ACKNOWLEDGMENTSThis work was partially supported by the New Energy and Industrial Technology Development Organization (NEDO) Japan.
■
REFERENCES(1) Geim, A. K.; Novoselov, K. S. The Rise of Graphene.Nat. Mater. 2007,6, 183−191.
(2) Antolini, E. Graphene as a New Carbon Support for Low-Temperature Fuel Cell Catalysts.Appl. Catal., B2012,123−124, 52−
68.
(3) Dong, L.; Gari, R. R. S.; Li, Z.; Craig, M. M.; Hou, S. Graphene-Supported Platinum and Platinum−Ruthenium Nanoparticles with High Electrocatalytic Activity for Methanol and Ethanol Oxidation.
Carbon2010,48, 781−787.
(4) Bong, S.; Kim, Y. R.; Kim, I.; Woo, S.; Uhm, S.; Lee, J.; Kim, H. Graphene Supported Electrocatalysts for Methanol Oxidation. Electro-chem. Commun.2010,12, 129−131.
(5) Yoo, E. J.; Okada, T.; Akita, T.; Kohyama, M.; Nakamura, J.; Honma, I. Enhanced Electrocatalytic Activity of Pt Subnanoclusters on Graphene Nanosheet Surface.Nano Lett.2009,9, 2255−2259.
(6) Yoo, E. J.; Okada, T.; Akita, T.; Kohyama, M.; Honma, I.; Nakamura, J. Sub-nano-Pt Cluster Supported on Graphene Nano-sheets for CO Tolerant Catalysts in Polymer Electrolyte Fuel Cells.J. Power Sources2011,196, 110−115.
(7) Tang, Y.; Yang, Z.; Dai, X. A Theoretical Simulation on the Catalytic Oxidation of CO on Pt/Graphene.Phys. Chem. Chem. Phys. 2012,14, 16566−16572.
(8) Rochefort, A.; Yang, D. Q.; Sacher, E. Stabilization of Platinum Nanoparticles on Graphene by Non-Invasive Functionalization.
Carbon2009,47, 2233−2238.
(9) Kim, G.; Jhi, S. Carbon Monoxide-Tolerant Platinum Nano-particle Catalysts on Defect-Engineered Graphene.ACS Nano2011,5, 805−810.
(10) Blonski, P.; Hafner, J. Geometric and Magnetic Properties of Pt Clusters Supported on Graphene: Relativistic Density-Functional Calculations.J. Chem. Phys.2011,134, 154705-1−154705-12.
(11) Kim, G.; Kawazoe, Y.; Lee, K. Controlled Catalytic Properties of Platinum Clusters on Strained Graphene.J. Phys. Chem. Lett.2012,3, 1989−1996.
(12) Okazaki-Maeda, K.; Morikawa, Y.; Tanaka, S.; Kohyama, M. Structures of Pt Clusters on Graphene by First-Principles Calculations.
Surf. Sci.2010,604, 144−154.
(13) Siburian, R.; Nakamura, J. Formation Process of Pt Subnano-Clusters on Graphene Nanosheets. J. Phys. Chem. C 2012, 116, 22947−22953.
(14) Yoo, E. J.; Kim, J.; Hosono, E.; Zhou, H. S.; Kudo, T.; Honma, I. Large Reversible Li Storage of Graphene Nanosheet Families for Use in Rechargeable Lithium Ion Batteries. Nano Lett. 2008, 8, 2277−
2282.
(15) Seger, B.; Kamat, P. V. Electrocatalytically Active Graphene-Platinum Nanocomposites. Role of 2-D Carbon Support in PEM Fuel Cells.J. Phys. Chem. C Lett.2009,113, 7990−7995.
(16) Søgaard, M.; Odgaard, M.; Skou, E. M. An Improved Method for the Determination of the Electrochemical Active Area of Porous Composite Platinum Electrodes.Solid State Ionics2001,145, 31−35.
(18) Vidakovic, T.; Christov, M.; Sundmacher, K. The Use of CO Stripping for in Situ Fuel Cell Catalyst Characterization.Electrochim. Acta2007,52, 5606−5613.
(19) Cherstiouk, O. V.; Simonov, P. A.; Savinova, E. R. Model Approach to Evaluate Particle Size Effects in Electrocatalysis: Preparation and Properties of Pt Nanoparticles Supported on GC and HOPG.Electrochim. Acta2003,48, 3851−3860.
(20) Murugan, V. A.; Muraliganth, T.; Manthiram, A. Rapid, Facile Microwave-Solvothermal Synthesis of Graphene Nanosheets and Their Polyaniline Nanocomposites for Energy Strorage. Chem. Mater.2009,21, 5004−5006.
(21) Pozio, A.; De Francesco, M.; Cemmi, A.; Cardellini, F.; Giorgi, L. Comparison of High Surface Pt/C Catalysts by Cyclic Voltammetry.J. Power Sources2002,105, 13−19.
(22) Arenz, M.; Mayrhofer, K. J. J.; Stamenkovic, V.; Blizanac, B. B.; Tomoyuki, T.; Ross, P. N.; Markovic, N. M. The Effect of the Particle Size on the Kinetics of CO Electrooxidation on High Surface Area Pt Catalysts.J. Am. Chem. Soc.2005,127, 6819−6829.
(23) Moulder, J.; Stickle, W. F.; Sobol, P. E.; Bomben, K. D.
Handbook of X-ray Photoelectron Spectroscopy; Perkin Elmer Corpo-ration: Eden Prairie, MN, 1992.
(24) Bittencourt, C.; Hecq, M.; Felten, A.; Pireaux, J. J.; Ghijsen, J.; Felicissimo, M. P.; Rudolf, P.; Drube, W.; Ke, X.; Tendeloo, G. V. Platinum−Carbon Nanotube Interaction.Chem. Phys. Lett.2008,462, 260−264.
(25) Maillard, F.; Savinova, E. R.; Simonov, P. A.; Zaikovskii, V. I.; Stimming, U. Infrared Spectroscopic Study of CO Adsorption and Electro-Oxidation on Carbon-Supported Pt Nanoparticles: Interpar-ticle versus IntraparInterpar-ticle Heterogeneity. J. Phys. Chem. B 2004,108, 17893−17904.
(26) Garcia, G.; Koper, M. T. M. Stripping Voltammetry of Carbon Monoxide Oxidation on Stepped Platinum Single-Crystal Electrodes in Alkaline Solution.Phys. Chem. Chem. Phys.2008,10, 3802−3811.
(27) Lee, S. W.; Chen, S.; Suntivich, J.; Sasaki, K.; Adzic, R. R.; Horn, Y. S. Enhancing Oxygen Reduction Reaction Activity via Pd−Au Alloy Sublayer Mediation of Pt Monolayer Electrocatalysts.J. Phys. Chem. Lett.2010,1, 1316−1320.
(28) Kondo, T.; Izumi, K.; Watahiki, K.; Iwasaki, Y.; Suzuki, T.; Nakamura, J. Promoted Catalytic Activity of a Platinum Monolayer Cluster on Graphite.J. Phys. Chem. C2008,112, 15607−15610.
(29) Oh, J.; Kondo, T.; Hatake, D.; Iwasaki, Y.; Honma, Y.; Suda, Y.; Sekiba, D.; Kudo, H.; Nakamura, J. Significant Reduction in Adsorption Energy of CO on Platinum Clusters on Graphite. J. Phys. Chem. Lett.2010,1, 463−466.
(30) Kondo, T.; Suzuki, T.; Nakamura, J. Nitrogen Doping of Graphite for Enhancement of Durability of Supported Platinum Clusters.J. Phys. Chem. Lett.2011,2, 577−580.
(31) Kondo, T.; Iwasaki, W.; Honma, Y.; Takagi, Y.; Okada, S.; Nakamura, J. Formation of Nonbonding π Electronic States of Graphite due to Pt-C Hybridization.Phys. Rev. B2009,80, 233408-1−
233408-4.
(32) Kondo, T.; Honma, Y.; Oh, J.; Machida, T.; Nakamura, J. Edge States Propagating from a Defect of Graphite: Scanning Tunneling Spectroscopy Measurements. Phys. Rev. B 2010, 82, 153414-1−
153414-4.
(33) Kondo, T.; Casolo, S.; Suzuki, T.; Shikano, T.; Sakurai, M.; Harada, Y.; Saito, M.; Oshima, M.; Trioni, M. I.; Tantardini, G. F.; et al. Atomic-Scale Characterization of Nitrogen-Doped Graphite: Effects of Dopant Nitrogen on the Local Electronic Structure of the Surrounding Carbon Atoms.Phys. Rev. B2012,86, 035436-1−