Agricultural Socio-Economics Journal P-ISSN: 1412-1425 | E-ISSN: 2252-6757
Volume XVI, Number 01 (2016): 01-11
PERSPECTIVE OF CATTLE DEVELOPMENT
SCHEME IN TUBAN-EAST JAVA
Kuntoro Boga Andri
1*, Rita Indrasti
2, and Nugraha Pangarsa
31 Riau
Assessment Institute for Agricultural Technology, IAARD-Ministery of Agriculture, Indonesia
2Agricultural Technology Assessment and Development Center, IAARD-Ministery of Agriculture,
Indonesia
3East Java Assessment Institute for Agricultural Technology, IAARD-Ministry of Agriculture, Indonesia
*corresponding author: [email protected]
ABSTRACT
: Tuban is one of primary areas of beef cattle development in East Java, Indonesia. However, poor food quality and cement as well as lack of good breeding result in slow development of livestock population in the regency. Moreover, the attempt to support beef self-sufficiency in Tuban was less than expected. The implementation of cattle development policies caused this to happen. This research used analysis of dynamic system which including the following phases: (1) developing causal loop diagram, (2) identifying and collecting quantitative data, (3) generating stock and creating flowchart in Powersim, (4) validating data, and (5) conducting simulation. The purpose of this research was to establish the policy and programme of beef cattle commodity development in Tuban. The research results show the mportant aspect of the development program which are: (a) Maintaining Tuban reputation as one of primary cattle product supplier across East Java and nationally (expected until 2021 with downward trend); (b) Increasing cattle population target up to 50 %, improving ineffective feed and production patterns; (c) Achieving beef production surplus up to 2012. From these results, some policy suggestions are: (1) maintaining/ boosting cattle population, (2) suspending beef/ cattle product imports, (3) developing value and benefits of derivative products such as bio-industry or otherwise waste utilization used to improve activities in agricultural sector.Keywords: dynamic system, beef self-sufficiency, institutional innovation
INTRODUCTION
East Java is basis area of national beef cattle supplier. Its production used to suffice regional and other province needs. According to data of cattle population in East Java during 2008-2011, it shows the increase number of cows for 3,328,824 cows, 3,559,205 cows, 3,745,453 cows, 4,745,453 cows, respectively, with an average growth of 4% per year. Data of meat production also shows an upward trend during the same year for 92.653 tons, 96.948 tons, 98.821 tons and 103.243 tons respectively (Winarso, et al 2005; Disnak East Java, 2013).
The attempt to improve cattle population in East Java relatively has great chance because it is supported by the availability of feed from agricultural waste and residual agricultural products. The development of beef cattle in terms of meat self-sufficiency in East Java is greatly supported by its geographic condition.
This area has irrigated land approximately 1,159,592 ha in 2007, which mostly planted with rice 2-3 times a year and it also has 1.225.100 million ha of dry land in East Java. This geographic condition provides potential benefit in providing cattle feed (BPS, 2011).
carefully (Kariyasa, 2005; Ferdiman 2007; Setiawan, 2014)
In East Java, typical breeder problems are the continuity of breeds supply and high price of breeds which is not affordable for them. On the other hand, there is lack of effectiveness and efficiency to the local specific feed and the dissatisfactory of cattle marketing as well. Bargaining position of farmers remains lower comparing to the middleman (broker) in marketing channel. It results in farmers cannot obtain good profit from their cattle business. Furthermore, many farmer groups remain unable to master agribusiness management aspects and the importance of partnership with entrepreneurs (Bahri and Inouno, 2004; Priyanti, et al, 2012; Kalangi, et al, 2014).
Common strategy in achieving target of beef self-sufficiency conducted through the achieved number of cattle mating up to an average of 1.55 in gestation period. Range of birth is less than 14 months and achieving gestation period rate of 70%. In term of number, mating cattle to the gestation period is still low, which is more than 3 times. These conditions certainly affect range of birth for 18-24 months and the birth rate of 21% (Santi, 2008; Ashari et al, 2012; Ariningsih, 2014).
Beef cattle reproductive capacity also influenced by feed quality, lust detection, appropriate mating time, health care and cleanliness of cattle environment (Tolihere, 1985). According to Wardani et al. (1993) feed can be improved by adding 1.5% concentrate of body weight. Madura cattle may also enhance body weight and reproductive capacity. Agricultural waste in each region also can be used for cattle feed (Setiyono, et al, 2007). Agricultural waste which has been used to support beef cattle feed in Tuban comes from several crops waste, such as rice, soybean, corn, peanut and cassava (Sariubang and Herniwati 2011; Syamsu, 2007).
This study used a dynamic system approach to analyze variables related to the efforts in achieving beef self-sufficiency. Dynamic system approach is a method introduced by Jay Forrester and developed at MIT (Massachusetts Institute of Technology), USA. This method closely related to the questions about dynamic tendencies and complex systems, behavioral patterns generated by the system as with the increasing time (Forrester, 2009; Fisher, 2004).
Dynamic methodology system basically uses causal relationship (causal) in developing complex system model, as a basis in identifying and understanding dynamic behavior of the system. A dynamic system model created due to causal relationship (causal) that affect the structure either directly between two structures or a result from various relationships in the structure and to create feedback (causal loop). Dynamics system model is commonly analyzed using several packages software such as Powersim, Vensim, Stella and Dynamo. With the packages software, the model is created graphically using symbols on the variables and its relationship (Rouwette, et al, 2002; Richardson, 2006; Visser, M. 2007).
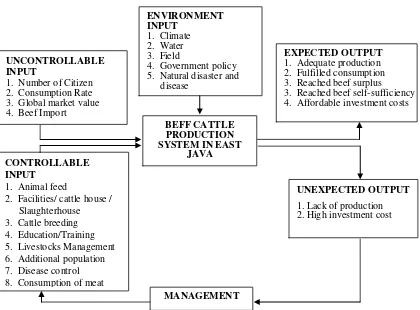
In beef cattle production system, there are several elements that can be controlled. However, there are many elements that cannot be controlled as well as dynamic strategic environmental factors. In the analysis of dynamic system, black box diagram is used, which describes both controllable element input and uncontrollable element input and whether or not it will produce the desired output (Figure 1).
The significance of this study was to establish policy and programme of beef commodity development in Tuban. The applied method in this study was to produce comprehensive policy in order to achieve beef self-sufficiency through the analysis of dynamic system approach.
RESEARCH METHOD
This research was conducted on August to November 2014. Before data collection, beef self-sufficiency model of the districts had been prepared previously through FGD to the stakeholders (development planning agency, agriculture office, Agricultural Extension Office, farmers and cow slaughterhouse/CSH). This model was prepared by identifying all constraints and opportunities that further formulated in causal loop diagram. Causal loop diagram is a flowchart describing interaction between parameters/variables in the system comprised of subsystems consumption and production.
Perspective of Cattle Development …
Agricultural Socio-Economics Journal Volume XVI, Number 01 (2016): 01-11 3
understanding data/ information, the observation was followed by FGD and continued to the
stakeholders in two districts.
Figure 1. Beef cattle production system in East Java using black box diagram (Surachman et al., 2012)
The variables that determine beef self-sufficiency are measured as follows: number of livestock breeders, the rate of livestock population, mortality rate of calves, calving interval, food technology, carried food, population, meat consumption per capita per year and the rate of cattle slaughtering in slaughterhouse and so forth. By identifying the variables and through simulation, beef surplus and insufficiency are calculated (Table 1).
RESULT AND DISCUSSION
Causal Flowchart and Supporting Data
The analysis of dynamic system started with causal flowchart preparation (causal loop diagram) and developed through FGD by involving stakeholders. In the diagram, there were two specific parameters, consumption and production. Consumption parameter affected by population size variable, rate of population growth and consumption per capita. Consumption calculation also could be calculated from the number of cattle slaughtering in slaughterhouse (for comparison). Production
parameter affected by many variables such as the number of cattle sire, the number of female calf, calf mortality and calving interval. There were few programs or activities that may affect production such as AI (Artificial Insemination), introduction to the forage improvement, building Village Breeding Centre (VBC) and animal health. Meat surplus was calculated and displayed on Figure 2.
From Figure 2, it could be concluded that the beef consumption strongly affected by the rate of population growth and consumption per capita per year. The increasing rate of population growth had implication both for the increasing number of consumption per capita and the increasing of meat production needs. The amount of meat production would be greatly affected by the rate of calf population growth. In addition to the rate of calf population growth, meat production also determined by the number of cattle breeders, governance management of cattle farming, prevention and treatment of diseases, provision of quality fodder and AI, which is farmer decision point. Farmer decision could be assessed by the rate of adoption and the level of ENVIRONMENT
INPUT 1. Climate 2. Water 3. Field
4. Government policy 5. Natural disaster and
disease UNCONTROLLABLE
INPUT
1. Number of Citizen 2. Consumption Rate 3. Global market value 4. Beef Import
EXPECTED OUTPUT 1. Adequate production 2. Fulfilled consumption 3. Reached beef surplus 3. Reached beef self-sufficiency 4. Affordable investment costs
CONTROLLABLE INPUT
1. Animal feed
2. Facilities/ cattle house / Slaughterhouse 3. Cattle breeding 4. Education/Training 5. Livestocks Management 6. Additional population 7. Disease control 8. Consumption of meat
UNEXPECTED OUTPUT
1. Lack of production 2. High investment cost BEFF CATTLE
PRODUCTION SYSTEM IN EAST
JAVA
farmer knowledge to the livestock farming technologies. Counseling aspect (extension
mentoring) is one aspect of breeding technology towards transfer and business management.
Table 1. Quantitative data / key variable of dynamic system analysis
No Description Value Data
Source No Description Value
Data Source
A Sub System Production B Consumption Sub System
1 Number of cattle population
as the initial calculation 312,012
Disperta
2013 1 Tuban Population 2011 1,124,757
BPS Tuban 2
Comparison between livestock physiological status and the number of adult female (47.35%)
The percentage of culled
cows per year 15% FGD group 3 / males born calf (initial number of male and female population taken into
The rate of population
growth 0.9 % Disperta
2013 5
Cutting cows in slaughterhouse in 2011 (preliminary data)
19.845 heads Disperta 2013 The percentage of female
calf became sires from total number of female calf
1.63% Processed
Percentage of male calves ready for slaughtering (can be fattened)
livestock 2.5 liter
Various sources 9 Average of cattle carcasses 46.5% Wardhani
et al., 1993 22
Blood volume / cattle
of weight 3.50%
Various sources 10 Calving interval within 18
months 60% FGD group 23
Bone Volume / cattle
of weight 25%
(limited feed) 149,327 Processed Data 24
(a) productive female cattle are not slaughtered/ sold, (b) culled dams commonly slaughtered, (c) VBC program: 300 cows ready for mating, 7-9 supperior males, in a communal cow house and in one business management.
Agricultural Socio-Economics Journal P-ISSN: 1412-1425 | E-ISSN: 2252-6757
Volume XVI, Number 01 (2016): 01-11
Figure 2. Flowchart of causal production / beef consumption
From FGD, the obtained information showed that there was less favorable conditions to the development of beef cattle in the research location of repeated mating (AI and natural mating) and gestation period rate remained low
(≤ 60%). Other common conditions were
nutritional factors and poor cement quality, also high operating costs (particularly for feed manufacturing) resulted in the longer distance of birth.
Model Validation
Prior validation model performed to the analysis through model simulation related to reality field. Validation was conducted to a number of people and cattle populations from 2011 to 2013. This model stated as valid if Mean Square Error (MSE) is less than 5% (Suryani, 2006). The results of validation test showed that MSE was less than 5% for each parameter of population, cattle population and the number of cattle slaughtering in slaughterhouses (Appendix Table 1).
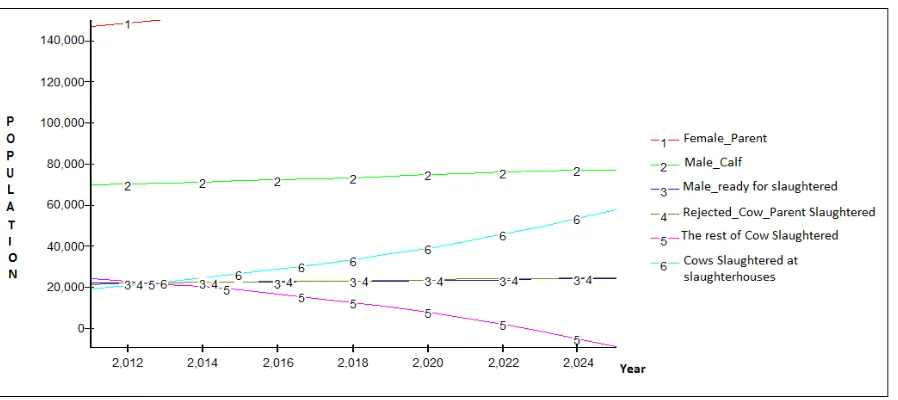
Existing conditions with Sufficient Feed The result of cattle population dynamic on feed existing condition can be seen in Figure 3. It could be assumed to be sufficient. While the dynamic of beef consumption shown in Figure 4. The curve showed that Tuban tends to downward
of beef surplus due to decreasing number of slaughtered cattle. The dynamic of population was very difficult to develop since current feed volume was insufficient (dry season). There was lack of some of agricultural wastes such as bran, corn tumpi, dried cassava and forage such as grass, leaves of Gliricidia, Leucaena and Turiare. Those were getting limited and the consumption was competed with other ruminants.
The statistical data of cattle population in Tuban in 2012 was 314,810 cattle and decreased to 311,359 in 2013. The level of cattle population growth remained in satisfaction level. However, the growth was not followed by the utilization of livestock waste to produce bio products in order to improve its additional value, for instance, organic manure, blood meal, bio urine and biogas. Unfortunately, it was not accompanied by a good marketing strategy. Consequently, it would make the breeder fail to earn additional income.
Feed Availability
however, farmers need to use organic fertilizer derived from rice straw. The main feed only comes from maize straw (cobs and leaves), soybean and peanut hay. When the calculation of feed sources derived agricultural waste was carried by districts/ agro-ecology, then there was possibility of unequally balanced feed spread availability from agricultural waste.
There were districts which dominant with cassava with insufficient hay and in contrast to the other districts. Therefore, we needed to develop transportation model in order to enable distribution from one to another area, so as it resulted in apportionment of feed availability.
Figure 3. The dynamics of cattle population and slaughtered beef in Tuban on existing condition and fair feed (2011-2025)
Perspective of Cattle Development …
Agricultural Socio-Economics Journal Volume XVI, Number 01 (2016): 01-11 7
Table 2. Total availability and requirement of beef cattle feed Types of agricultural
waste
Needs per day / head (kg)
Needs per year / head (ton)
Total needs (ton) *)
Availability per year (ton) Gliricidia / Leucaena
leaves
1.5 0.5 156,006 -
Forage 20 7.3 2,277,688 106,254
Dry corn straw 1.6 0.6 187,207 2,588,404
Corn cob 1.0 0.4 124,804 1,479,088
Corn tumpi 1.0 0.4 124,804 161,775
Dried Cassava 1.0 0.4 124,804 68,064
Bran KW1 2.0 0.8 249,609 37,036
Rice straw 1.25 0.5 156,006 370,364
soybean and peanut hay 1.0 0.4 124,804 153,308
*)Total cow population 312,012 (2011)
Figure 6. The dynamics of cattle slaughtering population in csh and time of beef ready to be slaughtered without intervention (2011-2025)
Figure 7. The dynamics of cattle slaughtering population in csh and time of beef ready to be slaughtered with AI intervention (2011-2025)
Table 3. The dynamics of cattle slaughtering population in CSH and time of cow ready to be slaughtered without intervention (2011-2025)
Year Slaughtered Cow in CSH
Male ready to be
slaughtered Rejected slaughtering
the rest of slaughtering
2011 19,845.00 22,288.55 22,160.55 24,604.10
2012 21,432.60 22,480.45 22,399.05 23,446.90
2013 23,147.21 22,480.45 22,399.05 21,732.29
2014 24,998.98 22,480.45 22,399.05 19,880.51
2015 26,998.90 22,480.45 22,399.05 17,880.59
2016 29,158.82 22,480.45 22,399.05 15,720.68
2017 31,491.52 22,480.45 22,399.05 13,387.97
2018 34,010.84 22,480.45 22,399.05 10,868.65
2019 36,731.71 22,480.45 22,399.05 8,147.79
2020 39,670.25 22,480.45 22,399.05 5,209.25
2021 42,843.87 22,480.45 22,399.05 2,035.63
2022 46,271.38 22,480.45 22,399.05 -1,391.88
2023 49,973.09 22,480.45 22,399.05 -5,093.59
2024 53,970.93 22,480.45 22,399.05 -9,091.44
Perspective of Cattle Development …
Agricultural Socio-Economics Journal Volume XVI, Number 01 (2016): 01-11 9
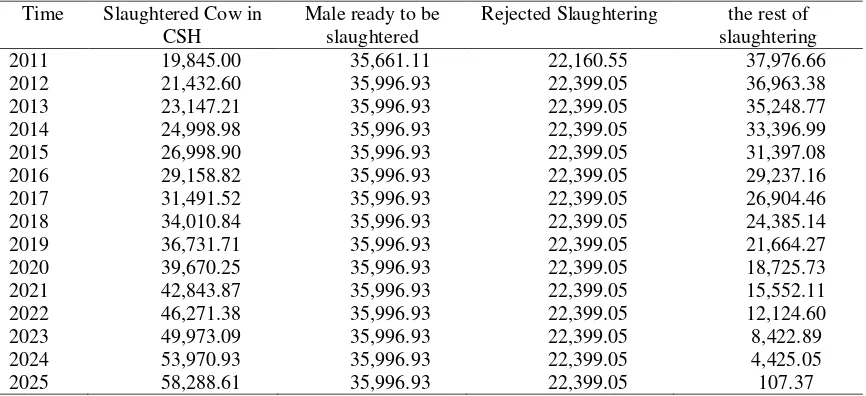
Table 4. The dynamics of cattle slaughtering population in CSH and time of cow ready to be slaughtered with AI intervention (2011-2025)
Time Slaughtered Cow in CSH
Male ready to be slaughtered
Rejected Slaughtering the rest of slaughtering
2011 19,845.00 35,661.11 22,160.55 37,976.66
2012 21,432.60 35,996.93 22,399.05 36,963.38
2013 23,147.21 35,996.93 22,399.05 35,248.77
2014 24,998.98 35,996.93 22,399.05 33,396.99
2015 26,998.90 35,996.93 22,399.05 31,397.08
2016 29,158.82 35,996.93 22,399.05 29,237.16
2017 31,491.52 35,996.93 22,399.05 26,904.46
2018 34,010.84 35,996.93 22,399.05 24,385.14
2019 36,731.71 35,996.93 22,399.05 21,664.27
2020 39,670.25 35,996.93 22,399.05 18,725.73
2021 42,843.87 35,996.93 22,399.05 15,552.11
2022 46,271.38 35,996.93 22,399.05 12,124.60
2023 49,973.09 35,996.93 22,399.05 8,422.89
2024 53,970.93 35,996.93 22,399.05 4,425.05
2025 58,288.61 35,996.93 22,399.05 107.37
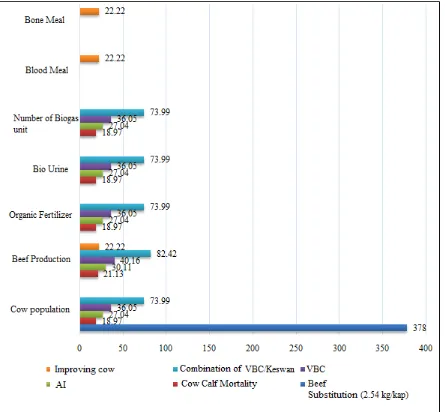
Sensitivity Analysis (Simulation) 2015
To obtain rate of the population increase, production of meat and livestock waste which resulted from intervention determinant variable, then simulation was conducted in 2015 (see Figure 5).
In that simulation, feed limitation had been taken into account. Therefore, the population was limited which only 149,327. The result of simulation showed several things: (a) to increase livestock population, then the most obvious variable was reduction of meat consumption (meat substitution). If meat consumption is assumed only for 2.54 kg/ cap/ year, cattle population will reach threefold from the current population, (b) combination of VBC and animal health could increase up to 74%, followed by VBC (36%), AI (27%) and animal health/ pressing calf mortality (19%), (c) to increase the meat production, then feed improvement only could increase meat production by 22%, while contribution of AI and VBC variable even greater by 30% and 40%. (d) volume of animal waste was explained in the variables above.
If there is no intervention/ established policy, consequently in 2022, Tuban district will lack of population approximately 1,391 cattle for slaughtering in order to fulfill meat demand (see Figure 6, Table 3). By effectively employing AI program, then until 2025, there will be surplus of 107 cattle (see Figure 7 and Table 4). Beef cattle surplus will be resulted even greater if VBC and animal health are implemented.
According to the beef cattle production system in Tuban, it could be identified that
volume of organic manure could produced by 1,150,000 tons a year in minimum. This volume was predicted as sufficient to produce a biogas for 52,000 units approximately. In case that this system can be well-implemented, there will be public funding saving up to IDR 34,944,000,000,- towards household energy financial needs each year (assuming each household should pay IDR 672,000.- for energy sources. If each hectare of organic cropland needs 10 tons fertilizer/ ha, volume of beef cattle waste will be sufficient for 115,000 ha approximately, while the harvested crop area in Tuban is 92.443 ha/ year maximum.
CONCLUSION AND SUGGESTION
The analysis results of dynamic system approach illustrated that Tuban district's reputation as meat/ livestock supplier in East Java and nationally able to be maintained until 2021 in a downward trend. However, increasing target of the cattle population up to 50% was difficult to be achieved due to several constratints related to ineffective pattern of feed and production.
(f) improving marketing management among farmers, (g) developing VBC, (h) strengthening and enlarging breeding business/ sales and fattening all at once, (i) strengthening agricultural waste feed support by improving crops productivity.
REFERENCES
Ariningsih, Ening. (2014). Kinerja Kebijakan Swasembada Daging Sapi Nasional. Forum Agro Ekonomi Vol.32 No.02. Jurnal Pusat Penelitian Sosial Ekonomi dan Kebijakan Pertanian. Bogor.
Ashari, N. Ilham, dan S. Nuryanti. (2012). Dinamika Program Swasembada Daging Sapi: Reorientasi Konsepsi dan Implementasi. ANALISIS Kebijakan Pertanian Vol. 10(1), p.181-198. Jurnal Pusat Penelitian Sosial Ekonomi dan Kebijakan Pertanian. Bogor.
Bahri S, B. Setiadidan I. Inouno. (2004). Arah Penelitian dan Pengembangan Peternakan Tahun 2005-2009. Prosiding Seminar Nasional Teknologi Peternakan danVeteriner, Bogor, 4-5 Agustus 2004. Pusat Penelitian dan Pengembangan Peternakan, Bogor.
BPS (Biro Pusat Statistik). (2011). Jawa Timur Dalam Angka. Biro Pusat Statistik Provinsi Jawa Timurf
Disnak Jatim (Dinas Peternakan Provinsi Jawa Timur). (2013). Laporan Tahunan. Program Peternakan Provinsi Jawa Timur. Dinas Peternakan Provinsi Jawa Timur.
Ferdiman, B. (2007). Strategi Pengembangan Usaha Penggemukan Sapi Potong PT Kariyana Gita Utama Sukabumi. Skripsi. Fakultas Peternakan Institut Pertanian Bogor.
Fisher, Diana M. (2004). Modeling Dynamic Systems: Lessons for a First Course. Lebanon, NH: isee Systems.
Forrester, Jay W. (2009). Some Basic Concepts in System Dynamics. Spring Paper D-4894. Sloan School of Management Massachusetts Institute of Technology
Kalangi, L.S, Y. Syaukat, S. U. Kuntjoro, A. Priyanti. (2014). Technical Efficiency of Beef Cattle Breeding Business in East Java Province. Media Peternakan, August 2014, 37(2):136-142.
Kariyasa, K. (2005). Sistem Integrasi Tanaman ternak dalam Perspektif Reorientasi Kebijakan Subsidi Pupuk dan Peningkatan Pendapatan Petani. Jurnal Analisis Kebijakan Pertanian 3(1): 68−80.
Priyanti, Atien, V.W. Hanifah, I.G.A.P. Mahendri, F. Cahyadi and R.A. Cramb.(2012). Small-Scale Beef Cattle Production in East Java, Indonesia. Contributed paper prepared for presentation at the 56th AARES annual conference, Fremantle, Western Australia, February 7-10, 2012.
Richardson, GP. (2006). Anatomy of a group model-building intervention: building dynamic theory from case study research. Syst. Dyn. Rev. 22, 291–320
Rouwette, EAJA, Vennix JAM, van Mullekom T. (2002). Group model building effectiveness: review of assessment studies. Syst. Dyn. Rev. 18, 5–45.
Santi, W.P. (2008). Respons Penggemukan Sapi PO dan Persilangannya sebagai Hasil IB terhadap Pcmberian Jerami Padi Fermentasi dan Konsentrat di Kabupaten Blora.Skripsi. Fakultas Peternakan Institut Pertanian Bogor.
Sariubang, M. dan Herniwati, (2011).Sistem pertanaman dan produksi biomasa jagung sebagai pakan ternak. Balai Pengkajian Teknologi Pertanian, Sulawesi Selatan. Makalah seminar Nasional Serealia.
Setiawan, Ari. (2014). Kajian Daya Dukung Lingkungan untuk Peternakan Sapi Potong di Kecamatan Kerek Kabupaten Tuban. Jurnal Online UniversitasNegeri Surabaya.
Setiyono, P.B.W.H.E., Suryahadi, T. Torahmat, dan R. Syarief. (2007). Strategis uplementasi protein ransum sapi potong berbasis jerami dan dedak padi. Jurnal Ilmu Pengetahuan dan Teknologi Peternakan 30(3): 207−217.
Perspective of Cattle Development …
Agricultural Socio-Economics Journal Volume XVI, Number 01 (2016): 01-11 11
Syamsu, JA., (2007). Potensi jerami kacang tanah sebagai sumber ternak ruminansia di Sulawesi Selatan. Fakultas Peternakan, Universitas Hasanudin, Makasar. Makalah Seminar Teknologi Peternakan dan Veteriner, Puslitbang Peternakan, Deptan, Bogor.
Tolihere, M.R. (1993). Inseminasi Buatan pada ternak. Cetakan ke 10. Penerbit Angkasa, Bandung.
Visser, M. (2007). System dynamics and group facilitation: contributions from communication theory. Syst. Dyn. Rev. 23, 453–463.
Wardhani M.K. A. Mushofi, U. Umiyasih, L. Affandi, M.A. Yusrandan D.B. Wiyono. (1993). Pengaruh Perbaikan Gizi terhadap kemampuan reproduksi sapi Madura. Pros. Pertemuan Ilmiah. Hasil Penelitian dan Pengembangan Sapi Madura Sub. Balitnak Grati, hlm 164-167.
Winarso, B, R. Sajutidan C. Muslim. (2005). Tinjauan Ekonomi Ternak Sapi Potong di JawaTimur. Forum Penelitian Agro-Ekonomi 23(1) : 61-71.
APPENDIX
Table 1. Data validation of cattle population, resident and slaughtering at CSH Total resident
year A. Simulasi A. Aktual (As-Akt)/Akt (As-AKT/Akt 2)
2011 1,124,757 1,124,757 - 0.00000E+00
2012 1,130,831 1,129,050 0.001577432 2.48829E-06
2013 1,136,937 1,141,900 -0.00434626 1.889E-05
MSE -0.00276883 2.13783E-05
Total of slaughtering CSH
year A.Simulasi A.Aktual (As-Akt)/Akt (As-Akt)/Akt2
2011 19,845 19,845 - -
2012 21,432 21,418 0.001 0.0000
2013 23,147 22,575 0.025 0.0006
MSE 0.0260 0.0006
Cow population
year A.Simulasi A.Aktual (As-Akt)/Akt (As-Akt)/Akt2
2011 312,011.0 312,012.0 -3.205E-06 1.02721E-11
2012 315,130.0 314,810.0 0.001016486 1.03324E-06
2013 321,381.0 311,359.0 0.032187925 0.001036062