Effects of soil freezing disturbance on soil solution
nitrogen, phosphorus, and carbon chemistry in a
northern hardwood ecosystem
ROSS D. FITZHUGH1∗, CHARLES T. DRISCOLL1, PETER M. GROFFMAN2, GERALDINE L. TIERNEY3, TIMOTHY J. FAHEY3& JANET P. HARDY4
1Syracuse University, Department of Civil and Environmental Engineering, 220 Hinds Hall,
Syracuse, New York, 13244 U.S.A.;2Institute of Ecosystem Studies, Box AB, Millbrook, New York, 12545 U.S.A.;3Cornell University, Department of Natural Resources, Ithaca, New York, 14853 U.S.A.;4U.S. Army, Cold Regions Research and Engineering Laboratory, Hanover, NH 03755 U.S.A. (∗Current Address: Institute of Ecosystem Studies, Box AB, Millbrook, New York, 12545 U.S.A.; e-mail: [email protected])
Key word: carbon, climate change, Hubbard Brook Experimental Forest, nitrogen, phos-phorus, plant-soil-microbe interactions
Introduction
Traditionally, there have been few investigations of overwinter biogeochem-ical processes relative to studies during the growing season in temperate northern ecosystems because biological processes were largely thought to be insignificant under cold conditions. More recent studies, however, have shown that root and microbial processes are surprisingly active in cold (0 to 5◦
C) and even frozen soils (e.g. Clein & Schimel 1995). Furthermore, a significant portion of ecosystem nutrient cycling and loss may occur during the overwinter period (Melloh & Crill 1995; Hobbie & Chapin 1996; Brooks et al. 1996, 1997; Saarnio et al. 1999). For example, ∼69% of annual stream nitrate (NO−
3) export occurs during snowmelt between the months of March and May at the biogeochemical reference watershed (W6) of the Hubbard Brook Experimental Forest (HBEF) in the White Mountains of New Hampshire (Likens & Bormann 1995). The controls on these overwinter biogeochemical processes, as well as their relationship to growing season processes, are not fully understood.
Climate change may significantly disturb biogeochemical processes by altering the overwinter snow cover and soil temperature regimes (Brooks et al. 1998; Brooks & Williams 1999). We hypothesize that reductions in the depth and annual duration of snow cover may be a regional scale effect of climate warming in northern hardwood forests of eastern North America. While there are no detailed predictions of snow depth changes with global warming, both field and modeling experiments suggest that snowpack dynamics are highly responsive to climate change (Cooley 1990; van Katwijk et al. 1993; Giorgi et al. 1994; Williams et al. 1996; Moore & McKendry 1996; Baron et al. 2000). In northern latitudes, the development of the seasonal snowpack may insulate the soil from freezing air temperatures. As the depth of soil freezing typically exhibits an inverse relationship with snow depth, a lack of snow, or a late accumulating snow pack, results in soil freezing that is deeper and of longer duration than when the snowpack is established in early winter (Stadler et al. 1996; Shanley & Chalmers 1999). Reduced snow cover under a warmer climate may therefore lead to increases in the frequency, severity, and spatial extent of soil freezing events.
of soil aggregates (Soulides & Allison 1961; Hinman & Frederick 1968; Bullock et al. 1988), and (iii) fragmentation of fresh litter. The formation and subsequent growth of ice lenses could shear roots and change the soil struc-ture at the root-soil interface, potentially resulting in impaired root uptake. Soil freezing can therefore result in increased nitrogen (N), phosphorus (P), and carbon (C) concentrations in soil solutions, potentially resulting in enhanced nutrient loss, soil solution acidification, and base cation depletion from soils (e.g. Mitchell et al. 1996).
Boutin and Robitaille (1995) manipulated snow cover in Canadian sugar maple stands which induced soil freezing and resulted in significantly elev-ated soil solution concentrations of NO−3 and ammonium (NH+4), with peaks in NO−
3 occurring from July through September. Pronounced increases in stream NO−
3 concentrations during 1970 and 1974 at the HBEF have been related to soil freezing events (Likens & Bormann 1995). Mitchell et al. (1996) suggested that a synchronous pulse of stream NO−
3 concentrations in four watersheds spanning the northeastern U.S. during the snowmelt of 1990 was related to a regional scale soil freezing event in December 1989. These studies indicated that soil freezing may significantly influence soil solution chemistry and N loss in northern hardwood forests.
In this paper, data are presented from a snow manipulation study at the HBEF. The overwinter snow cover and soil temperature regimes were manip-ulated during two consecutive winters at four experimental stands (two sugar maple and two yellow birch). Snow cover was removed from the first snowfall through early February to depict the effects of a late accumulating snow cover on the overwinter soil temperature regime and on biogeochemical processes. Our objectives were: (i) to elucidate the effects of soil freezing on soil solution N, P, and C chemistry and (ii) to evaluate the responses of soil solution chem-istry relative to measurements of soil freezing effects on fine root dynamics and soil N cycling reported in other articles in this series (Tierney et al. this issue; Groffman et al. this issue).
Methods
Study site
The HBEF is located in the White Mountains of New Hampshire, U.S.A. (43◦
56′ N, 71◦
45′
air temperatures range from –10◦C in January to 17◦C in July. A continuous snowpack typically begins to develop in late autumn and soils usually do not freeze during the overwinter period because the snow insulates the soil from freezing air temperatures (Likens & Bormann 1995). Canopy veget-ation is dominantly mixed northern hardwoods and conifers. Sugar maple (Acer saccharum) and yellow birch (Betula alleghaniensis) comprise ∼36 and 28%, respectively, of the basal area of trees between 21 and 70 cm dbh at the biogeochemical reference catchment at the HBEF, watershed 6 (Bormann et al. 1970). Soils are predominantly well-drained, coarse-loamy, mixed frigid acidic Typic Haplorthods (pH∼3.9) developed in shallow glacial till (mean thickness = 2 m) overlying metamorphosed sedimentary and igneous rocks (Dahlgren & Driscoll 1994).
Experimental stands
Four experimental stands were established at the HBEF (Hardy et al. this issue), two in sugar maple (∼80% dominance) stands and two in yellow
birch (∼80% dominance) stands. These species were chosen because the elevation range of yellow birch (YB) typically exceeds sugar maple (SM), and thus YB would be expected to be more frost-hardy. Two 10 m by 10 m plots (one reference, one treatment) were located in each experimental stand (Hardy et al. this issue). In the fall and winter of 1996, minor amounts of understory vegetation were cleared from both treatment and reference plots for plot installations and to facilitate shoveling. Snow was removed by shov-eling through early February at the treatment plots to induce soil freezing and to simulate the biogeochemical effects of a late accumulating snowpack as may be expected under a warmer climate. Snow removal occurred during two consecutive winters (1997–1998 and 1998–1999). The treatment was initiated in November 1997. Between 5 to 10 cm of snow from early-winter storms was manually compacted at the treatment plots to protect plot installations and the forest floor from shovel damage and to increase the albedo of the forest floor, promoting soil freezing. The smooth backside of the shovels was used to carefully compact the snow and protect the soil from disruption prior to its freezing. This compacted snow layer was maintained throughout the entire treatment period and observations each spring confirmed that the protective compact layer of snow was effective in minimizing compaction of the forest floor. The reference plots accumulated snow at natural rates all winter, while the treatment plots accumulated snow at natural rates after snow removal ceased in early February.
lysimeters per plot (Hardy et al. this issue). Lysimeters below the Oa horizon were installed between 3 and 8 cm below the surface of the forest floor, while lysimeters in the Bs horizon were installed between 10 and 22 cm below the forest floor surface. After installation, lysimeters were sampled at approxi-mately monthly intervals until initiation of the snow cover manipulation. An additional set of lysimeters was installed at a YB treatment plot during the summer of 1998. Gravity lysimeters are believed to mostly sample macro-pore flow during hydrological events and while the soil is draining to field capacity (Litaor 1988) and thus provide a sample of water exported from the ecosystem. Soil solutions were collected on 37 dates at weekly to monthly intervals from December 1997 through November 1999 and shipped on ice to Syracuse University for chemical analyses.
Laboratory methods
Soil solutions were stored at ∼4◦C in a constant temperature room until
analysis. Samples were analyzed for the following solutes (typically in the order listed): dissolved inorganic carbon (DIC), dissolved organic carbon (DOC), ammonium (NH+
4), nitrate (NO −
3), soluble reactive phosphorus (SRP), and total nitrogen (TN). As concentrations of DIC, DOC, NH+
4, NO − 3, and SRP may change during storage, these analyses were completed as soon as possible (typically within 2 weeks of sample collection). For soil solu-tion samples with a collecsolu-tion volume less than 100 ml, DIC and SRP were not measured due to relatively large sample volume requirements for these analyses. Analyses of SRP were initiated in February 1998, while analyses of the other solutes were completed on all samples, sample volume permitting.
Analysis of DIC was via phosphoric acid addition to convert DIC to CO2, followed by infrared detection (Dohrmann 1984). Analysis of DOC occurred after filtration by persulfate and ultraviolet enhanced oxidation, followed by infrared detection of CO2 (McDowell et al. 1987). Ammonium was analyzed with an autoanalyzer via phenate colorimetry (APHA 1981). Nitrate was analyzed by ion chromatography (Tabatabai & Dick 1983). Soluble reactive phosphorus was measured through the formation of a blue antimony-phospho-molybdate complex and measurement on a UV-VIS spec-trophotometer at 880 nm. This technique was believed to primarily measure ortho-phosphate but due to hydrolysis, some polyphosphate, organic phos-phate, and metal phosphates may have been detected. Inorganic P (Pi) was assumed to equal SRP. Total nitrogen (TN) was analyzed by persulfate oxida-tion and analysis of NO−
3 on an autoanalyzer via hydrazine reduction (Ameel et al. 1993). Dissolved organic N (DON) was calculated as the difference between TN and inorganic N (NH+
Computation of water and solute fluxes
The water fluxes through the Oa and Bs soil horizons were calculated using a simple mass balance model. Assuming that the vertical distribution of evapo-transpiration (ET) within a soil profile corresponded with the distribution of fine roots, then 44% of ET occurred from the Oa horizon and above (forest floor horizons) (Fahey & Hughes 1994). From June through November when ET was significant, the daily water flux through the Oa horizon was calculated based on this vertical distribution of ET and measured values of precipita-tion and stream flow at the biogeochemical reference watershed (W6) at the HBEF. From December through May when ET was less significant, the daily water flux through the Oa horizon was assumed to equal daily stream flow at W6. The daily water flux through the Bs horizon was assumed to equal daily stream flow throughout the year. Water fluxes through the Oa and Bs horizons were assumed to be zero when stream flow was zero. Water fluxes were assumed to be equal among stands. Measurements of soil hydrological variables (e.g. soil water tension, soil hydraulic conductivity) were beyond the scope of this project and therefore water fluxes could not be calculated separately for each stand.
fluxes were equal between treatment and reference plots. The potential effects of soil freezing on water fluxes are addressed below in the discussion.
Average solute concentrations for each pair of lysimeters on every sampling date were calculated using the volume of soil solution collected as a weighting variable. These volume-weighted average solute concentrations were multiplied by the daily water flux to calculate the solute fluxes through the Oa and Bs soil horizons for each experimental plot (n= 8).
Statistical analyses
All statistical analyses were performed using SAS software at theα = 0.05 level of significance (SAS 1989). Monthly solute concentrations were calcu-lated by dividing the monthly soil solution solute fluxes by the monthly water fluxes. One-way analysis of variance (ANOVA) was performed separately for each month to test for soil freezing treatment effects on soil solution NO−
Results
Effects of snow cover manipulation on the overwinter soil temperature regime
The removal of snow cover through early February resulted in substantial changes in overwinter soil temperatures. Freezing temperatures (<0◦
C) were observed at 10 cm or deeper in the soil profile at all treatment plots while soils remained thawed at 10 cm depth and deeper at all reference plots during the winters of 1997–1998 and 1998–1999 (Hardy et al. this issue). Soils at the treatment plots typically began to freeze in late December and remained frozen through early April (Hardy et al. this issue). Soil freezing was more severe during the winter of 1998–1999 than 1997–1998, likely as the result of colder winter air temperatures.
Soil solution nitrogen
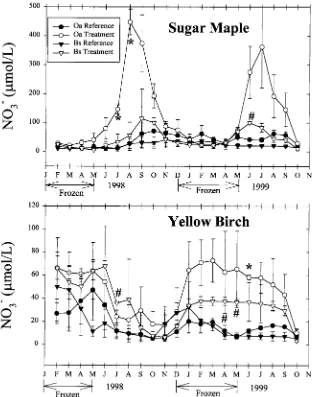
Responses of soil solution NO−
3 concentrations to the soil freezing disturb-ance were evident to varying degrees for each tree species in both soil horizons (Figure 1). In the Oa horizon of SM stands, soil solution NO− 3 concentrations were initially similar between reference and treatment plots until early in the growing season of 1998 (May). Treatment concentrations then increased sharply relative to reference levels and remained elevated until late in the growing season of 1998 (October), after which treatment concen-trations returned to reference levels. This seasonal pattern was repeated during the second year of the experiment (1999). The mean monthly soil solu-tion NO−
3 concentration was significantly greater in treatment than reference plots during July and August of 1998 for soil water draining the forest floor of SM stands (Figure 1). The overall mean monthly soil solution NO−3 concen-tration was significantly greater at the treatment than the reference plots for the Oa horizon leachate of SM stands (Table 1). A response was also evident in the Bs horizon solution during the growing season of both years, with the mean monthly treatment NO−
3 concentration being significantly greater than the reference level during June of 1999 (Figure 1).
Unlike the SM stands, a seasonal pattern of NO−
3 response was not detected at the YB stands (Figure 1). Mean monthly treatment NO−3 concen-trations were significantly greater than reference values during June of 1999 for solutions draining the forest floor of YB stands and during July 1998 as well as April and May of 1999 for Bs horizon leachates (Figure 1). Although the overall mean monthly NO−
3 concentrations were not significantly different between treatment and reference plots of YB stands (Table 2), NO−
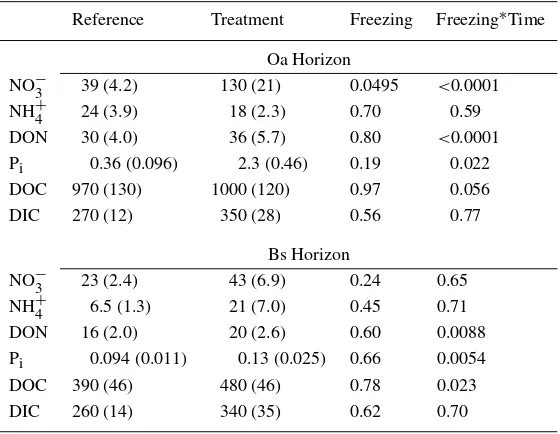
Table 1. Comparison of overall mean concentrations between reference and treatment plots for soil solutions draining the Oa and Bs horizons of sugar maple stands. Standard errors are in parentheses. Thep-values of repeated measures ANOVA testing the effects of the soil freezing treatment and treat-ment-time interactions are indicated in the ‘Freezing’ and ‘Freezing∗Time’ columns, respectively. All mean values are inµmol L−1
Reference Treatment Freezing Freezing∗Time Oa Horizon
NO−3 39 (4.2) 130 (21) 0.0495 <0.0001
NH+4 24 (3.9) 18 (2.3) 0.70 0.59
DON 30 (4.0) 36 (5.7) 0.80 <0.0001
Pi 0.36 (0.096) 2.3 (0.46) 0.19 0.022
DOC 970 (130) 1000 (120) 0.97 0.056
DIC 270 (12) 350 (28) 0.56 0.77
Bs Horizon
NO−3 23 (2.4) 43 (6.9) 0.24 0.65
NH+4 6.5 (1.3) 21 (7.0) 0.45 0.71
DON 16 (2.0) 20 (2.6) 0.60 0.0088
Pi 0.094 (0.011) 0.13 (0.025) 0.66 0.0054
DOC 390 (46) 480 (46) 0.78 0.023
DIC 260 (14) 340 (35) 0.62 0.70
than the reference plots during the entire experiment, most notably during the second year (1999).
The soil freezing disturbance accelerated NO−
3 fluxes from each horizon of both species (Table 3). Treatment NO−3 fluxes were 290 and 150% of reference fluxes from the Oa and Bs horizons, respectively, of SM stands, while treatment fluxes were 250 and 200% of reference fluxes from the Oa and Bs horizons, respectively, of YB stands. The proportion of annual soil solution NO−
3 flux during the summer and fall (June through November) was much higher in the treatment than the reference plots in the SM stands.
Soil freezing resulted in significantly elevated concentrations of NH+ 4 in the Oa horizon solutions of YB stands (Table 2), with the treatment NH+4 flux being 470% of the reference flux from the Oa horizons of YB stands (Table 3).
Table 2. Comparison of overall mean concentrations between reference and treatment plots for soil solutions draining the Oa and Bs horizons of yellow birch stands. Standard errors are in parentheses. Thep-values of repeated measures ANOVA testing the effects of the soil freezing treat-ment and treattreat-ment-time interactions are indicated in the ‘Freezing’ and ‘Freezing∗Time’ columns, respectively. All mean values are inµmol L−1 Reference Treatment Freezing Freezing∗Time
Oa Horizon
NO−3 18 (2.3) 48 (4.1) 0.10 0.51
NH+4 23 (1.7) 100 (13) 0.034 0.95
DON 49 (2.4) 130 (45) 0.29 0.56
Pi 1.2 (0.12) 1.8 (0.29) 0.29 0.66
DOC 2100 (87) 3700 (950) 0.31 0.47
DIC 190 (10) 420 (29) 0.042 <0.0001 Bs Horizon
NO−3 17 (3.0) 36 (3.7) 0.20 0.66
NH+4 69 (20) 25 (4.1) 0.15 <0.0001
DON 45 (4.5) 35 (4.2) 0.69 0.57
Pi 2.4 (0.69) 0.52 (0.12) 0.46 0.33
DOC 1500 (110) 1100 (140) 0.76 0.48
DIC 280 (23) 300 (16) 0.80 0.066
of YB stands (Table 2). The treatment DON flux was 300% of the reference flux from the Oa horizon of YB stands (Table 3).
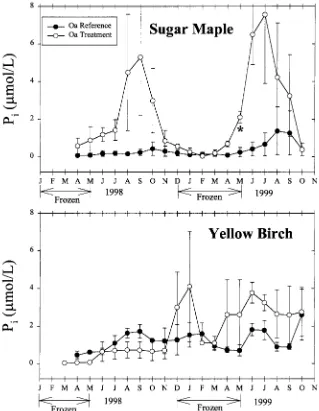
Soil solution inorganic phosphorus
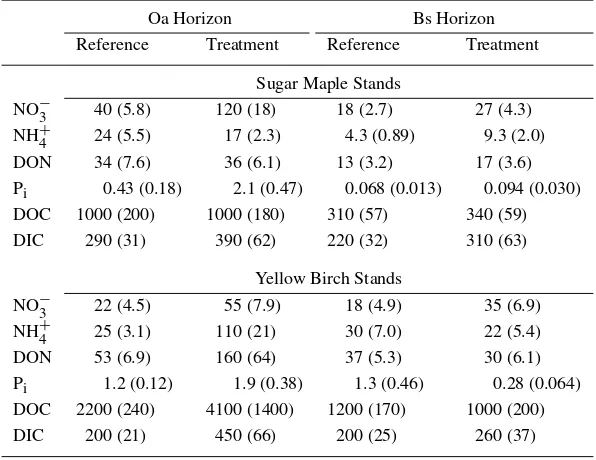
Table 3. Comparison of mean monthly soil solution solute fluxes between refer-ence and treatment plots for the Oa and Bs soil horizons of sugar maple and yellow birch stands. Standard errors are in parentheses. All units are in mol ha−1month−1
Oa Horizon Bs Horizon
Reference Treatment Reference Treatment Sugar Maple Stands
NO−3 40 (5.8) 120 (18) 18 (2.7) 27 (4.3)
NH+4 24 (5.5) 17 (2.3) 4.3 (0.89) 9.3 (2.0)
DON 34 (7.6) 36 (6.1) 13 (3.2) 17 (3.6)
Pi 0.43 (0.18) 2.1 (0.47) 0.068 (0.013) 0.094 (0.030) DOC 1000 (200) 1000 (180) 310 (57) 340 (59)
DIC 290 (31) 390 (62) 220 (32) 310 (63)
Yellow Birch Stands
NO−3 22 (4.5) 55 (7.9) 18 (4.9) 35 (6.9)
NH+4 25 (3.1) 110 (21) 30 (7.0) 22 (5.4)
DON 53 (6.9) 160 (64) 37 (5.3) 30 (6.1)
Pi 1.2 (0.12) 1.9 (0.38) 1.3 (0.46) 0.28 (0.064) DOC 2200 (240) 4100 (1400) 1200 (170) 1000 (200)
DIC 200 (21) 450 (66) 200 (25) 260 (37)
August of 1999. Treatment Pi fluxes were 480 and 160% of reference fluxes in the Oa horizon leachates of SM and YB stands, respectively (Table 3).
Soil solution carbon
The overall mean monthly soil solution DIC concentration was significantly greater in the treatment than the reference plots of Oa horizon leachate for YB stands (Table 2). The treatment DIC flux was 200% of the reference flux from the Oa horizon of YB stands (Table 3).
A response of DOC concentrations to the soil freezing disturbance was not apparent at either the SM or YB stands (Tables 1 and 2).
Comparison of soil solution responses between sugar maple and yellow birch stands
The responses of soil solution NO−
3 and NH +
4 concentrations to the soil freezing disturbance tended to differ between SM and YB stands, with NO−
3 and NH +
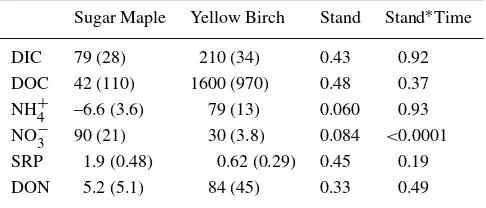
Table 4. Comparison of the mean values of the response variable in Oa horizon solutions between sugar maple and yellow birch stands. The response variable (µmol L−1) is the monthly treat-ment minus reference concentration. Standard errors are indicated in parentheses. Thep-values of repeated measures ANOVA testing the effects of stand and stand-time interactions are indicated
Sugar Maple Yellow Birch Stand Stand∗Time
DIC 79 (28) 210 (34) 0.43 0.92
DOC 42 (110) 1600 (970) 0.48 0.37
NH+4 –6.6 (3.6) 79 (13) 0.060 0.93 NO−3 90 (21) 30 (3.8) 0.084 <0.0001 SRP 1.9 (0.48) 0.62 (0.29) 0.45 0.19
DON 5.2 (5.1) 84 (45) 0.33 0.49
effects were relatively low for the mean NO−
3 (p= 0.084) and NH +
4 response (p= 0.060; Table 4). Additionally, the stand-time interaction was statistically significant for NO−
3 (Table 4).
Correlations between soil solution solutes
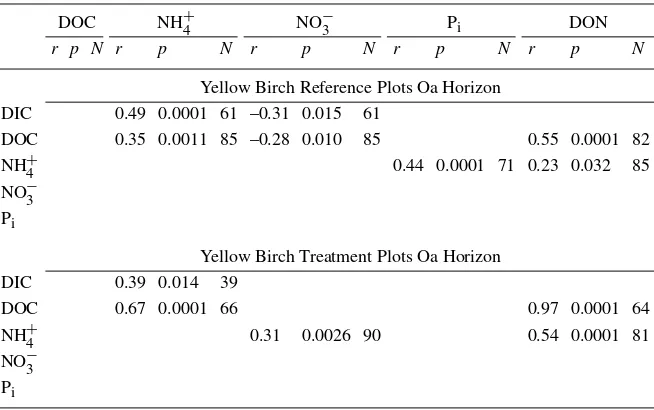
Patterns of correlations between solutes exhibited differences between refer-ence and treatment plots within single species. Both NO−
3 and Piresponded strongly to the soil freezing disturbance in the Oa horizon of SM stands. These solutes exhibited stronger correlations at treatment plots (r= 0.85) than at reference plots (r= 0.24) in the Oa horizon waters of SM stands (Table 5). Concentrations of DIC, NO−3, NH+4, and DON exhibited treatment responses in the Oa horizon solution of YB stands. Treatment NO−
3 concentrations were significantly correlated with NH+4 but this relationship was not evident in Oa horizon solutions draining reference plots of YB stands (Table 6). Correla-tions between DOC and NH+
4, between DOC and DON, and between NH + 4 and DON were stronger at treatment than reference plots in the Oa horizon solution of YB stands.
Discussion
Soil freezing accelerates nitrogen leaching
Soil freezing disturbance appears to have accelerated the leaching of total nitrogen (TN = NO−
3 + NH +
229 0.05) correlations are shown
DOC NH+4 NO−3 Pi DON
r p N r p N r p N r p N r p N
Sugar Maple Reference Plots Oa Horizon
DIC 0.51 0.0001 91 0.39 0.0001 91 0.28 0.011 81 0.34 0.0009 91
DOC 0.71 0.0001 105 0.58 0.0001 86 0.74 0.0001 105
NH+4 0.25 0.0092 110 0.29 0.0077 86 0.68 0.0001 108
NO−3 0.24 0.029 86
Pi 0.48 0.0001 86
Sugar Maple Treatment Plots Oa Horizon DIC
DOC 0.61 0.0001 102 0.67 0.0001 102 0.51 0.0001 88 0.44 0.0001 101
NH+4 0.53 0.0001 107 0.49 0.0001 89 0.53 0.0001 106
NO−3 0.85 0.0001 89 0.62 0.0001 106
Table 6. Pearson correlation coefficients (r), significance levels (p), and number of observa-tions (N) for concentrations of selected soil solution solutes at reference and treatment plots collected from the Oa horizon of yellow birch stands. Only significant (p<0.05) correlations are shown
DOC NH+4 NO−3 Pi DON
r p N r p N r p N r p N r p N
Yellow Birch Reference Plots Oa Horizon DIC 0.49 0.0001 61 –0.31 0.015 61
DOC 0.35 0.0011 85 –0.28 0.010 85 0.55 0.0001 82
NH+4 0.44 0.0001 71 0.23 0.032 85
NO−3 Pi
Yellow Birch Treatment Plots Oa Horizon
DIC 0.39 0.014 39
DOC 0.67 0.0001 66 0.97 0.0001 64
NH+4 0.31 0.0026 90 0.54 0.0001 81
NO−3 Pi
stands. Soil solution losses of N could be increased via enhanced supply and/or decreased biotic assimilation. The supply of N could increase after soil freezing via: (i) fine root mortality, (ii) physical disruption of soil aggregates, (iii) microbial death, and (iv) fragmentation of fresh litter. Biotic assimila-tion of N could decrease after soil freezing due to reduced fine root uptake. The absence of treatment responses for net N mineralization and microbial biomass suggests that neither of these mechanisms contributed to acceler-ated N losses from the forest floor subsequent to soil freezing disturbance (Groffman et al. this issue). The lack of a treatment response for N miner-alization, coupled with the relatively mild soil freezing events induced by our snow manipulation (soil temperatures never decreased below –5◦C at the treatment plots), were consistent with the results of Nielsen et al. (submitted) who found that N mineralization only increased when soils from our experi-mental plots were subjected to severe soil freezing in the laboratory (–13◦C). Similarly, previous studies have suggested that soil temperatures may need to decrease below –5◦C for significant mortality of microbes (e.g. Edwards & Cresser 1992). The accelerated leaching of NO−
3 observed at all treatment plots was consistent with the significant increases in extractable soil NO−
Fluxes of dissolved inorganic N (DIN = NO− 3 + NH
+
4) from the forest floor of treated plots (range: 1400 mol ha−1 yr−1 to 2400 mol ha−1 yr−1) were substantially greater than throughfall DIN fluxes entering the forest floor at W6 of the HBEF between 1989 and 1992 (range: 420 to 630 mol ha−1yr−1; Lovett et al. 1996). This comparison of fluxes entering and leaving the forest floor indicates that most of the increase in DIN subsequent to soil freezing was derived from sources internal to the forest floor, rather than reduced plant uptake of throughfall N.
Hardy et al. (this issue) found that the reduction in soil infiltration caused by the soil freezing treatment was proportional to the decrease in snow water equivalence, approximately a 13 to 16% reduction in the annual water flux. As treatment soil solution solute fluxes from the Oa horizon were greater than 200% of reference fluxes for NO−
3 in SM stands and for NO − 3, NH
+ 4, and DON in YB stands (Table 3), a 16% reduction in solute flux at the treatment plots caused by the decrease in infiltration still resulted in treatment solute fluxes substantially greater than reference fluxes.
Decomposition, mineralization, and nitrification of fine roots killed during the overwinter period likely contributed significantly to accelerated N leaching from the treatment plots. Tierney et al. (this issue) estimated that elevated fine root necromass could have potentially contributed an excess flux (treatment minus reference flux) of about 360 mol N ha−1yr−1, approxi-mately 20% of the average excess soil solution N flux from the Oa horizon (1800 mol ha−1 yr−1). Greater soil solution N fluxes than the N potentially derived from fine root mortality and decomposition suggest that N source(s) in addition to fine root mortality must have contributed to the excess N leaching from the forest floor. In addition to fine root mortality, hydrological N losses after soil freezing may have increased due to an enhanced supply of N via physical disruption of soil aggregates and fragmentation of fresh litter, as well as decreased plant uptake of N generated within the forest floor.
Soil solution NH+4 did not respond to soil freezing at the SM stands; the pronounced response of soil solution NO−
3, therefore, suggests that decreased competition for available NH+
4 between nitrifiers and heterotrophs and/or between nitrifiers and root-mycorrhizal complexes stimulated nitrification and enhanced NO−
3 losses from SM stands. Our results indicate that the reduction in root N uptake may have been important as a regulator of hydro-logical N loss. Physical disturbance of root-soil-microbial interactions by soil freezing may have affected hydrological N losses by reducing the synchrony between mineralization and uptake processes.
(Tierney et al. this issue). The greater soil solution NO−
3 response in SM than YB stands was consistent with the higher extractable soil NO−3 concentrations and greater potential net nitrification rates in SM than YB stands (Groffman et al. this issue). Nielsen et al. (submitted) also observed that nitrification was greater in SM than YB in response to laboratory soil freezing for soils from our experimental stands. The greater soil solution NH+
4 response for YB than SM stands was consistent with the results of Nielsen et al. (submitted) who observed greater extractable soil NH+
4 concentrations and greater N mineralization rates in YB than SM for soils subjected to laboratory soil freezing from our experimental stands. An additional factor that may have contributed to the differing soil solution N responses between stands was the difference in mycorrhizal associations, as SM has endomycorrhizal while YB has ectomycorrhizal associations. Ectomycorrhizal hyphae may extend into the soil for much greater distances than endomycorrhizal hyphae (Marschner & Dell 1994); physical disruption of the soil aggregates may therefore have disturbed the root-mycorrhizal complex of YB more than SM, resulting in more impaired uptake of NH+
4 by YB than SM. Endomycorrhizal fungi are believed to increase P uptake more than ectomycorrhizal fungi (Aber & Melillo 1991). Although not statistically significant, the greater Pi response in SM than YB stands in the Oa horizon (Table 4), is consistent with the hypothesis that soil freezing disturbed the root-mycorrhizal complex differ-ently between stands. We emphasize that these explanations of the differing soil solution N response between tree stands are not conclusive and that more mechanistic comparisons are needed. Similarly, it was unknown why soil solution responses were most pronounced at SM stands during the summer and autumn, whereas no clear seasonal response occurred at YB stands.
The responses of soil solution N were greater in the forest floor than in the Bs soil horizon, with the ratio of TN fluxes in the Bs to the Oa aver-aging 0.29. Root uptake, microbial immobilization, NH+
4 adsorption onto cation exchange sites, as well as the sorption of DON to mineral soil were potential mechanisms immobilizing N from the soil solution during percol-ation from the Oa towards the Bs soil horizon. Lateral flow of soil solutions leaching below the forest floor could also have contributed to the differences in N fluxes observed between the soil horizons. Root uptake of DIN was considered to be an unlikely retention mechanism because most roots occur in the forest floor (Fahey & Hughes 1994) and root mortality was not different between depths (T.J. Fahey, unpublished data).
1996) as well as rates of stream N export at W6 of the HBEF in 1997 (25 mol ha−1yr−1; G. Likens, personal communication).
Our results were consistent with previous studies showing responses of DIN to soil freezing. Soil freezing induced by season-long removal of snow cover in Canadian SM stands resulted in pronounced increases in soil solution NH+
4 and NO −
3 concentrations (Boutin & Robitaille 1995). Minimum soil temperatures (–4 to –6◦
C) induced by the snow cover manipulation by Boutin and Robitaille (1995) tended to be lower than the minimum soil temperatures observed during the current study. Nitrate loss during snowmelt was signifi-cantly greater at plots with inconsistent snow cover that experienced more severe soil freezing relative to plots with a deep and continuous snow cover at Niwot Ridge, Colorado; this pattern was attributed to a greater capacity of microorganisms to immobilize N at consistent snow cover plots (Brooks et al. 1998). Brooks et al. (1999) observed that N retention in the catchments of the Colorado Front Range was strongly and positively related to winter snow cover, consistent with subnivean controls on N cycling observed at the plot scale. During years with low snow cover and likely soil freezing at a high elevation catchment in Colorado, stream NO−
3 fluxes were signifi-cantly greater than years with normal snowpack accumulation (Lewis & Grant 1980). Brooks et al. (1998) hypothesized that observations of Lewis and Grant (1980) were due to a greater capacity of microorganisms to immo-bilize N in years with normal snow cover, rather than an increase in soil N pools during low snow years. Studies have linked marked increases in stream NO−
3 concentrations in the northeastern U.S. with natural soil freezing events (Likens & Bormann 1995; Mitchell et al. 1996).
Enhanced loss of DIN subsequent to soil freezing could have a variety of consequences for receiving waters, including eutrophication and acidification (Vitousek et al. 1997). Additionally, enhanced loss of N over the long-term (i.e. decades) could reduce the pool of N available for plant uptake. As N is generally believed to be the nutrient most limiting for plant growth in northern hardwood ecosystems (Aber et al. 1998), reductions in available N could reduce forest productivity as well as alter competitive relationships among tree species.
Effects of soil freezing on soil solution inorganic phosphorus
net P mineralization in the forest floor (180 mol ha−1 year−1) estimated for the HBEF by Yanai (1992).
Overwinter fine root mortality was likely an important mechanism contrib-uting to accelerated soil solution Pi mobilization from the forest floor. Multiplying the potential excess N flux from fine root mortality (Tierney et al. this issue) by the P:N ratio in fine root biomass and by the ratio of P:N released during the first year of incubation in mesh bags (Fahey et al. 1988), the potential excess P flux derived from fine root mortality was 6.1 mol ha−1 yr−1 which was about 31% of the average excess soil solution Pi flux from the forest floor of SM stands. Thus, at SM stands, mechanisms in addition to fine root mortality likely contributed to Pi mobilization (i.e. decreased plant P uptake and/or increased mineralization of organic P).
One previous study has demonstrated that release of P may be enhanced following soil freezing disturbance (Lewis & Grant 1980). They found that stream fluxes of orthophosphate were significantly greater during years with low snow cover and likely soil freezing relative to years with normal snow cover at a Colorado watershed.
Effects of soil freezing on soil solution dissolved inorganic carbon
A response of DIC to soil freezing was evident in the Oa horizon solution of YB stands (Table 2). Enhanced soil solution DIC concentrations likely resulted from restriction of CO2 exchange between the soil and the atmo-sphere by ice lenses in the soil as well as compacted snow and ice at the soil surface. The absence of a soil CO2 evolution response (Tierney et al. this issue) suggests that enhanced microbial respiration was unlikely to be a mechanism contributing to elevated soil solution DIC concentrations.
Linkages among solutes responding to soil freezing disturbance
The synchronous responses to the soil freezing treatment and strong corre-lations observed between solutes, most notably draining the Oa horizons, suggests that the mechanisms contributing to their enhanced concentrations may be linked. Nitrate and Piresponded to the soil freezing disturbance in SM stands (Figures 1 and 2). Variations in soil solution NO−
3 and Piwere strongly related in the Oa horizons of the SM plots (Table 5); mineralization of soil organic matter and/or decreased tree uptake were the likely mechanisms linking mobilization of these solutes from the forest floor.
At YB stands in the Oa horizon, the significant correlation between DOC and DON suggests that the responses of these solutes were linked by enhanced mobilization of soil organic matter (Table 6). The correlations between NH+
4 and DOC, as well as between NH +
enhanced N mineralization and dissolution of soil organic matter may have been linked, although we were unable to reconcile these results with the lack of net N mineralization response observed by Groffman et al. (this issue). The relatively weak but significant correlation between NH+
4 and NO −
3 in the Oa horizon of YB plots suggests that losses of these solutes were linked by N mineralization and nitrification.
Conclusions
This study demonstrated that mild soil freezing events can significantly influ-ence soil solution chemistry and loss of N and P in a northern hardwood forest. However, critical gaps in our knowledge remain. While it was clear that fine root mortality was a potential mechanism contributing to enhanced nutrient loss, we were unable to quantify the contributions from physical disruption of soil aggregates, decreased root uptake, and fragmentation of fresh litter to enhanced soil solution fluxes. Future experiments utilizing stable isotopes may be valuable in quantifying these mechanisms. The differ-ences in soil solution N and P responses between SM and YB stands were intriguing and merit more mechanistic investigation. Our results suggest that if soil freezing events become more frequent under a warmer climate, the availability and loss of N and P may be significantly altered, with potential consequent effects on terrestrial and aquatic ecosystems.
Acknowledgements
The hard work of Jason Demers and Adam Welman in the field and labora-tory were critical to the success of this study. We thank Scott Nolan and Wayne Martin for help with site location and establishment. This research was supported by the National Science Foundation (DEB-9652678) and a Syracuse University Graduate Fellowship to RDF. This manuscript was considerably improved by the thoughtful comments of Kate Lajtha and two anonymous reviewers. This is a contribution of the Hubbard Brook Ecosystem Study. The Hubbard Brook Experimental Forest is administered by the USDA Forest Service.
References
Aber J, McDowell W, Nadelhoffer K, Magill A, Berntson G, Kamakea M, McNulty S, Currie W, Rustad L & Fernandez I (1998) Nitrogen saturation in temperate forest ecosystems: Hypotheses revisited. BioScience 48: 921–934
Ameel JJ, Axler RP & Owen CJ (1993) Persulfate digestion for determination of total nitrogen and phosphorus in low nutrient waters. Amer. Environ. Lab. 10: 1–11
APHA (1981) Standard Methods for the Examination of Water and Wastewater, 15th Ed. American Public Health Association, Washington, DC
Baron JS, Hartman MD, Band LE & Lammers RB (2000) Sensitivity of a high-elevation Rocky Mountain watershed to altered climate and CO2. Water Resour. Res. 36: 89–99 Biederbeck VO & Campbell CA (1971) Influence of simulated fall and spring conditions on
the soil system: I. Effect on soil microflora. Soil Sci. Soc. Amer. Proc. 35: 474–479 Bormann FH & Likens GE (1979) Pattern and Process in a Forested Ecosystem.
Springer-Verlag, New York
Bormann FH, Siccama TG, Likens GE & Whittaker RH (1970) The Hubbard Brook Ecosystem Study: Composition and dynamics of the tree stratum. Ecol. Monogr. 40: 373–388
Boutin RB & Robitaille G (1995) Increased soil nitrate losses under mature sugar maple trees affected by experimentally induced deep frost. Can. J. For. Res. 25: 588–602
Brooks PD & Williams MW (1999) Snowpack controls on nitrogen cycling and export in seasonally snow-covered catchments. Hydrol. Process. 13: 2177–2190
Brooks PD, Campbell DH, Tonnessen KA & Heuer K (1999) Natural variability in N export from headwater catchments: snow cover controls on ecosystem N retention. Hydrol. Process. 13: 2191–2201
Brooks PD, Schmidt SK & Williams MW (1997) Winter production of CO2and N2O from alpine tundra: Environmental controls and relationship to inter-system C and N fluxes. Oecologia 110: 403–413
Brooks PD, Williams MW & Schmidt SK (1996) Microbial activity under alpine snowpacks, Niwot Ridge, Colorado. Biogeochem. 32: 93–113
Brooks PD, Williams MW & Schmidt SK (1998) Inorganic nitrogen and microbial biomass dynamics before and during spring snowmelt. Biogeochem. 43: 1–15
Bullock MS, Kemper WD & Nelson SD (1988) Soil cohesion as affected by freezing, water content, time, and tillage. Soil. Sci. Soc. Amer. J. 52: 770–776
Clein JS & Schimel JP (1995) Microbial activity of tundra and taiga soils at sub-zero temperatures. Soil Biol. Biochem. 27: 1231–1234
Cooley KR (1990) Effects of CO2-induced climatic changes on snowpack and streamflow. Hydrol. Sci. 35: 511–522
Dahlgren RA & Driscoll CT (1994) The effects of whole-tree clear-cutting on soil processes at the Hubbard Brook Experimental Forest, New Hampshire, U.S.A. Plant Soil 158: 239–262 Dohrmann Corp. (1984) Total Organic Carbon Systems Manual. Dohrmann Corp., Santa
Clara, California
Driscoll CT, Fuller RD & Simone DM (1988) Longitudinal variations in trace metal concentrations in a northern forested ecosystem. J. Environ. Qual. 17: 101–107
Edwards AC & Cresser MS (1992) Freezing and its effect on chemical and biological properties of soil. Adv. Soil Sci. 18: 59–79
Fahey TJ & Hughes JW (1994) Fine root dynamics in a northern hardwood forest ecosystem, Hubbard Brook Experimental Forest, NH. J. Ecol. 82: 533–548
Federer CA (1995) BROOK90: a simulation model for evaporation, soil water, and streamflow, Version 3.24. Computer freeware and documentation. USDA Forest Service, PO Box 640, Durham NH, 03824
Federer CA, Flynn LD, Martin CW, Hornbeck JW & Pierce RS (1990) Thirty Years of Hydro-meterologic Data at the Hubbard Brook Experimental Forest, New Hampshire. General Technical Report NE-141. U.S.D.A. Forest Service, Northeastern Forest Experiment Station, Radnor, Pennsylvania
Giorgi F, Brodeur CS & Bates GT (1994) Regional climate change scenarios over the United States produced with a nested regional climate model. J. Climate 7: 375–399
Groffman PM, Driscoll CT, Fahey TJ, Hardy JP, Fitzhugh RD & Tierney GL (this issue) Effects of mild winter freezing on soil nitrogen and carbon dynamics in a northern hardwood forest. Biogeochem. 56: 191–213
Hardy JP, Groffman PM, Fitzhugh RD, Henry KS, Welman TA, Demers JD, Fahey TJ, Driscoll CT, Tierney GL & Nolan S (this issue) Snow depth, soil frost and water dynamics in a northern hardwood forest. Biogeochem. 56: 151–174
Hinman WC & Frederick B (1968) Alterations of soil structure upon freezing and thawing and subsequent drying. Can. J. Soil Sci. 50: 179–182
Hobbie SE & Chapin FS (1996) Winter regulation of tundra litter carbon and nitrogen dynamics. Biogeochem. 35: 327–338
Lewis WM & Grant MC (1980) Relationships between snow cover and winter losses of dissolved substances from a mountain watershed. Arctic and Alpine Res. 12: 11–17 Likens GE & Bormann FH (1995) Biogeochemistry of a Forested Ecosystem, 2nd Ed.
Springer-Verlag, New York
Litaor MI (1988) Review of soil solution samplers. Water Resour. Res. 24: 727–733
Lovett GM, Nolan SS, Driscoll CT & Fahey TJ (1996) Factors regulating throughfall flux in a New Hampshire forested landscape. Can. J. For. Res. 26: 2134–2144
Marschner H & Dell B (1994) Nutrient uptake in mycorrhizal symbiosis. Plant Soil 159: 89– 102
McDowell WH, Cole JJ & Driscoll CT (1987) Simplified version of the ampoule-persulfate method for determination of dissolved organic carbon. Can. J. Fish. Aquat. Sci. 44: 214– 218
Melloh RA & Crill PM (1995) Winter methane dynamics beneath ice and in snow in a temperate poor fen. Hydrol. Process. 9: 947–956
Meyer ED, Sinclair NA & Nagy B (1975) Comparison of the survival and metabolic activity of psychrophilic and mesophilic yeasts subjected to freeze-thaw stress. Appl. Microbio. 29: 739–744
Mitchell MJ, Driscoll CT, Kahl JS, Likens GE, Murdoch PS & Pardo LH (1996) Climatic control of nitrate loss from forested watersheds in the Northeast United States. Environ. Sci. Tech. 30: 2609–2612
Moore RD & McKendry IG (1996) Spring snowpack anomaly patterns and winter climatic variability, British Columbia, Canada. Water Resour. Res. 32: 623–632
Morley CR, Trofymov JA, Coleman DC & Cambardella C (1983) Effects of freeze-thaw stress on bacterial populations in soil microcosms. Microb. Ecol. 9: 329–340
Nielsen CB, Groffman PM, Hamburg SP, Fahey TJ, Driscoll CT & Hardy JP. Freezing effects on carbon and nitrogen cycling in soils from a northern hardwood forest. Submitted to Soil Sci. Soc. Amer. J. xx: xx–xx
Sakai A & Larcher W (1987) Frost Survival of Plants: Responses and Adaptation to Freezing Stress. Springer-Verlag, New York
SAS (1989) SAS/STAT User’s Guide. SAS Institute, Cary, North Carolina
Shanley JB & Chalmers A (1999) The effect of frozen soil on snowmelt runoff at Sleepers River, Vermont. Hydrol. Process. 13: 1843–1858
Skogland T, Lomeland S & Goksøyr J (1988) Respiratory burst after freezing and thawing of soil: Experiments with soil bacteria. Soil Biol. Biochem. 20: 851–856
Soulides DA & Allison FE (1961) Effect of drying and freezing soils on carbon dioxide production, available mineral nutrients, aggregation, and bacterial population. Soil Sci. 91: 291–298
Stadler D, Wunderli H, Auckenthaler A & Fluhler H (1996) Measurement of frost-induced snowmelt runoff in a forest soil. Hydrol. Process. 10: 1293–1304
Tabatabai MA & Dick WA (1983) Simultaneous determination of nitrate, chloride, sulfate, and phosphate in natural waters by ion chromatography. J. Environ. Qual. 12: 209–213 Tierney GL, Fahey TJ, Groffman PM, Hardy JP, Fitzhugh RD & Driscoll CT (this issue)
Soil freezing alters fine root dynamics in a northern hardwood forest. Biogeochem. 56: 175–190
Van Katwijk VF, Rango A & Childress AE (1993) Effect of simulated climate change on snowmelt runoff modeling in selected basins. Water Res. Bull. 29: 755–766
Vitousek PM, Aber JD, Howarth RW, Likens GE, Matson PA, Schindler DW, Schlesinger WH & Tilman D (1997) Human alteration of the global nitrogen cycle: Sources and consequences. Ecol. Appl. 7: 737–750
Williams MW, Losleben M, Caine N & Greenland D (1996) Changes in climate and hydro-chemical responses in a high-elevation catchment in the Rocky Mountains, U.S.A. Limnol. Oceanogr. 41: 939–946