1
CHAPTER 3
PROFITABILITY AND SENSITIVITY ANALYSIS
3.1 Rate of Return/Return of Investment
Rate of Return (ROR) or Return of Investment (ROI) is the annual interest rate made by the profits on the original investment. ROI provides a snapshot view of the profitability of the plant, normally using the estimates of the elements of the investment and the pre-tax or after-tax earnings. For ROI, and all of the approximate profitability measures of this section, the production cost is computed using straight-line depreciation, and after some startup period, the plant is assumed to operated each year at full capacity (or at some percentage of full capacity) for the same number of days per year. As was stated earlier, many definitions of ROI have been suggested and used. Here, the most common definition is applied.
ROI
=
annual net profit
totalcapital investment
x
100
(3.1)The amount of annual net profit is Rp Rp6,758,518,962.07
while the amount of total capital investment is Rp xxxx. Therefore the calculation of ROI for Cassathan plant is shown as follows
ROI=❑
❑=¿
ROI = %
Based on the amount of ROI (xxxx %) we can see that d-HEEL production is an interesting investment for investor, considering the relatively high ROI.
3.2 Payback Period
PBP= Depreciable FCI+Interest onTCI during service life
(avg . profit/year+avg . depreciation/year)as constant annuity×100 (3.2)
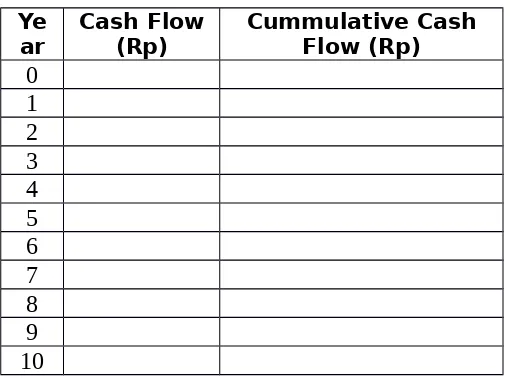
where the FCI is Fixed Capital Investment and TCI is Total Capital Investment. The analysis of payback period is calculated in ten years because it is considered long enough and used in most economic analysis for the material and property industrial’s service life. Based on the assumptions, the payback period is calculated as follows.
Table 3.1 Payback Period Calculation
Ye
ar Cash Flow(Rp) Cummulative CashFlow (Rp) 0
Figure 3.1 Cummulative Cash Flow vs. Year for Payback Period Calculation
The precise calculation of payback period time is done by using interpolation method between the third and fourth year as follows.
−¿=❑
❑
PBP−¿¿ ¿
PBP=days
Based on the calculation, we can conclude that this Shoes’ Smell Remover Product can get its payback in period less than 4 years, which is classified as intermediate time that is proper to recover the cost of investment. So, the production is acceptable.
3.3 Break Even Point
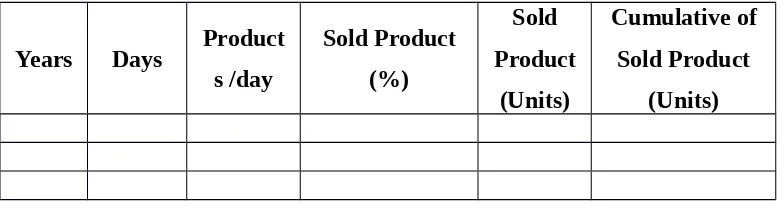
a determined price to cover the costs that emerge and obtain profit. BEP analysis is very important so that we don’t experience loss during the production. The payback period of our plant is 2.2 years or equal with 581 days. Therefore, the amount of production until the 580th day can be used to determine the breakeven
point. The calculation of BEP is shown in Table 3.2
Table 3.2 Breakeven point calculation
Years Days Product
Based on the calculation in Table 3.2, for a payback period of 581 days, the breakeven point is reached for 2,421,156 products produced.
3.4 Internal Rate of Return
Internal rate of return is the maximum interest rate paid on a project that can still be breakeven at the end of the project life. In other words, internal rate of return is the interest if the net present value equals to zero. Eq. (3.3) can be used to determine the IRR.
where r is the value of IRR while TCI is the total capital investment. The
calculation of IRR is done with the aid of Microsof Excel, because it already has a function to calculate IRR for economic analysis. Based on the calculation in Microsoft Excel, the obtained IRR is 26.93%.
project because it is considered as an interesting project and can give proper profit for the investor.
3.5 Net Present Value
Net Present Value (NPV) is a value that shows the net benefits received by a project over the life of the project at a certain interest rate. NPV can also be interpreted as the present value of the cash flows generated by the investment. During the calculation of NPV, the relevant interest rate is also have to be determined. For this calculation, we also used the MARR value that has been calculated before, which is 18%.
Net present value can be calculated by Eq. (3.4)
CFn ,0= C Fn
(1+i)n (3.4)
where:
CFn = The net cash flow in time n
i = Interest rate used in the project n = Time of the project
If NPV is greater than zero, it means that the project is profitable if it’s executed while if the NPV is less than zero it means that project is not profitable to run. Also, if the NPV equals to zero, it means that the project won’t result in any profit or loss. From the calculation with Microsoft Excel, the NPV is obtained as Rp 7,757,748,277. Because the NPV is greater than zero, based on NPV calculation we can conclude that this project is profitable.
Table 3.6 Calculation Information and Assumptions
3.6 Sensitivity Analysis
3.6.1 Selling Price Fluctuations
This type of sensitivity analysis was performed based on the fluctuation of product sales price. The calculation of this analysis is done and is shown below in the Table 3.3. The parameter which is observed in this calculation is the change in economic viability parameter such as IRR, NPV, and PBP if there is a decline in the level of product sales. When a decline in the selling price is occur, the percentage of IRR obtained will be smaller, which means the rate of return will become longer until it is undefined. On the other hand, it is known that lower selling price will cause a longer payback period.
Table 3.3 Selling Price Fluctuations
Chang
0.85 Rp 42,500 38.15% Rp 3,578,304,547.23 3.69821 0.9 Rp 45,000 47.60% Rp 4,639,345,689.90 3.24068 0.95 Rp 47,500 57.05% Rp 5,700,386,832.57 2.86455 1 Rp 50,000 66.50% Rp 6,761,427,975.23 2.53385 1.05 Rp 52,500 75.94% Rp 7,822,469,117.90 2.27452 1.1 Rp 55,000 85.39% Rp 8,883,510,260.57 2.06569 1.15 Rp 57,500 94.84% Rp 9,944,551,403.24 1.86901
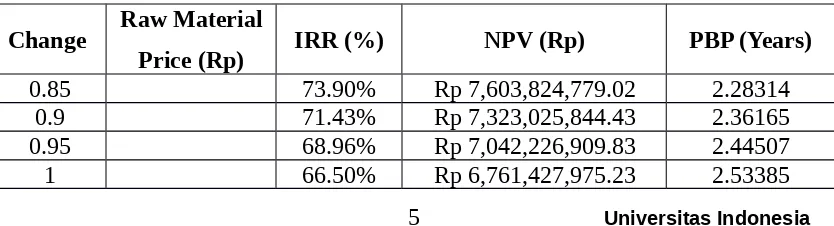
3.6.2 Raw Material Cost Changes
Sensitivity analysis was also performed on the change of the operational costs of this product. One of the most influential factor is the change of the raw material cost. Change of cost that influences production activities can also affect the NPV value. If the cost increase, NPV value tends to be smaller, while if the cost decrease, otherwise will happen. Along with NPV, IRR will also decrease by the change or increase in cost. A longer payback period will also be obtained if the cost that influences production process increase. Table 3.4 shows raw material price fluctuation.
Table 3.4 Raw Material Price Fluctuation
Change Raw Material
Price (Rp) IRR (%) NPV (Rp) PBP (Years)
0.85 73.90% Rp 7,603,824,779.02 2.28314
0.9 71.43% Rp 7,323,025,844.43 2.36165
0.95 68.96% Rp 7,042,226,909.83 2.44507
1.05 64.03% Rp 6,480,629,040.64 2.62856
1.1 61.56% Rp 6,199,830,106.04 2.72979
1.15 59.09% Rp 5,919,031,171.45 2.83824
3.6.3 Operational Cost Changes (Labor Cost Deviation)
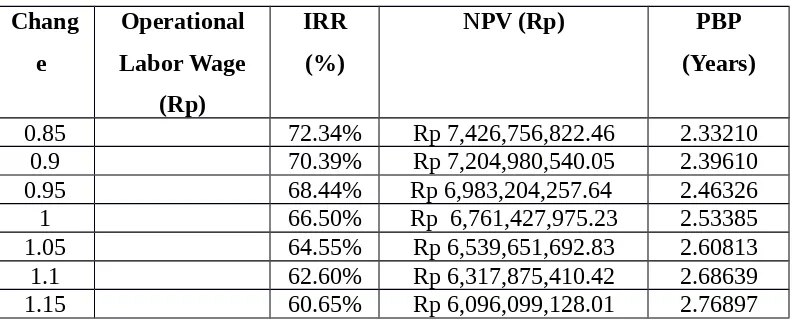
This sensitivity analysis was performed on the change of the operational costs of the product. One of the most important cost is the cost of the labor salary. The observed parameter in this analysis is also the change in economic viability parameter (NPV, PBP, and IRR). The increase in operating expenses to support the production activities will cause a change in NPV. NPV value will be smaller by the increase of operational costs. The change in operational cost will also cause the change in IRR value. Increasing labor cost or operating cost will decrease the value of IRR. Lower IRR value means that the return will be smaller (become less profitable). Aside from NPV and IRR, PBP value will also change as the result of change in labor cost. PBP tends to be longer if the labor cost increases.
Table 3.5 Operating Labor Wage Fluctuation
Chang
0.85 72.34% Rp 7,426,756,822.46 2.33210
0.9 70.39% Rp 7,204,980,540.05 2.39610
0.95 68.44% Rp 6,983,204,257.64 2.46326
1 66.50% Rp 6,761,427,975.23 2.53385
1.05 64.55% Rp 6,539,651,692.83 2.60813
1.1 62.60% Rp 6,317,875,410.42 2.68639
1.15 60.65% Rp 6,096,099,128.01 2.76897
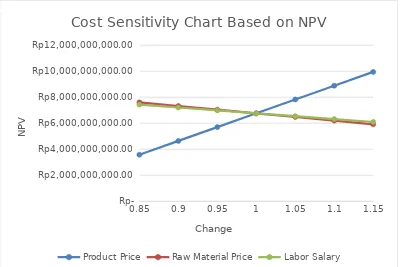
3.6.4 Fluctuation Graphics
The graphics shown below are described in three section. The first graphic is about the NPV, the second graphic is about the IRR, and the third graphic is about PBP.
0.85 0.9 0.95 1 1.05 1.1 1.15 Rp-
Rp2,000,000,000.00 Rp4,000,000,000.00 Rp6,000,000,000.00 Rp8,000,000,000.00 Rp10,000,000,000.00 Rp12,000,000,000.00
Cost Sensitivity Chart Based on NPV
Product Price Raw Material Price Labor Salary
Change
N
P
V
Figure 3.2 Graphic of Net Present Value Fluctuation
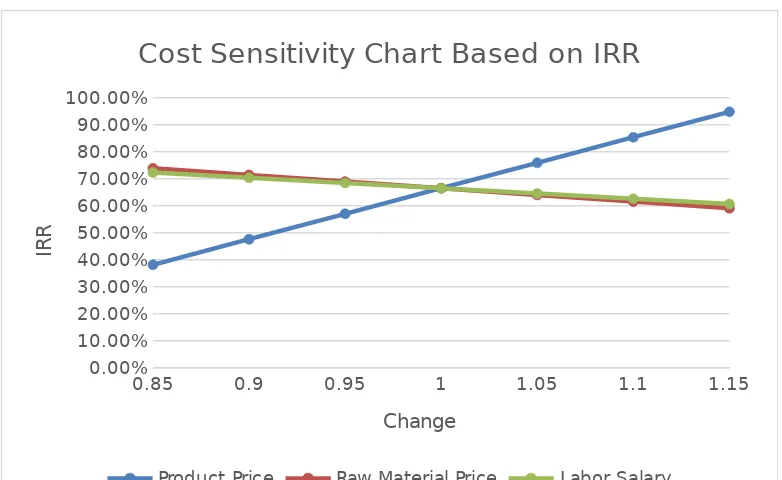
3.6.4.2 Internal Rate of Return
0.85 0.9 0.95 1 1.05 1.1 1.15 0.00%
10.00% 20.00% 30.00% 40.00% 50.00% 60.00% 70.00% 80.00% 90.00% 100.00%
Cost Sensitivity Chart Based on IRR
Product Price Raw Material Price Labor Salary
Change
IR
R
Figure 3.3 Graphic of Internal Rate of Return Fluctuation
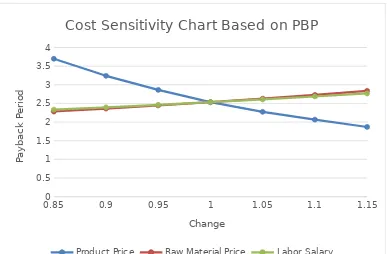
3.6.4.3 Payback Period
Cost Sensitivity Chart Based on PBP
Product Price Raw Material Price Labor Salary
Change
Figure 3.4 Graphic of Payback Period Fluctuation
10
CHAPTER 4 CONCLUSION
Based on the text before, the conclusions of this report are
The
11