International Journal of Quality & Reliability Management
A st ruct ural equat ion model f or eval uat ing t he rel at ionship bet ween t ot al qual it y management and empl oyees’ product ivit yNilda Tri Putri, Shari Mohd Yusof, Alizar Hasan, Haesti Sujita Darma,
Article information:
To cite this document:
Nilda Tri Putri, Shari Mohd Yusof, Alizar Hasan, Haesti Sujita Darma, (2017) "A structural equation model for evaluating the relationship between total quality management and employees’ productivity", International Journal of Quality & Reliability Management, Vol. 34 Issue: 8, pp.1138-1151, https:// doi.org/10.1108/IJQRM-10-2014-0161
Permanent l ink t o t his document :
https://doi.org/10.1108/IJQRM-10-2014-0161
Downl oaded on: 05 Sept ember 2017, At : 02: 09 (PT)
Ref erences: t his document cont ains ref erences t o 38 ot her document s. To copy t his document : permissions@emeral dinsight . com
The f ul l t ext of t his document has been downl oaded 43 t imes since 2017*
Users who downloaded this article also downloaded:
(2016),"Direct effects of quality management on competitive advantage", International Journal of Quality & Reliability Management, Vol. 33 Iss 9 pp. 1286-1310 <a href="https://doi.org/10.1108/ IJQRM-07-2014-0086">https://doi.org/10.1108/IJQRM-07-2014-0086</a>
(2017),"Does interaction between TQM practices and knowledge management processes enhance the innovation performance?", International Journal of Quality & Reliability Management, Vol. 34 Iss 7 pp. 955-974 <a href="https://doi.org/10.1108/IJQRM-09-2014-0138">https://doi.org/10.1108/ IJQRM-09-2014-0138</a>
Access t o t his document was grant ed t hrough an Emeral d subscript ion provided by Token: Eprint s: 63EMS2S5SS8KMM9UVBBK:
For Authors
If you woul d l ike t o writ e f or t his, or any ot her Emeral d publ icat ion, t hen pl ease use our Emeral d f or Aut hors service inf ormat ion about how t o choose which publ icat ion t o writ e f or and submission guidel ines are avail abl e f or al l . Pl ease visit www. emeral dinsight . com/ aut hors f or more inf ormat ion.
About Emerald www.emeraldinsight.com
Emeral d is a gl obal publ isher l inking research and pract ice t o t he benef it of societ y. The company manages a port f ol io of more t han 290 j ournal s and over 2, 350 books and book series vol umes, as wel l as providing an ext ensive range of onl ine product s and addit ional cust omer resources and services.
Emerald is both COUNTER 4 and TRANSFER compliant. The organization is a partner of the Committee on Publication Ethics (COPE) and also works with Portico and the LOCKSS initiative for digital archive preservation.
*Rel at ed cont ent and downl oad inf ormat ion correct at t ime of downl oad.
QUALITY PAPER
A structural equation model for
evaluating the relationship
between total quality management
and employees
’
productivity
Nilda Tri Putri
Department of Industrial Engineering, Andalas University, Padang, Indonesia
Shari Mohd Yusof
Faculty of Mechanical Engineering, Universiti Teknologi Malaysia, Kuala Lumpur, Malaysia, and
Alizar Hasan and Haesti Sujita Darma
Department of Industrial Engineering, Andalas University, Padang, Indonesia
Abstract
Purpose–The purpose of this paper is to analyze the influences of TQM implementation on employees’
productivity in crumb rubber industry (case study conducted in the XYZ firm), and analyze the predominant factors affecting employees’productivity in order to establish the success of TQM implementation.
Design/methodology/approach–Data used in the research was primary data obtained from interview
and questionnaire, and secondary data obtained from the study of literatures, internet, and company’s
documents. The number of respondents in this research was 191. The analysis was done through structural equation modeling (SEM) using the smart partial least square software.
Findings – The findings of this study showed that TQM implementation had positive influences on employees’productivity in XYZ. Tool is the most predominant factor in order to achieve a successful TQM implementation in XYZ. Therefore, the XYZ company will need to work on improving the development and management of the tool which has been available to sustain the effectiveness of TQM practices.
Research limitations/implications–Using a large sample size in the SEM method could improve the results. The implications of this study can be demonstrated through how top managers in this rubber company can improve their employees’productivity through total quality management practices.
Practical implications–This research is useful for manufacturing companies in Indonesia, especially in the crumb rubber industry.
Originality/value–This research used the variable based on the empirical research. TQM was measured using six indicators: human resources, standard, tools, organization, internal audit, and training and education. On the other hand, the work productivity of employees is measured by four indicators: work willingness, work ability, work environment, and work relations.
KeywordsTotal quality management, SEM methods, Work productivity
Paper typeResearch paper
1. Introduction
Due to competition in the business world, companies need to produce quality products. The improvement in products and service quality must also be in line with the enhancement in labor performance. The improvement in these two important aspects would result in companies that are able to survive in the global business environment.
Business management that is focused on flexibility and quality with global insights can be reflected in the quality management (QM) system implemented by business
International Journal of Quality & Reliability Management
The current issue and full text archive of this journal is available on Emerald Insight at: www.emeraldinsight.com/0265-671X.htm
The authors would like to thank Universitas Andalas from BOPTN for the financial support via funding No. 025/UN16/PL/AKS/2015.
1138
IJQRM
34,8
organizations. PT XYZ is one of the manufacturing companies in West Sumatra, Indonesia that produces crumb rubber and has been operating since September 1971. It aims to create a rubber plantation owned by the people around the plant and meet the needs of the national industrial market.
Manufacturing and service companies have implemented a system which aims to improve the quality either from the aspect of product/service or management. The system is known as total quality management (TQM). Productivity of the employees could be improved by implementing TQM. Mersha and Merrick (1997) revealed that TQM is an appropriate method to improve the competitiveness of companies in developing countries. Montes et al. (2003) stated that the organization must implement TQM because of the importance of material and human effort in an organization. This shows that researchers have tried to investigate the relationship between TQM and organizational performance.
Montes et al. (2003) proposed a framework that encompasses the factors affecting the successful implementation of TQM and its impact on organizational performance. They considered the TQM content and elements as important components which affect organizational performance. Prajogo and Sohal (2006) investigated the relationship between organization strategy (in terms of differentiation and cost leadership), organizational structure (in terms of the extent of TQM practices), and organizational performance (in terms of quality and innovation) by using structural equation modeling (SEM). Ooiet al.(2006) conducted a study to examine the relationship between TQM and employees’ propensity to remain specifically within a major Malaysian semiconductor packaging organization. They believed that the implementation of TQM practices in such organizations is able to yield better and long-lasting results on this area of prominent impact. Demirbaget al.(2006) employed the SEM technique to investigate the relationship between the implementation of TQM practices and organizational performance. Their findings revealed that there is a strong positive relationship between TQM practices and non-financial performance of small and medium enterprises (such as changing organizational culture, employee morale, and productivity).
Many authors considered different aspects of performance within organizations in their studies. They categorized organizational performance into financial performance and non-financial performance, business performance, quality performance, innovation performance, and organization effectiveness (Terziovski and Samson, 1999; Monteset al., 2003; Lin et al., 2005; Prajogo and Sohal, 2006; Demirbaget al., 2006; Ooi et al., 2006; Joiner, 2007; Kumar et al., 2009; Fotopoulos and Psomas, 2010; Kim et al., 2012; Gambiet al., 2013; Yuniset al., 2013; Zenget al., 2015; O’Neillet al., 2016).
Montes et al. (2003) believed that TQM affects the level of learning of organization members and the knowledge applied to their tasks, as well as the learning direction. According to them, TQM also affects behavioral factors, influencing this way the work effort level, although these relationships are mediated by the acceptance of the cultural change inherent in TQM. They stated that work motivation, work satisfaction, and organizational commitment are necessary to achieve the effectiveness of TQM program. Therefore, instead of trying to enhance employees’performance by means of incentives on productivity, organizations should empower them and provide them with necessary tools for enhancing the production processes (Chung, 1999). On the basis of this logic, our study attempts to investigate the effect of the TQM practices on employees’productivity in the rubber industry. Gambi et al. (2013) stated that many companies have focused on QM initiatives in order to improve quality and performance. They investigated the relationship between organizational culture and QM techniques and also investigated the impact of this relationship on firms’performance. Joiner (2007) revealed that the implementation of TQM is associated with the enhancement of organizational performance.
This research aims to analyze the influence of TQM implementation on employees’
productivity in PT XYZ. The success of the implementation is affected by indicators that
1139
TQM and
employees
’
productivity
influence TQM. A conceptual model is developed in this study to postulate causal links between TQM and employees’productivity. This enables the use of statistical models to evaluate and identify TQM factors that affect employees’ productivity. Statistical verification analysis in this research was done through SEM using the Smart partial least square (PLS) software.
2. Literature review on the relationship between TQM and performance
Liu and Liu (2014) conducted a study which aimed to investigate the empirical relationships between QM practices and employees’ well-being. They argued that QM practices affect not only employee job satisfaction and productivity, but also other aspects of employees’
well-being. They stated that QM practices change workplace characteristics, affect employees, and improve work-related attitudes and work life outcomes.
Hellsten and Klefsjö (2000) described QM practices as a management system which consists of values, methodologies, and tools, and which aims to increase external and internal customer satisfaction with a reduced amount of resources. Liu and Liu (2014) argued that QM practices seek continuous work improvement; therefore, various organizations apply them in different types of situations. These practices usually include just-in-time inventory systems, ISO 9000, Six Sigma quality programs, TQM, and employee empowerment. These practices differ in content, however they have same purposes that are built on a philosophy of continuous improvement and incremental progress towards organizational efficiency, employee satisfaction, reduced rework, long range thinking, process orientation, customer focus, team-based problem solving, increased employee participation and teamwork, and increased levels of autonomy and empowerment.
A number of studies have attempted to connect QM practices with different work-related criteria, mostly employee job satisfaction. Several QM studies have demonstrated that QM practices are related to employee work attitudes and satisfaction. Terziovski (2006) revealed that TQM increases quality, productivity, and customer and employee satisfaction. Wickramasinghe (2012) analyzed the changes that occurred in the human resource function and human resource management practices as a result of the implementation of TQM in the export-apparel manufacturing industry in Sri Lanka. Lee and Lee (2014) conducted a study which aimed to explore the relationship between TQM, organizational learning (OL), and business performance of insurance companies in Taiwan. The principal findings of their research are as follows: TQM has significant and positive effects on OL; both TQM and OL have significant and positive effects on business performance; OL fosters business performance and plays a mediating role between TQM and business performance; and the non-life and the life insurance industries, which carry out TQM, OL, and business performance, are significantly different.
Numerous past literatures have confirmed that TQM increases customer satisfaction (Leeet al., 2010) and improves organizational performance (Iraniet al., 2004), e.g. firm’s quality performance, leading to an improved financial and market performance (Kaynak, 2003). Most scholars agree that TQM positively affects business performance (Fotopoulos and Psomas, 2010; Lamet al., 2011; Lee and Lee, 2014). It can be summarized that the companies with effective TQM implementation could accomplish the internal benefits such as improvement in quality, enhancement in productivity, or realization of better operating income (Prajogo and Brown, 2012; Tanninenet al., 2010).
3. Research methodology
3.1 Research framework and questions
Variables used in the research are latent variables and manifest variables. In our conceptual model, each latent variable comprises a number of indicators (it is also called as manifest
1140
IJQRM
34,8
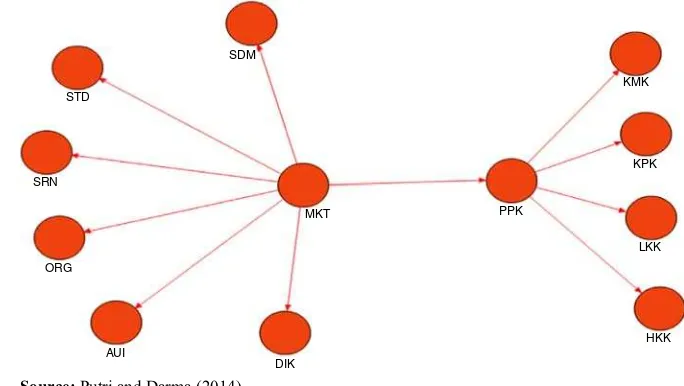
variable in this research). For example, TQM practice is presented by the following six indicators: human resources, standard, tools, organization, internal audit, and training and education (Putri and Darma, 2014). Each indicator consists of a set of measurement items (see Table I). Employees’ productivity consists of employees’ willingness to work, employees’ability, employees’work environment, and employees’work relationship.
A validity test was conducted with the real data to measure the equivalence level between the data collected, in order to find out the extent to which the questionnaires that have been filled out by all respondents were effectively used as a measuring instrument. The validity test was undertaken with regards to questionnaires, filled out by 191 participants. The test was conducted over the statements written in the questionnaires, which accounted for 49 questions (see Appendix), by utilizing the Smart PLS software. Based on the Smart PLS output, it was found that there were 29 invalid questions because their outer loading values were less than 0.6. Therefore, only 20 questions were valid that could be used for number of items in questionnaires.
Based on the literature review, a research model was developed in order to investigate the relationship between TQM implementation and employees’productivity in the rubber industry. The concept of the proposed research framework is illustrated in Figure 1.
After a comprehensive review of literature and to reaffirm the above findings the following hypotheses were developed. A multivariate statistical technique, namely, the SEM was then used to empirically test the proposed hypotheses:
H1. TQM has a positive and significant impact on employees’productivity.
H2. Human resources, tools, standard, organization, internal audit, and training and education have positive and significant impact on TQM implementation.
H3. Work willingness, work ability, work environment, and work relationship have positive and significant impact on employees’productivity.
3.2 Sampling design and construct measurement
The sample in this research consists of employees of PT XYZ. Structural questionnaires with cover letters were used to collect data in PT XYZ. Data collection was conducted in two steps. First, questionnaires were handed to 30 respondents. Then, validity and reliability tests were conducted. Specifically, Cronbach’s α reliability estimate test was applied
(Kuei and Madu, 2001; Monteset al., 2003). If data collected were invalid or not reliable, the questionnaires were revised. This was followed by the second step where questionnaires were given to all employees, out of which 191 responded.
Variables Indicators No. of items No. of items valid
TQM practices (MKT) Human Resources (SDM) 6 2
Standard (STD) 6 3
Tools (SRN) 8 3
Organization (ORG) 4 2
Internal Audit (AUI) 3 2
Training and Education (DIK) 4 2
Employees’Productivity (PPK) Employees’willingness to work (KMK) 5 2
Employees’ability (KPK) 4 0
Employees’work environment (LKK) 4 2
Employees’work relationship (HKK) 5 2
Source:Putri and Darma (2014)
Table I.
Multivariate scales of
TQM and employees’
productivity
1141
TQM and
employees
’
productivity
The instrument was used to measure constructs for all latent variables, namely, TQM practices and employees’productivity. TQM practices, for example, were measured by six constructs. Each construct contains a set of indicators. Respondents were presented with 49 measurement items grouped under different construct headings (see Table I). A five-point interval rating scale system was used in the instrument, with five equaling the highest extent or degree.
4. Findings and discussion
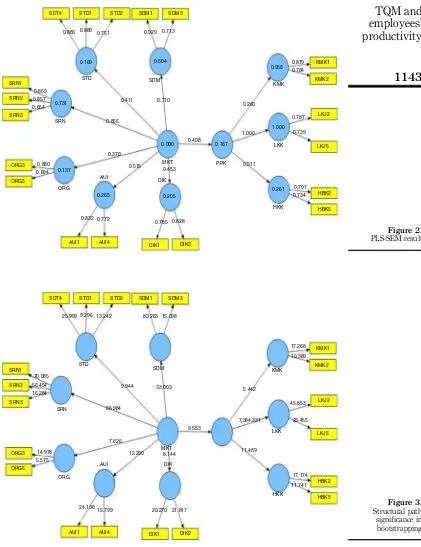
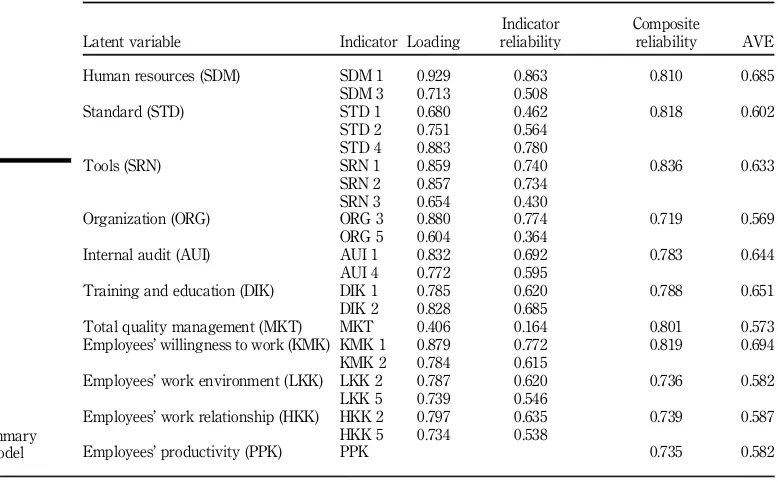
The Figures 2 and 3 display the result of PLSs equation modeling techniques by using Smart PLS. The reliability and validity of latent variables of this model are shown in Table II. Moreover, for the assessment of PLS-SEM model, some basic elements should be covered in this study as following.
4.1 Indicator reliability
The results of Smart PLS are presented in Table I, which indicate that all of the indicators have individual indicator reliability values that are much larger than the minimum acceptable level of 0.4 (Hulland, 1999), and almost every item ranges from 0.164 to 0.863. The indicator reliability value can be calculated by using the square of each of the outer loading.
4.2 Internal consistency reliability
The internal consistency reliability traditionally can be measured by using the Cronbach’s α. On the other hand, the Cronbach’s α tends to provide the lower bound
estimate reliability and conservative measurement in PLS-SEM, and therefore scholars have suggested the use of“composite reliability”as a substitute (Hairet al., 2006). Table II shows the values of composite reliability to be larger than 0.6; therefore, the high levels of internal consistency reliability have been denoted among all eleven latent variables, which are human resources, standard, tools, organization, internal audit, training and education, employees’ willingness to work, employees’ work environment, employees’ work relationship, TQM, and employees’productivity.
SDM
STD
SRN
ORG
AUI
DIK
MKT PPK
KMK
KPK
LKK
HKK
Source: Putri and Darma (2014) Figure 1.
Conceptual model-structural equation modelling
1142
IJQRM
34,8
5.442
25.959 9.296 13.242 83.263 15.098
STD
SDM SDT4 STD1 STD2 SDM1 SDM3
Figure 3.
Structural path significance in bootstrapping
SDT4
0.883 0.880 0.751 0.929 0.713
0.504
4.3 Convergent validity
In order to check the convergent validity of the PLS-SEM model, the average variance extracted (AVE) for each latent variable should be evaluated. It can be seen from Table II that all AVE values are greater than the acceptable threshold of 0.5, and so convergent validity is confirmed.
4.4 Discriminant validity
Discriminant validity of the measurement model with reflective indicators shown in Table III can be assessed by measuring the construct cross loading. If the correlation between a construct and measurement items is greater than it is for other latent constructs, this will indicate that the concerned latent construct has better measurement prediction for items as compared to other latent constructs.
Latent variable Indicator Loading
Indicator reliability
Composite
reliability AVE
Human resources (SDM) SDM 1 0.929 0.863 0.810 0.685
SDM 3 0.713 0.508
Standard (STD) STD 1 0.680 0.462 0.818 0.602
STD 2 0.751 0.564
STD 4 0.883 0.780
Tools (SRN) SRN 1 0.859 0.740 0.836 0.633
SRN 2 0.857 0.734
SRN 3 0.654 0.430
Organization (ORG) ORG 3 0.880 0.774 0.719 0.569
ORG 5 0.604 0.364
Internal audit (AUI) AUI 1 0.832 0.692 0.783 0.644
AUI 4 0.772 0.595
Training and education (DIK) DIK 1 0.785 0.620 0.788 0.651
DIK 2 0.828 0.685
Total quality management (MKT) MKT 0.406 0.164 0.801 0.573
Employees’willingness to work (KMK) KMK 1 0.879 0.772 0.819 0.694
KMK 2 0.784 0.615
Employees’work environment (LKK) LKK 2 0.787 0.620 0.736 0.582
LKK 5 0.739 0.546
Employees’work relationship (HKK) HKK 2 0.797 0.635 0.739 0.587
HKK 5 0.734 0.538
Employees’productivity (PPK) PPK 0.735 0.582
Table II.
Results summary for outer model
AUI DIK HKK KMK LKK MKT ORG PPK SDM SRN STD
AUI 0.414
DIK 0.163 0.422
HKK 0.311 0.346 0.343
KMK 0.277 0.332 0.189 0.480
LKK 0.494 0.390 0.511 0.260 0.338
MKT 0.514 0.452 0.305 0.408 0.406 0.327
ORG 0.286 0.197 0.275 0.157 0.117 0.370 0.324
PPK 0.495 0.391 0.511 0.260 0.999 0.408 0.120 0.338
SDM 0.639 0.339 0.345 0.307 0.450 0.710 0.270 0.452 0.469
SRN 0.274 0.360 0.198 0.345 0.262 0.854 0.331 0.263 0.343 0.401
STD 0.484 0.189 0.386 0.350 0.511 0.411 0.376 0.512 0.559 0.225 0.362
Table III.
Another method for assessing the discriminant validity is comparison between the value of the square root of AVE in each latent construct and the other correlation value among the latent constructs (Fornell and Larcker, 1981). If this value is larger than other correlation values among the latent constructs, this will indicate that the latent construct is well established. From Table II, it can be shown that the latent construct KMK has AVE value 0.694. This indicates that KMK has value larger than other correlation values among the latent constructs; so it is well established.
4.5 Explanation of TQM and employees’productivity variance
In order to test the hypothesis that postulated a positive and significant relationship between all dimensions of TQM (human resources, standard, tools, organization, internal audit, training and education) and employees’productivity, the Smart PLS results can be analyzed. The analysis would determine the variance of employees’productivity explained by six dimensions of TQM that are displayed in Figure 2 and Table IV. Furthermore, the results indicate that the coefficient of determination, R2, is 0.167 for endogenous latent variable. This means that the six dimensions of TQM jointly explain 16.7 percent of the variance of employees’productivity.
The Smart PLS results also indicate that the six dimensions of TQM sequentially have path coefficients as follows: 0.515 for the effect of internal audit (AUI), 0.453 for the effect of training and education (DIK), 0.369 for the effect of organization (ORG), 0.710 for the effect of human resources (SDM), 0.855 for the effect of tools (SRN), and 0.411 for standard (STD). It can be summarized that the dimension tools has the strongest effect on TQM. Meanwhile, the effect of TQM on employees’productivity had a path coefficient value of 0.408.
The Smart PLS results also indicate that among the three dimensions of employees’
productivity (PPK), employees’work environment (LKK) had the highest path coefficient value of 0.999. This means that employees’work environment has the strongest effect on employees’productivity.
Table IV and Figure 3 show the structural path significance in bootstrapping. Furthermore, to check whether path coefficients of the inner model are significant or not, a two-tailed t-test with significance level of 5 percent can be used. The results indicate that the hypothesized path relationship among all variables was statistically significant, with a significance level of 1 percent. Thet-statistics of all variables have the value larger than 2.58. Therefore, the proposed hypotheses (which postulated a positive and significant relationship between all dimensions of TQM and employees’productivity) were all supported.
Original sample (O) Sample mean (M) SD SE
t-statistics (|O/STERR|)
Hypotheses testing results
MKT→AUI 0.514956 0.514948 0.042211 0.042211 12.199550 Supported
MKT→DIK 0.452523 0.465399 0.055565 0.055565 8.144055 Supported
MKT→ORG 0.369990 0.371604 0.048519 0.048519 7.625720 Supported
MKT→PPK 0.408486 0.411679 0.042762 0.042762 9.552601 Supported
MKT→SDM 0.710278 0.709840 0.021522 0.021522 33.003063 Supported
MKT→SRN 0.854737 0.857419 0.012760 0.012760 66.983725 Supported
MKT→STD 0.411365 0.417912 0.041370 0.041370 9.943565 Supported
PPK→HKK 0.510999 0.513245 0.044479 0.044479 11.488570 Supported
PPK→KMK 0.259902 0.267054 0.047760 0.047760 5.441821 Supported
PPK→LKK 0.999894 0.999862 0.000135 0.000135 7,384.330622 Supported
MKT→AUI 0.514956 0.514948 0.042211 0.042211 12.199550 Supported
Table IV.
5. Discussion
MKT-independent latent variables have a positive influence on PPK-dependent latent variable, as demonstrated byt-statistics of 9.55 (t-statisticsWt-table 2.58). Therefore,H1is
accepted. It can be concluded that TQM has a positive and significant influence on employees’productivity. This result is consistent with the result obtained by Monteset al. (2003), who revealed that there are several behavioral and attitudinal processes that are necessary to achieve a successful implementation of TQM, i.e. work motivation, work satisfaction, and organizational commitment. Cetindere et al. (2015) also believed that businesses desiring to increase their performance should place more emphasis on the TQM criteria. If businesses adopt and properly practice the TQM concept, they shall realize that the results are desirable and headed towards perfection.
If the employees in a company are less motivated, or are dissatisfied or less committed, it will affect their productivity, and will lead to a lack of effectiveness of TQM programs. The effectiveness of TQM implementation in the PT XYZ rubber company greatly affects the increase in labor productivity.
Human resources, standard, tools, organization, internal audit, as well as training and education have a positive influence on MKT as latent variable, based on a loading factor valueW0.5 and t-statistics greater than t-table (2.58) for each indicator. Therefore, H2 is
accepted. It can be concluded that human resources, tools, standard, organization, internal audit, and training and education have a positive and significant impact on TQM implementation.
Dehaghi and Rouhani (2014) confirmed that human resources are also considered as one of the key components of any organization to reach organizational performance. The element tools has a great impact on the successful implementation of TQM. Quality control in the company must be provided the tools in practice. Tools are needed in the implementation of TQM, and due to the existence of tools, the aims and objectives of a company can be achieved. TQM implementation will be more effective if supported by proper tools. This result is line with Gambiet al.(2013). They also reinforce that quality tools are several techniques that support the process improvement in organization; these techniques help employees to use their knowledge effectively. Quality tools are ways to achieve process improvements; in doing so, their use is related to internal environment.
This result is supported by the result from Sadikoglu and Olcay (2014). They confirmed that effective training will improve employees’loyalty to the firm, motivation, and work performance. They found that training is positively related to operational performance, employee performance, and customer results.
Other researchers have also reached similar results, with Kimet al. (2012) stating the importance of implementing TQM practices in performance enhancement. They found that training and employee relations indirectly and positively relate to innovation performance through other QM practices, such as management leadership, supplier QM, customer relations, and product and service design. Cetindere et al. (2015) found that TQM’s leadership and training criteria have a higher correlation with business performance as compared to other criteria. They believed that companies should ensure that their staff receive the necessary training on quality, and should support continuous improvement under the leadership of senior management.
Work willingness, work environment, and work relationship have a positive influence on labor productivity as latent variable based on loading factorW0.5, and the value oft-statistics
which is owned by each indicator is greater than the value oft-table (2.58). In other words, H3is accepted. It can be summarized that work willingness, work environment, and work relationship have positive and significant impact on employees’productivity.
The high workability of employees in a company can be judged from the capabilities of employees in completing their work within a predetermined time, apart from working in accordance with company standards. Employee productivity at PT XYZ will increase if
1146
IJQRM
34,8
employees have the ability and responsibility to do their job, and complete their task on time and in accordance with the company standards.
Supporting this result, Dehaghi and Rouhani (2014) revealed that there is a positive and significant relationship between employees’ ability, employees’ clarity, and degree of organizational support from employees. Employees’ motivation and willingness, and the manner of employees’ evaluation are generally among factors that have an effect on employee performance. Our findings are consistent with the result suggested by Joiner (2007). She stated the importance of developing an environment or“culture”of support to further enhance the performance outcomes of TQM program. According to her, if employees do not feel that there is acknowledgment and support from the organization and from work colleagues, then TQM will not be implemented effectively.
6. Conclusion
Elements of TQM practices in PT XYZ, such as human resources, standard, organization, internal audit, and training and education, have positive influences on the success of the TQM program. Tools are the most predominant element influencing the success of TQM implementation in PT XYZ. The better development and management of tools in rubber industry will lead to an effective TQM implementation in PT XYZ. It will also have a positive influences on employees’ productivity. On the other hand, improvement in employees’
productivity in PT XYZ is measured by the following indicators: employees’willingness to work, work environment, and work relationships. Based on the SEM analysis, it can be summarized that employees’work environment is the most predominant indicator affecting their productivity, which indicates that better work environment will improve employees’
productivity. Therefore, PT XYZ will need to work on improving the development and management of the tool which has been available to support an effective TQM implementation.
References
Cetindere, A., Duran, C. and Yetisen, M.S. (2015),“The effects of total quality management on the business performance: an application in the province of Kütahya”,Procedia Economics and Finance, Vol. 23, October, pp. 1376-1382, doi: 10.1016/S2212-5671(15)00366-4.
Chung, C.H. (1999), “It is the process: a philosophical foundation for quality management”, Total Quality Management, Vol. 10 No. 2, pp. 187-198.
Dehaghi, M.R. and Rouhani, A. (2014),“Studying the relationship between the effective factors on employees’performance in Iran’s university and the students’satisfaction with regards to employees’performance”,Procedia–Social and Behavioral Sciences, Vol. 141, pp. 903-908. Demirbag, M., Tatoglu, E., Tekinkus, M. and Zaim, S. (2006),“An analysis of the relationship between
TQM implementation and organizational performance: evidence from Turkish SMEs”, Journal of Manufacturing Technology Management, Vol. 17 No. 6, pp. 829-847.
Fornell, C. and Larcker, D.F. (1981), “Structural equation models with unobservable variables and measurement error: Algebra and Statistics”,Journal of Marketing Research, Vol. 18 No. 3, pp. 382-388. Fotopoulos, C.V. and Psomas, E.L. (2010),“The structural relationships between TQM factors and
organizational performance”,The TQM Journal, Vol. 22 No. 5, pp. 539-552.
Gambi, L.d.N., Gerolamo, M.C. and Carpinetti, L.C.R. (2013),“A theoretical model of the relationship between organizational culture and quality management techniques”,Procedia–Social and Behavioral Sciences, Vol. 81 No. 81, pp. 334-339.
Hair, J.F. Jr, Anderson, R.E., Tatham, R.L. and Black, W.C. (2006),Multivariate Data Analysis, Vol. 6, Pearson Prentice Hall, Upper Saddle River, NJ.
Hellsten, U. and Klefsjö, B. (2000),“TQM as a management system consisting of values, techniques, and tools”,The TQM Magazine, Vol. 12 No. 4, pp. 238-244, available at: https://doi.org/10.1108/ 09544780010325822
1147
TQM and
employees
’
productivity
Hulland, J. (1999),“Use of partial least squares (PLS) in strategic management research: a review of four recent studies”,Strategic Management Journal, Vol. 20 No. 2, pp. 195-204.
Irani, Z., Beskese, A. and Love, P. (2004),“Total quality management and corporate culture: constructs of organizational excellence”,Technovation, Vol. 24, pp. 643-650.
Joiner, T. (2007),“TQM and performance the role of organization support and co-worker support”, International Journal of Quality and Reliability Management, Vol. 24 No. 6, pp. 617-627.
Kaynak, H. (2003),“The relationship between total quality management practice and their effects on firm performance”,Journal of Operation management, Vol. 21 No. 4, pp. 405-435.
Kim, D.Y., Kumar, V. and Kumar, U. (2012),“Relationship between quality management practices and innovation”,Journal of Operations Management, Vol. 30 No. 4, pp. 295-315.
Kuei, C. and Madu, C.N. (2001), “Identifying critical success factors for supply chain quality management”,Asia Pacific Management Review, Vol. 6 No. 4, pp. 409-423.
Kumar, V., Choisne, F., Grosbois, D. de and Kumar, U. (2009), “Impact of TQM on company’s performance”, International Journal of Quality and Reliability Management, Vol. 26 No. 1, pp. 23-37.
Lam, S.Y., Lee, W.H., Ooi, K.B. and Lin, B. (2011),“The relationship between TQM, learning orientation and market performance in service organizations: an empirical analysis”, Total Quality Management and Business Excellence, Vol. 22 No. 12, pp. 1277-1297.
Lee, H.-H. and Lee, C.-Y. (2014),“The effects of total quality management and organisational learning on business performance: evidence from Taiwanese insurance industries”, Total Quality Management and Business Excellence, Vol. 25 Nos 9/10, pp. 1072-1087.
Lee, V.H., Lam, S.Y., Ooi, K.B. and Safa, M.S. (2010),“Structural analysis of TQM and its impact on customer satisfaction and innovation”, International Journal of Modeling in Operations Management, Vol. 1 No. 2, pp. 157-179.
Lin, C., Chow, W.S., Madu, C.N., Kuei, C.-H. and Yu, P.-P. (2005),“A structural equation model of supply chain quality management and organizational performance”,International Journal of Production Economics, Vol. 96 No. 3, pp. 355-365.
Liu, N.-C. and Liu, W.-C. (2014),“The effects of quality management practices on employees’well-being”, Total Quality Management and Business Excellence, Vol. 25 Nos 11/12, pp. 1247-1261.
Mersha, T. and Merrick, R.G. (1997),“TQM implementation in IDCs: driving and restraining forces”, International Journal of Operations and Production Management, Vol. 17 Nos 1/2, pp. 164-184. Montes, F.J.L., Jover, A.V. and Fernandez, L.M.M. (2003),“Factors affecting the relationships between total quality management and organizational performance”,International Journal of Quality and Reliability Management, Vol. 20 No. 2, pp. 189-209.
O’Neill, P., Sohal, A. and Teng, C.W. (2016),“Quality management approaches and their impact on firms’ financial performance – an Australian study”, International Journal of Production Research, Vol. 171, Part 3, pp. 381-393.
Ooi, K.B., Veeri, A., Yin, L.K. and Vellapan, L.S. (2006),“Relationships of TQM practices and employees’
propensity to remain: an empirical case study”,The TQM Magazine, Vol. 18 No. 5, pp. 528-541. Prajogo, D. and Brown, A. (2012),“The relationship between TQM practices and quality performance and the role of formal TQM programs: an Australian empirical study”,Quality Management Journal, Vol. 11 No. 4, pp. 31-42.
Prajogo, D.I. and Sohal, A.S. (2006),“The relationship between organization strategy, total quality management (TQM), and organization performance–the mediating role of TQM”,European Journal of Operational Research, Vol. 168, pp. 35-50.
Putri, N.T. and Darma, H.S. (2014), “The effect of TQM implementation towards productivity of employees using structural equation modelling analysis method in PT XYZ”,Proceeding of the 7th IEEE International Conference on Management of Innovation and Technology (ICMIT), Singapore,September 23-25.
1148
IJQRM
34,8
Sadikoglu, E. and Olcay, H. (2014),“The effects of TQM practices on performance and the reasons of and the barriers to TQM practices in Turkey”,Advances in Decision Sciences, Vol. 2014, pp 1-17, available at: http://dx.doi.org/10.1155/2014/537605
Tanninen, K., Puumalainen, K. and Sandström, J. (2010),“The power of TQM: analysis of its effects on profitability, productivity and customer satisfaction”,Total Quality Management, Vol. 21 No. 2, pp. 171-184.
Terziovski, M. (2006),“Quality management practices and their relationship with customer satisfaction and productivity improvement”,Management Research News, Vol. 29 No. 7, pp. 414-424. Terziovski, M. and Samson, D. (1999), “The link between total quality management practice and
organizational performance”, International Journal of Quality and Reliability Management, Vol. 16 No. 3, pp. 226-237.
Wickramasinghe, V. (2012),“Influence of total quality management on human resource management practices: an exploratory study”,International Journal of Quality and Reliability Management, Vol. 29 No. 8, pp. 836-850.
Yunis, M., Jung, J. and Chen, S. (2013), “TQM, strategy, and performance: a firm-level analysis”, International Journal of Quality and Reliability Management, Vol. 30 No. 6, pp. 690-714.
Zeng, J., Phan, C.A. and Matsui, Y. (2015),“The impact of hard and soft quality management on quality and innovation performance: an empirical study”, International Journal of Production Economics, Vol. 162, pp. 216-226.
Further reading
Besterfield, D.H. (2003),Quality Control, Prentice Hall, New York, NY. Sinulingga, S. (2011),Research Methods, USU Press, Medan.
Sugiyono (2005),Methods of Qualitative Research, Alfabeta, Bandung.
(The Appendix follows overleaf.)
1149
TQM and
employees
’
productivity
Appendix
(continued)
1150
IJQR
M
34,8
Corresponding author
Nilda Tri Putri can be contacted at: [email protected]
For instructions on how to order reprints of this article, please visit our website: www.emeraldgrouppublishing.com/licensing/reprints.htm
Or contact us for further details:[email protected]
1151
TQM and
employees
’
productivity
■ ■ ■
■ ■ ■ ■
■
■ ■
■
Enter J ournal T itle, I S SN or Publisher Name
International J ournal of Quality and R eliability Management http://www.scimagojr.com/journalsearch.php?q=144740& tip=sid& clean=0
International J ournal of Quality and R eliability Management http://www.scimagojr.com/journalsearch.php?q=144740& tip=sid& clean=0
T his J ourna l
P ilih B a ha s a
D ibe rda y a ka n ole h T e rj e ma h a n
A structural equation model for evaluating the relationship between tot... http://www.emeraldinsight.com/doi/pdfplus/10.1108/IJ QR M-10-2014-0161
A structural equation model for evaluating the relationship between tot... http://www.emeraldinsight.com/doi/pdfplus/10.1108/IJ QR M-10-2014-0161
A structural equation model for evaluating the relationship between tot... http://www.emeraldinsight.com/doi/pdfplus/10.1108/IJ QR M-10-2014-0161