AUTHORS
Indonesia Climate Change Sectoral Roadmap – ICCSR Energy Sector part 1 (Java-Bali Power System)
Adviser
Prof. Armida S. Alisjahbana, Minister of National Development Planning/Head of Bappenas
Editor in Chief
U. Hayati Triastuti, Deputy Minister for Natural Resources and Environment, Bappenas
ICCSR Coordinator
Edi Effendi Tedjakusuma, Director of Environmental Affairs, Bappenas
Editors
Irving Mintzer, Syamsidar Thamrin, Heiner von Luepke, Dieter Brulez
Synthesis Report
Coordinating Authors for Mitigation: Hardiv Haris Situmeang
Energy Sector Report
Authors: Meirios Moechtar, Wendranirsa, Iwan Adhisaputra.
Technical Supporting Team
Chandra Panjiwibowo, Indra Ni Tua, Hendra Julianto, Leyla Stender, Tom Harrison, Ursula Flossmann-Krauss
Administrative Team
ACKNOWLEDGMENTS
The Indonesia Climate Change Sectoral Roadmap (ICCSR) is meant to provide inputs for the next ive
year Medium-term Development Plan (RPJM) 2010-2014, and also for the subsequent RPJMN until 2030, laying particular emphasis on the challenges emerging in the forestry, energy, industry, agriculture, transportation, coastal area, water, waste and health sectors. It is Bappenas policy to address these challenges and opportunities through effective development planning and coordination of the work of all line ministries, departments and agencies of the Government of Indonesia (GoI). It is a dynamic document and it will be improved based on the needs and challenges to cope with climate change in the future. Changes and adjustments to this document would be carried out through participative consultation among stakeholders.
High appreciation goes to Mrs. Armida S. Alisyahbana as Minister of National Development Planning /Head of the National Development Planning Agency (Bappenas) for the support and encouragement. Besides, Mr. Paskah Suzetta as the Previous Minister of National Development Planning/ Head of Bappenas who initiated and supported the development of the ICCSR, and Deputy Minister for Natural Resources and Environment, Ministry of National Development Planning /Bappenas, who initiates and coordinates the development of the ICCSR.
To the following steering committee, working groups, and stakeholders, who provide valuable comments and inputs in the development of the ICCSR Energy Sector Part 1 (Java-Bali Power System) document, their contributions are highly appreciated and acknowledged:
Steering Committee (SC)
Deputy of International Cooperation, Coordinating Ministry for Economy; Secretary of Minister, Coordinating Ministry for Public Welfare; Secretary General, Ministry of Energy and Mineral Resources; Secretary General, Ministry of Industry; Secretary General, Ministry of Transportation; Deputy of Economy, Deputy of Infrastructures, Deputy of Development Funding, Deputy of Human Resources and Culture, Deputy of Regional Development and Local Autonomy, National Development Planning Agency; and Chief of Secretariat of the National Council for Climate Change.
Working Group
Ministry of Energy and Resources
Imam Haryono, Endang Supraptini, Yasmita, Zurlasni, A Juanda, A. Wahyudi, Rochmi. W, Lilih. H, Agung Gunardo, Yudhi Syahputra
Ministry of Transportation
Wendy Aritenang, Santoso Edi Wibowo, Balkis K., Saladin, Endang Rosadi, Rudi Adiseta, Suwarto, Dyah C. Pitaloka, Imam Hambali, Danawiryya. S, Eka Novi Adrian, Tutut. M, Yuki Hasibuan, Yusfandri, Ira J
National Development Planning Agency
Sriyanti, Yahya R. Hidayat, Bambang Prihartono, Mesdin Kornelis Simarmata, Arum Atmawikarta, Montty Girianna, Wahyuningsih Darajati, Basah Hernowo, M. Donny Azdan, Budi Hidayat, Anwar Sunari, Hanan Nugroho, Jadhie Ardajat, Hadiat, Arif Haryana, Tommy Hermawan, Suwarno, Erik Amundito, Rizal Primana, Nur H. Rahayu, Pungki Widiaryanto, Maraita, Wijaya Wardhana, Rachmat Mulyanda, Andiyanto Haryoko, Petrus Sumarsono, Maliki
Universities and Professionals
ITB: Saut Lubis, Retno Gumilang; KNI WEC: Aziz Trianto
Grateful thanks to all staff of the Deputy Minister for Natural Resources and Environment, Ministry of National Development Planning/ Bappenas, who were always ready to assist the technical facilitation as
well as in administrative matters for the inalization process of this document.
Remarks from Minister of National
Development Planning/Head of bappenas
We have seen that with its far reaching impact on the world’s ecosystems as well as human security and development, climate change has emerged as one of the most intensely critical issues that deserve the attention of the world’s policy makers. The main theme is to avoid an increase
in global average temperature that exceeds 2˚C, i.e. to reduce annual
worldwide emissions more than half from the present level in 2050. We believe that this effort of course requires concerted international
response – collective actions to address potential conl icting national
and international policy initiatives. As the world economy is now facing
a recovery and developing countries are struggling to fuli ll basic needs
for their population, climate change exposes the world population to exacerbated life. It is necessary, therefore, to incorporate measures to address climate change as a core concern and mainstream in sustainable development policy agenda.
We are aware that climate change has been researched and discussed the world over. Solutions have been proffered, programs funded and partnerships embraced. Despite this, carbon emissions continue to increase in both developed and developing countries. Due to its geographical location, Indonesia’s
vulnerability to climate change cannot be underplayed. We stand to experience signii cant losses. We will face – indeed we are seeing the impact of some these issues right now- prolonged droughts, l ooding and
increased frequency of extreme weather events. Our rich biodiversity is at risk as well.
Those who would seek to silence debate on this issue or delay in engagement to solve it are now marginalized to the edges of what science would tell us. Decades of research, analysis and emerging environmental evidence tell us that far from being merely just an environmental issue, climate change will touch every aspect of our life as a nation and as individuals.
Regrettably, we cannot prevent or escape some negative impacts of climate change. We and in particular the developed world, have been warming the world for too long. We have to prepare therefore to adapt to the changes we will face and also ready, with our full energy, to mitigate against further change. We
have ratii ed the Kyoto Protocol early and guided and contributed to world debate, through hosting
the 13th Convention of the Parties to the United Nations Framework Convention on Climate Change
planning and priority setting.
I am delighted therefore to deliver Indonesia Climate Change Sectoral Roadmap, or I call it ICCSR, with the aim at mainstreaming climate change into our national medium-term development plan.
The ICCSR outlines our strategic vision that places particular emphasis on the challenges emerging in the forestry, energy, industry, transport, agriculture, coastal areas, water, waste and health sectors. The content of the roadmap has been formulated through a rigorius analysis. We have undertaken vulnerability assessments, prioritized actions including capacity-building and response strategies, completed by
associated inancial assessments and sought to develop a coherent plan that could be supported by line
Ministries and relevant strategic partners and donors.
I launched ICCSR to you and I invite for your commitment support and partnership in joining us in realising priorities for climate-resilient sustainable development while protecting our population from further vulnerability.
Minister for National Development Planning/ Head of National Development Planning Agency
Remarks from Deputy Minister for Natural
Resources and Environment, bappenas
To be a part of the solution to global climate change, the government of Indonesia has endorsed a commitment to reduce the country’s GHG emission by 26%, within ten years and with national resources, benchmarked to the emission level from a business as usual and, up to 41% emission reductions can be achieved with international support to our mitigation efforts. The top two sectors that contribute to the country’s emissions are forestry and energy sector, mainly emissions from deforestation and by power plants, which is in part due to the fuel used, i.e., oil and coal, and part of our high energy intensity.
With a unique set of geographical location, among countries on the Earth we are at most vulnerable to the negative impacts of climate
change. Measures are needed to protect our people from the adverse effect of sea level rise, l ood,
greater variability of rainfall, and other predicted impacts. Unless adaptive measures are taken, prediction tells us that a large fraction of Indonesia could experience freshwater scarcity, declining crop yields, and vanishing habitats for coastal communities and ecosystem.
National actions are needed both to mitigate the global climate change and to identify climate change adaptation measures. This is the ultimate objective of the Indonesia Climate Change Sectoral Roadmap, ICCSR. A set of highest priorities of the actions are to be integrated into our system of national development planning. We have therefore been working to build national concensus and understanding of climate change response options. The Indonesia Climate Change Sectoral Roadmap (ICCSR) represents our long-term commitment to emission reduction and adaptation measures and it shows our ongoing, inovative climate mitigation and adaptation programs for the decades to come.
Deputy Minister for Natural Resources and Environment National Development Planning Agency
TAbLE Of CONTENTS
AUTHORS i
ACKNOWLEDGMENTS iii
Remarks from Minister of National Development Planning/Head of Bappenas v Remarks from Deputy Minister for Natural Resources and Environment, Bappenas vii
Table of Contents viii
List of Figures x
List of Tables xi
Acronyms and Abbreviations xii
1 Introduction 1
2 Background 3
2.1 Rationale 8
2.2 Projection of Electric Power Supply and Demand in Java – Bali System 6
3 Problem Statement and Objectives 15
3.1 Problem Statement 16
3.2 Overall Objectives 18
3.3 Special Objective 18
4 Methodology 19
4.1 Output and Activities 22
4.2 Project Approach 22
4.2.1 Impact of 3Es on Emissions 23
4.2.2 Three Pillars of Climate Policy 24
4.3 Development of Scenarios for Reduction of CO2 Emission 24
4.4 Needs for Predictable Carbon Value 25
4.5.1 Clean Coal Technology 32
4.5.2 Geothermal and Other New and Renewable Sources 35
5 Power System Modeling 43
5.1 ESE and Its Working Team 44
5.2 Model Development Targets 44
5.3 Stages of Model Development 44
5.4 Model Scenarios 45
5.5 Base-case Scenario Results 46
5.6 RUPTL Scenario Results 49
5.7 Results from the Total Carbon Emission Cap Scenario with New Technology and with or without NPP 51
5.8 Carbon Value Scenario Results 56
6 Carbon Mitigations in Java – Bali Power System 59
6.1 Policy Related Issues 62
7 Conclusions and Recommendations 65
LiST Of fiGURES
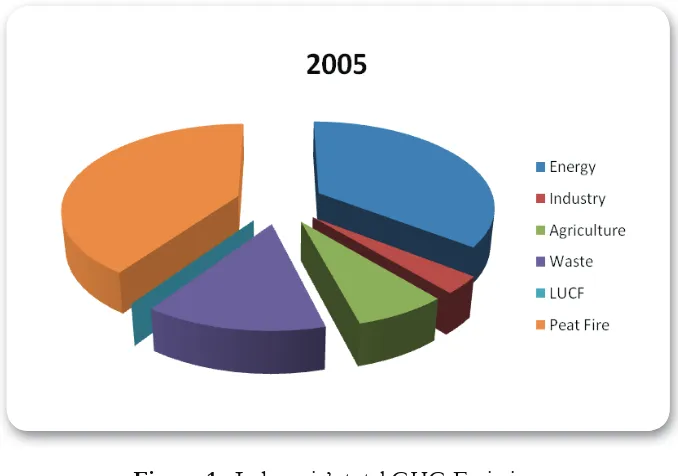
Figure 1 Indonesia’s total GHG Emissions 6
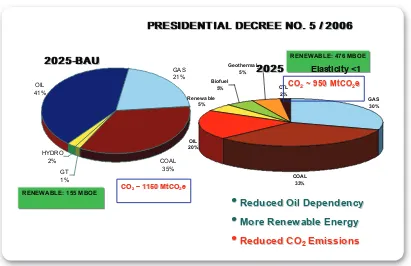
Figure 2 Target of National Energy Mix 2025 7
Figure 3 Estimated CO2 emission for each type of fuel in Indonesia’s power sector 14
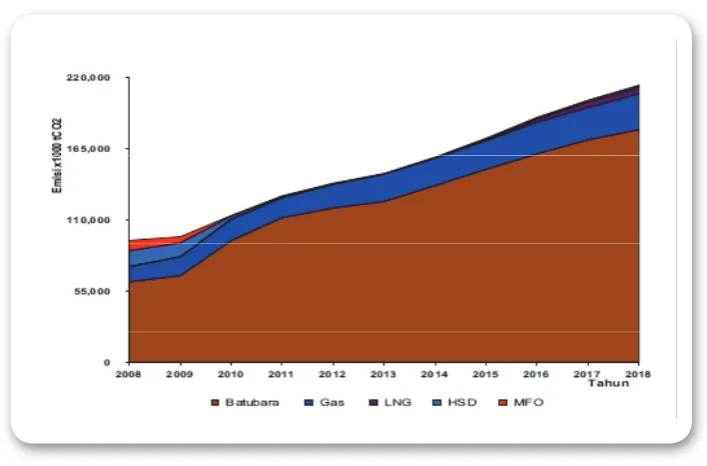
Figure 4 Java – Bali system’s CO2 emission in power sector for each type of fuel 14
Figure 5 GHG Emissions by Sectors in Energy Sector 17
Figure 6 Estimated GHG Emissions from Fossil Fuels 17
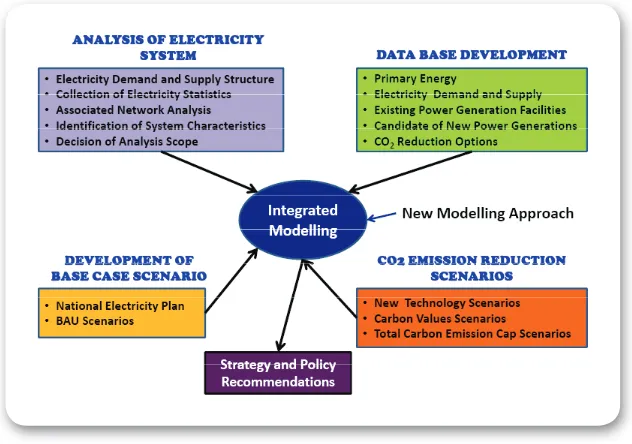
Figure 7 Integrated Modeling for Power Sector Scenarios 20
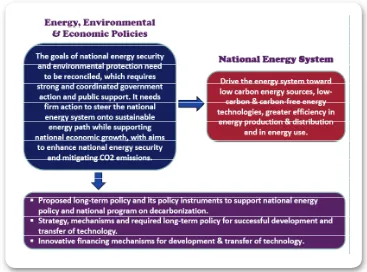
Figure 8 Relation between Energy, Environmental and Economic (3Es)
Policies on National Energy System 23
Figure 9 Three (3) Pillars for Supporting the Climate Policy 24
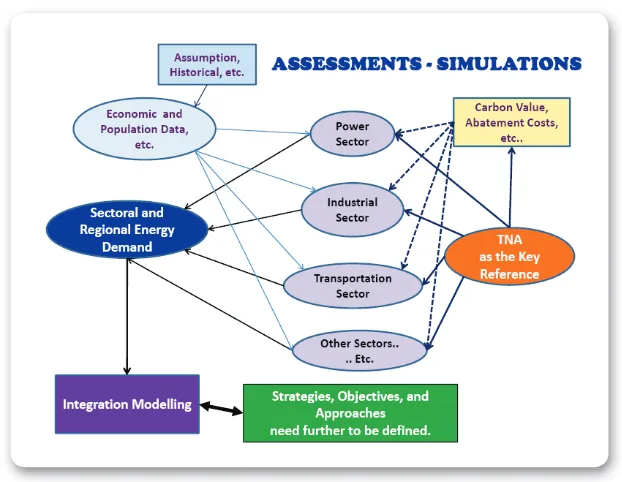
Figure 10 Simulation process in the Integrated Modeling for C02 Emission Reduction
Scenarios in Energy Sector 25
Figure 11 Scenario of Carbon Value Introduction if Carbon is not the Main Driver 26
Figure 12 Scenario for Low or Zero Carbon Value 27
Figure 13 Scenario for Low or Zero Carbon Value 27
Figure 14 Schematic Diagram of CCS Technology 33
Figure 15 Areas with CCS Potential in Indonesia 34
Figure 16 Potential of Vegetable Oil Yield 38
Figure 17 ESE and Its Working Team and Their Expertises 44
Figure 18 Calculation of CO2 Emissions Reduction in Integrated Model 48
Figure 19 Base-case Scenario Results 49
Figure 20 RUPTL Scenario Results 51
Figure 21 Total Carbon Cap without NPP Scenario Results 53
Figure 22 Total Carbon Cap with NPP Scenario Results 54
Figure 23 Carbon Value set at USD 25/tCO2 Scenario Results 57
LiST Of TAbLES
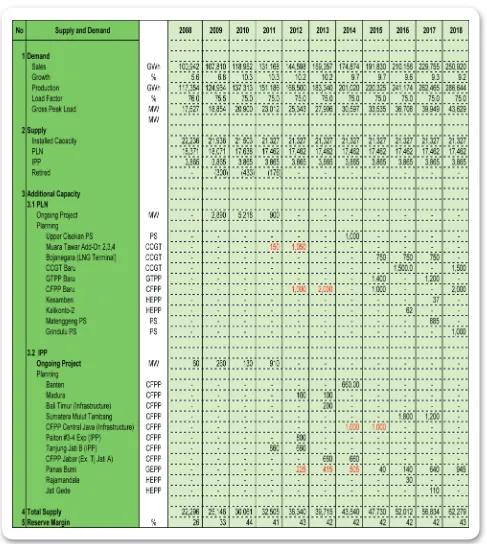
Table 1 Electric Power Balance of Java – Bali System 10
Table 2 Fossil Energy Reserves and Production in 2008 31
Table 3 Non-Fossil Energy Reserves and Installed Capacity in 2008 31
Table 4 Costs of Various CCS Components 34
Table 5 Evolution of Biofuels 38
Table 6 Requirements for Biodiesel Utilization 39
Table 7 Requirements for Bioethanol Utilization 40
Table 8 Proposed Scenarios for Power Sector 46
Table 9 Basic Assumptions for the Simulation 47
Table 10 Implications of Carbon Value for Fuel Price 56
ACRONyMS AND AbbREviATiONS
BAPPENAS Badan Perencanaan Pembangunan Nasional (National Development Planning Agency)
BAT best available technology
BAU Business-as-Usual
bbl barrel or “blue barrel”as set by Standard Oil, of 42 gallons
boe barrel of oil equivalent
C carbon
CBM coal-bed methane
CCS carbon capture and storage
CCT clean coal technology
CDM clean development mechanism
CER certiied emission reduction
CFBC circulating luidized bed combustor
CO2 carbon dioxide
COP Conference of the Parties
CTL coal-to-liquids
DGEEU Directorate General of Electricity & Energy Utilization
DGMCG Directorate General of Minerals, Coal & Geothermal
DSM demand side management
ECBMR enhanced CBM recovery
EGR enhanced gas recovery
EIA Energy Information Agency, US DOE
EOR enhanced oil recovery
ETS Emissions Trading Scheme
GHG greenhouse gas
GoI Government of Indonesia
GTZ Deutsche Gesellschaft fur Technische Zusammenarbeit (German Technical Cooperation)
GWe Gigawatts electric
GWh Gigawatt hours
IEA International Energy Agency
IEA CCC IEA Clean Coal Centre
IEEE Institute of Electrical and Electronics Engineers
IGCC integrated gasiication and combined cycle
IPCC Intergovernmental Panel on Climate Change
KNI – WEC Komite Nasional Indonesia (Indonesian Member Committee) - WEC
LEMIGAS Pusat Penelitian dan Pengembangan Teknologi Minyak dan Gas Bumi
LNG liqueied natural gas
LOLP Los-of-Load probability
LULUCF land-use, land-use change and forestry
MARKAL market allocation
MEMR Ministry of Energy and Natural Resources, Republic of Indonesia
ME Ministry of Environment
MMBTU million British Thermal Units
MMSCFD million standard cubic feet per day
Mt million tonnes
MtCO2 million tonnes of CO2
MWe Megawatts electrical
NAMAs nationally appropriate mitigation actions
N2O Nitrous Oxide
NPV net present value
OECD Organization for Economic Co-operation and Development
PC pulverized coal
PF pulverized fuel
Pertamina Perusahaan Minyak & Gas Nasional (State-own Oil & Gas Company)
PGN Perusahaan Gas Negara (National Gas Company)
PKUK pemegang kuasa usaha ketenagalistrikan
PIUKU pemegang ijin usaha ketenagalistrikan untuk kepentingan umum
PLN Perusahaan Listrik Negara (State-own Electric Power Company)
ppm parts per million
R&D research and development
R, D & D research, development and demonstration
RE renewable energy
REDD reducing emissions from deforestation and degradation
RPJM rencana pembangunan jangka menengah (medium-term development plan)
RPJP rencana pembangunan jangka panjang (long-term development plan)
RUKN Rencana Umum Ketenagalistrikan Nasional (National Electricity General Plan)
RUPTL Rencana Umum Penyediaan Tenaga Listrik (Electricity Supply Master Plan)
SO2 sulfur dioxide
SOx sulfur oxides
TCF terra cubic feet
TNA Technology Needs Assessment
UCG underground coal gasiication
UN the United Nations
UNFCCC United Nations Framework Convention on Climate Change
US DOE United States Department of Energy
WASP Wien Automatic System Planning model
WEC World Energy Council
BAPPENAS, the Indonesian National Development Planning Agency, formally recognized Climate Change as a major threat to mid- and long-term development in December 2007 when it issued the National Development Planning: Indonesia Responses to Climate Change (Bappenas (2008). This report
was the i rst attempt in Indonesia to integrate adaptation and mitigation of climate change into National
Development Planning Policies. This document was designed to bridge between The National Action Plan On Climate Change and the 5 year mid-term national development plan 2010-2014 (Bappenas
(2009). It placed special focus on funding forestry, energy efi ciency, food security, infrastructure and
2.1 Rationale
Global climate change is an issue that can no longer be ignored. On the global stage, this issue has
been signiicantly propelled by the writings of Nobel Laureates Al Gore, former Vice President of the
USA (Al Gore (2006)) and Steve Chu, currently the Secretary of US DOE (Kevin Conley (2009)). U.S. President Barack Obama declared to the United Nations General Assembly on 22 September 2009 that the US is a serious partner in combating global warming (Jakarta Post (2009)). Many related publications are available from numerous organizations, government agencies and so on, including the World Energy Council (WEC, 2007), Thomas Friedman (2008), Mark Lynas (2008), Michael Levi (2009), Wallack and Ramanathan (2009), Clifton Anderson (2009), PEW Center on the States (2006) and Michael Lemonick (2008).
Thomas Friedman, for example, explained how global warming, rapidly growing populations, and the astonishing expansion of the world’s middle class through globalization have converged to produce a
planet that is “hot, lat, and crowded”. Already the earth is being affected in ways that threaten to make it
dangerously unstable. Mark Lynas, in his book published by the National Geographic Society illustrates
how an increase by even one degree will have signiicant consequences for this blue planet. One of the
earliest and most important impacts will involve the accelerated melting of Arctic ice, as has been noted by McKenzie Funk (2009), James Gamble (2009), and Fred Pearce (2009). Potential future impacts of
Arctic melting have been modeled by Schmidt and Wolfe (2009) and McGufie and Henderson-Sellers
(2005), among others. The potential impacts of climate change on national economies have been reviewed by Lord Stern in his seminal publication (Stern Review (2006)) and by Lester Brown (2001).
In responding to the above concerns and in the context of national development planning priorities, the
GoI has decided to focus the irst tranche of response measures d on a small number of priority sectors.
These so called “priority sectors” are divided into mitigation and adaptation priorities. For mitigation, the priority sectors are: (a) energy and mining; and (b) forestry. With respect to adaptation, the priority
sectors are: (a) agriculture; and (b) coastal areas, small islands, marine life and isheries.
In order to reduce GHG emissions from the energy sector, Indonesia needs to properly address its heavily reliance on fossil fuels such as oil, coal and natural gas, that are primary contributors to CO2 emissions. However, the GHG emissions from Indonesia’s energy sector must be managed carefully as this sector is of crucial importance to the Indonesian economy, responsible both for earning export/
foreign exchange (forex) revenue and for fulilling the need for domestic energy. In the past, the GoI
has placed its emphasis on forex revenue, but since the beginning of the present decade, the GoI has shifted the emphasis of national energy policy towards meeting Indonesia’s demand for energy. In reality, however, the contribution of the energy sector to the state budget has been steadily decreasing. In 2008, the energy sector contributed IDR 346.35 trillion to the total state budget and revenue of IDR 962.48 trillion, according to the Minister of Energy and Mineral Resources in his end of the year press conference (Bisnis Indonesia (2008)).
Indonesia’s total annual GHG emissions of the three major gases, CO2, CH4 and N2Owas equivalent in 2005 to about 670 million ton of CO2 (MtCO2e) without LULUCF, or about 1120 MtCO2e if one includes
peat ires but not LUCF (deined as NE). Meanwhile, in 2005, Indonesia’s energy sector emitted at a level
Figure 1 : Indonesia’s total GHG Emissions Source: Table 1b, SNC 2009
This ministerial commitment to emissions reductions was reinforced by President Susilo Bambang Yudhoyono in his address on climate change issues to the G-20 Summit in September 2009. President SBY explained that the implementation of Indonesian energy policies, including those related to LULUCF, would reduce the nation’s aggregate emissions by 26% by 2020, relative to a Business-as-Usual (BAU) scenario. If adequate international support is made available, Indonesia would increase its national target, aiming to reduce annual GHG emissions to as much as 41% below the BAU scenario. Indeed President SBY emphasized that these emission reduction targets are achievable because most
of Indonesia’s emissions come from forest related issues, including forest i res and deforestation (SBY
(2009)). Fortunately, Indonesia’s energy resources are quite diverse and the reserves available from
non-fossil fuel-based energies are signii cant. These clean energy resources present an opportunity for
Indonesia to develop its national economy along a low-emissions pathway as the nation moves into the future.
As stipulated in Presidential Decree no. 5, Year 2006 (illustrated in Figure 2 below), the share of coal in
energy consumption will increase from about 15% in 2006 to approximately 33% by 2025. (This i gure rises to 35% if one includes the 2% of primary energy that is expected to be derived from liquei ed coal.).
Figure 2 : Target of National Energy Mix 2025
Indonesia’s level of primary energy consumption is expected to grow, reaching around 3 billion BOE in 2025. This is projected to result in emissions of around 1150 MtCO2e in the BAU scenario or around 950 MtCO2e, if the Presidential Decree is fully implemented. Reducing GHG emissions by around 16%
by 2025 will be difi cult unless Indonesia can increase the share of renewable energy in the national
primary energy mix. Indeed Figure 2 indicates that the non-fossil energy in 2006 is barely about 4.5% and must be increased to around 17% to meet the Presidential target. (The Presidential Decree implies that geothermal energy contributes 5%, renewable energy 5%, CTL 2% and biofuels 5% in 2025.)
On this crucial climate change issue, the UNFCCC has emphasized that all member parties should incorporate considerations of climate change into national development planning, each in accordance with its national sustainable development agenda. Indonesia has responded by formulating the national development planning document on climate change that covers multiple sectors and ensures horizontal as well as vertical coordination of the national development planning process.
As a matter of course, in Indonesia this process will be prepared and managed by Indonesia’s national development planning agency (BAPPENAS). Impacts arising from gradual climate changes need to addressed and immediately anticipated by formulating suitable spatial plans. A robust policy framework will be put in place to integrate climate change into spatial planning at both the national and local levels. The development of cross-cutting policies on climate change, and their incorporation into spatial plans will help to integrate consideration of climate into the development of sectoral policy (Bappenas (2008)).
In Indonesia, the energy sector consists of four major sub-sectors, namely transportation, industry, electric power and commercial and residential. In the sections that follow, this report describes a study, undertaken jointly by Energy Experts and BAPPENAS, to consider the issues for comprehensive GHG mitigation in Indonesia’s electric power sector. However, the scope of this report is limited due to the following constraints:
1. Limited time period of study of 6 months (and limited availability of funds);
2. Transportation, residential and commercial sectors are to some extent, very broad and require more time and resources to analyze; and
3. Industry, in principle, is very similar to the electric power sector in the sense that is composed of large centralized demands, but the limited time and resources available during the time period of study precluded the inclusion of the industry sector in this analysis.
2.2 Projection of Electric Power Supply and Demand in Java – Bali System
Sustaining a reliable and well distributed electricity supply requires a comprehensive and nation-wide power system planning process. The Rencana Umum Ketenagalistrikan Nasional (RUKN), so called National Electricity General Plan (DGEEU (2008)) can be considered as a general policy on integrated electricity supply for the country. This plan covers the demand and supply forecast, investment and funding policies, and directive measures on primary energy as well as renewable energy and other new energies utilization plans for the power sector.
RUKN is intended to be used as a guideline for the future development and construction of Indonesia’s power sector by the Government of Indonesia (GoI), local government, Pemegang Kuasa Usaha Ketenagalistrikan (PKUK) and Pemegang Izin Usaha Ketenagalistrikan untuk Kepentingan Umum (PIUKU). The role of RUKN becomes increasingly critical in the face of constantly changing conditions at the local, national, regional and global levels.
Table 1 : Electric Power Balance of Java – Bali System
Source : RUPTL PT PLN (Persero) 2009-2018
can be used as guidance in developing Indonesia’s future power system under the guidance of PT PLN (Persero)’s RUPTL.
Besides the Java – Bali System (JBS), the RUPTL covers another four regions of the country, namely the Sumatera, Kalimantan, Sulawesi and Nusa Tenggara-Maluku-Papua systems. The other four regional systems are referred to simply as Outside JBS. In preparing the power sector development plan=for RUPTL, there are some important assumptions and parameters that have been adopted as the general policies. For the power generation sector, this study will cover:
1. Sales and demand growth; and
2. Development of power generation capacity.
During the period when PT PLN (Persero) is still unable to supply all electricity demand, sales growth is limited by the available and capable generating capacity. For the years 2008 and 2009, the capability to supply demand is still under generation constraint due to the delay in constructing some power plants under the program called “Accelerated 10,000 MW Program, phase I”. Sales growth during this period is targeted at 6.5% for 2008 and 7.5% for 2009. On the demand side, the policies for demand side
management (DSM) and energy eficiency have not been considered yet in the system planning of
RUPTL 2009 – 2018.
The policy on development of generation capacity is based on the principle of least cost of power generation while maintaining the expected level of system reliability. The lowest generation cost is identiied by
minimizing the net present value of all electricity generation-related costs, such as investment, fuel, operation & maintenance, and idle capacity costs. The reliability constraint is established on the basis of the principles of Loss of Load Probability (LOLP) and Reserve Margin. Rental power generation and excess power supplied by others are excluded from the system planning.
Nevertheless, in line with the government policy to develop and utilize renewable energy resources in the areas where these sources are available= the least cost criterion may be partly or even completely ignored. In those areas, the development of geothermal and hydropower may enter into the mix of power system supplies despite their higher development cost compared to conventional thermal power plants.
Based on these general policies for system development, a capacity expansion plan for system development can be prepared so as to obtain reliable power generation during a certain period of time, simultaneously
meeting the criteria of least cost on NPV and expected reliability. The least cost coniguration is achieved
Alternatively, a linear programming approach has been successfully used in the country’s energy planning based on MARKAL model. An alternative projection model that can be used for analyzing capacity expansion plans designed to meet long-term electricity demand has been proposed by Zuhal (Zuhal (1994)). Zuhal’s approach, based on Multi-objective Liner Optimization, and his model is called the Zuhal Optimization PLANning Model (or ZOPPLAN) However, in the Indonesian case, this multi-objective linear programming-based optimization, seems to be unable to handle the dynamics and complexity of the national power system and is not able to represent accurately known supply and demand behavior in the national system.
In terms of the reliability constraint in this analysis, the LOLP for the Java-Bali system has been set at < 0.274%, which is equivalent to a loss of load of 1 day per year. This means that the probability that the peak load exceeds the installed capacity is less than 0.274% and that the system experiences major unscheduled outages not more than 1 day per year.. The estimation of generation capacity needed to meet this LOLP criteria results in an estimate of the required system reserve margin. This calculation depends on the expected availability of each generation unit, the number of units in the network, the capacity of each unit and the fuel type of each unit. For JBS, at LOLP < 0.274%, it gives a reserve margin > 25 – 30% based on expected net available capacity. If it’s based on the total installed capacity, the reserve margin may reach around 35%. For outside JBS, with the same arguments, the necessary reserve margin is around 40 – 50% due to the limitation on the number of units available, the derating of available power generation capacity, and continuing uncertainty about the timing of completion for many of the IPP projects.
For reliability analysis using the WASP model, renewable energy technologies like geothermal and
hydropower are considered to be ixed or “must run” systems in the system simulation and optimization.
This means that they must be included in the system dispatch plan, whenever these renewable resources are available. For JBS, the thermal power generation systems that are considered in the simulation and optimization process include a supercritical PC power plant of 1,000 MW and subcritical plants of
600 and 300 MW; a combined cycle Gas Turbine of 750 MW; one LNG-ired CCGT of 750 MW; and an oil-ired, open-cycle Gas Turbine of 200 MW. In addition, the representation of JBS includes one
geothermal plant of 55 MW and one hydropower pumped storage facility of 250 MW. For outside JBS,
the thermal power candidates include Pulverized Coal- ired power plants of 200, 100, 50 MW and
smaller sizes; as well as a CCGT whose operational rating depends on the volume of natural gas that is available to supply the turbine.
and Investor Daily (2009)). Despite the omission of CO2 emission as a cost factor, it is not totally ignored
in the RUPTL. It could be relected by the inclusion of several additional candidate geothermal and
hydropower plants that can be “forced” to be part of power generation mix in RUPTL, even though they violate the least cost criteria. The introduction of supercritical boiler in JBS is another example of a possible measure that could be taken by PT PLN (Persero) to reduce the emission of CO2 in their power generation mix in RUPTL. The results of this interpreted emission of CO2 for the national power system under RUPTL is illustrated in Figure 3.
As shown in Figure 3, national emissions of CO2 from power generation will increase from 116 million MtCO2 in 2009 to around 270 million MtCO2 by 2018. Of those 270 million MtCO2, about 228 million MtCO2 (84.5%) is originally emitted by coal-ired power plants. The average grid emission factor for Indonesia in 2009 was around 0.787 kgCO2/kWh, which shall be improved by about 6% in 2018, to around 0.741 kgCO2/kWh.
For JBS, the situation is as shown in Figure 4 below. The emission of CO2 from power generation will more than double, increasing from about 94 million MtCO2 in 2009 to around 213 million MtCO2 in 2018. The average grid emission factor for JBS in 2009 was around 0.798 kgCO2/kWh, which shall be improved by almost 7% in 2018, to around 0.744 kgCO2/kWh. The improvement of the emission level in JBS will be achieved through the increased usage of natural gas (including LNG), geothermal and
supercritical boilers for coal-ired power plants.
Figure 3: Estimated Indonesia’s CO2 emission for each type of fuel in power sector Source: RUPTL PT PLN (Persero) 2009-2018
Problem Statement
and Objectives
3.1 Problem Statement
As mentioned above, this study will only cover the electric power sub-sector. The GHG emissions from energy consumption in 2005 as shown in Figure 1 can be further categorized into 5 main sub-sectors as described in Figure 5 below. The contribution of the three fossil energy resources to GHG emissions is illustrated in Figure 6 and shows that coal’s share of electricity-related CO2 emissionsis steadily increasing during the period of projection. Thus, to reduce or at least to maintain the level of CO2 emissions, special
attention must be focused on coal use in the power sector. Commencing in 2010, some new coal-ired
power plants come online as part of the Accelerated 10,000 MW Power Program -- Phase I. Although the upcoming Accelerated 10,000 MW Power Program -- Phase II will accommodate more renewable energy,
especially geothermal power plants, the contribution of coal-ired power plants to electricity-related CO2 emissions is expected to rise. Therefore, if there is no speciic measure applied to the development of those coal-ired power plants, such as a requirement for the usage of supercritical boiler and/or the
introduction of carbon capture and storage (CCS), the aggregate level of CO2 emissions from the electric power sector will surely increase in the years ahead.
Indeed, the government has tried to prepare a scenario based on the Presidential Decree on Energy Mix through its Master Plan of National Electric Power (RUKN) 2008-2027 (DGEEU (2008)) and the PT PLN (Persero)’s RUPTL 2009 – 2018 (PT PLN (Persero (2009)). Unfortunately, in particular in the RUPTL, the projection of future capacity expansion requirements is based on minimizing NPV without consideration of any cost attributed to CO2 emissions. Therefore, in anticipating the target of at least 17% reduction on GHG emissions in energy sector by 2025 as advised in G-8 Environment Ministers meeting in May 2008 (IEA (2008)page 64 and Jakarta Post (2008)some carbon value should be incorporated into the scenario to be compared to BAU scenario. Note that the base-case scenario shall follow the baseline
deinition as deined in several glossaries, such as IPIECA 2007, UNFCCC Resource Guide or IEA 2006
Figure 5:GHG Emissions by Sectors in Energy Sector
Source: Handbook of Energy and Economic Statistics of Indonesia 2006.
3.2 Overall Objectives
The objective of this study is to develop a strategy for mainstreaming climate change issues into Indonesia’s power sector, and along with its primary energy supplies into the national development plan. Achieving this objective will require coordination, synergy, monitoring and evaluation based on the scenarios proposed and prepared by the ESE team, which consists of several energy related experts and system simulation developers.
3.3 Special Objective
This report describes a study designed to consider the issues related to comprehensive GHG mitigation in the power sector of the Republic of Indonesia. In designing this study, emphasis was placed on the
identii cation of the optimal technology and policy portfolios for CO2 mitigation, using the existing l eet of coal-i red power plants within the RUKN and RUPTL. The current status of the power plant mix is described, as are the existing plants. Under a base-case scenario that has been coni gured to minimize
the NPV of all electricity production-related costs, the expectation is that power generation will be
dominated by the use of coal-i red power plants, augmented by some use of natural gas-i red power
plants plus a small proportion of renewable energy technologies.
However, with increasing international pressure to control and reduce CO2, and in particular with the sudden jump in coal consumption in the power sector due to the Accelerated 10,000 MW Program Phase I and portion of Phase II, it seems likely that GoI will choose to adopt a different approach. An extensive modeling exercise was therefore undertaken to examine the impact of various policy measures
on future capacity expansion planning decisions in order to achieve signii cant CO2 emissions reduction. In this study, ESE with the support of the power sector team of the Roadmap, proposed to conduct Integrated Modeling for Power Sector under Climate Change constraint, as shown in Figure 7 (Hardiv Situmeang (2009)). A similar study has been completed for the Korean Electric Power Research Institute (KEPRI) in April 2008 (Andrew Minchener (2008)). Therefore, this study will be the second of its kind
but with many signii cant differences that rel ect the contrasting nature of the energy supply systems in
Indonesia and Korea. The latter heavily depends on exported fossil-based fuels for its power sector, such as coal and LNG, while the former consumes its local resources such as coal and to some extent natural gas. In Indonesia, while oil-based fuels constitute the higher fuel cost of about 67% of the electric utility company operational costs, they only contribute about 30% of the total electric energy generation.
The results obtained from this model projection will constitute the power sector scenarios and the basis for recommendations to assist GoI in establishing a sustainable energy portfolio within the power sector. The major targets of the integrated model are as follows:
• To build up the basis for the analysis of the CO2 emissions reduction potential in the power sector;
• To assess sustainable approaches to CO2 emissions reduction that can be introduced into Indonesia’s power sector;
• To investigate the effects of the several proposed scenarios for CO2 emissions reduction; and
• To provide advice on strategies and policies for cost-effective CO2 emission reduction in power sector.
Due to the scope of works to be covered in this study, the study was divided into the following sub-studies:
1. Power Sector and its Primary Energy Supply Roadmap for Java-Bali System (JBS)
2. Power Sector and its Primary Energy Supply Roadmap for Outside JBS
Each sub-study is basically equivalent in weighted assignment despite the fact that majority of power generation plants are in JBS. However, the primary energy sources are predominantly available in Outside JBS. Each sub-study shall be concluded within 3 (three) months of allowable period time.
During each period of sub-studies, at least two Focus Group Discussions (FGDs) were conducted by ESE and the team. Each FGD was facilitated by BAPPENAS and accommodated by GTZ.
The FGDs have been convened in June, July, August, September and October 2009. A Steering Committee meeting was held in September 2009to enable the completion of this Final Report for JBS in October
2009. This report has been reviewed and inalized in October 2009. A similar approach was used for the
Outside JBS study, and the Final Report was submitted in mid-November 2009.
During the Steering Committee meeting on 8 September 2009, the MEMR presented the climate-change
related program and activities that have been proposed to fulill the need for CO2 emissions reduction in the power sector. Some of those activities/programs are listed below (Secretary General MEMR (2009)):
Launching of Second 10,000 MW Accelerated Program which mainly depend on renewable resources such as geothermal and hydropower;
1. Promoting the use of energy saving lamps;
4. Developing city gas;
5. Converting kerosene-to-LPG program;
6. Establishing mass transport system which depend on natural gas vehicle, such as gaseous-fuel busway;
7. Developing energy self-sustainable village which taps local potential renewable resources such as wind, solar, and biomass; and
8. Reducing the gas laring (which will be part of the study prepared by the ESE team).
4.1 Output and Activities
Based on the integrated model, modiication will be performed as well on the objective function of the
power generation optimization method. The least-cost NPV was constrained as well by the carbon value, an emerging challenge (or may be said as opportunity). This inclusion determines the scenario that is best-suited to meet the selected GHG emissions cap, technology, fund, and carbon values. The options to be covered include:
• A base-case scenario;
• A RUPTL scenario
• A scenario based on a sector-wide cap on total CO2 emission with new technology and with/ without NPP scenario; and
• A carbon value scenario.
4.2 Project Approach
The project was designed to consider the impact of internal and external factors on the viability of the various options for power generation technology introduction, with an emphasis on the potential for reduction of CO2 emissions in the power sector. The RUPTL 2009 – 2018 has already included some interventions from the Government policies, either on the national energy mix policy and the two fast
track accelerated programs of 10,000 MW, so despite the lack of a speciic CO2 emissions cap, it cannot
be considered as the base-case scenario. Therefore, the base-case scenario shall be irst established using the constraints as deined in IPIECA 2007, UNFCCC Resource Guide or IEA 2006 prior to mainstream
The approach adopted was to quantify the current power plant status, determine the likely increases in capacity demand for a range of scenarios and then to consider the likely energy mix and technologies required to ensure that such demand could be provided on a sustainable basis. From this position, the outcomes were analyzed and recommendations made.
4.2.1 Impact of 3Es on Emissions
To be successful in reducing GHG emissions, the relation among Indonesia’s Energy Security, Economic
Growth and Environment Protection (3E) objectives must be put into an integrated equation that rel ects the ultimate objective of sustainable development. The importance of the i rst two factors and the
relationship between these factors has been recognized for decades -- even for Indonesia -- as expressed by the current Minister of Energy and Mineral Resources (Purnomo Yusgiantoro (2000)). The schematic interaction amongst those three aspects is illustrated in Figure 8 (Hardiv Situmeang (2008)) below.
The importance of the 3E factors is undeniable, in particular in the current era of changing climate and shrinking economies. In this period, Malthusian limits to growth are back – and squeezing us painfully, both as global citizens (Robert Engelman (2009)), and locally amongst Indonesian citizens. Whereas more people once meant more ingenuity, more talent and more innovation, nowadays it just seems to mean less for each, and it’s applied to Indonesia as well which its population is now the fourth in the world and steadily increasing.
4.2.2 Three Pillars of Climate Policy
Recognizing these three aspects of sustainable development, the pillars for Indonesia’s Climate Policy shall be established in order to ensure the GHG emissions reduction. The pillars are illustrated in Figure 9 (Hardiv Situmeang (2008)) below, as follows:
1. Carbon Pricing;
2. Technology Policy; and
3. Regulation Information
The i rst two pillars above will be depicted in more detail in the following sections, including
sub-section 4.4 on the needs for predictable carbon pricing and sub-sub-section 4.5 on the needs for cleaner fossil fuel system.
Figure 9:Three (3) Pillars for Supporting the Climate Policy
4.3 Development of Scenarios for Reduction of CO2 Emission
To identify GHG emissions reduction potentials in the Energy Sector, we have used the framework illustrated in Figure 10 (Hardiv Situmeang (2008)) below. Blending historical assumptions based on economic, population data, and so on, with carbon value (pricing) and abatement cost estimates, with the results of Indonesia’s Technology Needs Assessment (TNA) (GoI (2009)), the requirements of the
energy sector can be dei ned. Energy consumption can be divided among transformational activities
in Figure 10 below.
Furthermore, based on this integrated modeling, the Power Sector projection can be assessed through some iterative simulations in order to identify the proposed strategies, objectives and approaches that
need to be further dei ned through some FGDs.
Figure 10:Simulation process in the Integrated Modeling for C02 Emission Reduction Scenarios in Energy Sector
4.4 Needs for Predictable Carbon Value
As stated in the previous sub-section, one of the pillars of climate policy is Carbon Value. We note that
it is difi cult to implement a systematic climate policy without putting an economic value on carbon to
stimulate the emission reduction. In this context, Indonesia recognizes that climate change can only be
properly addressed by allocating specii c funding to efforts to reduce the CO2 emission. In the past, government activities targeting climate change were embedded into traditional development programs,
with no specii c national budget allocated to climate change; funding was instead mainstreamed into
existing programs. Fortunately, the GoI now recognizes the need for carbon value which was proposed in the Blue Print of National Energy Management 2010-2025 and launched in 1 April 2009. In the Development Program, the GoI stipulated in its Main Program no. 4 that a Carbon Tax will be gradually applied so as to promote clean energy development (MEMR (2009)). In the power sector, the government
recognizes that the sales of certii ed emission reduction (CER) from new and renewable energy, carbon
However, with existing pressures on the state budget, it may be unrealistic to rely totally on domestic resources to fund climate change-related activities. . International support will play a key role in enabling Indonesia to develop and implement climate change programs while avoiding an economic downturn
and addressing the impacts of climate change. Nevertheless, this external cooperation and i nancing
needs to be prepared appropriately and properly managed.
With regard to the external funding, Indonesia prioritizes grant utilization to i nance climate change
programming. Grants to fund climate change activities can originate directly from bilateral or multilateral
donors or via a trust fund. Loan resources can be utilized when grant funding is insufi cient. However, the utilization of loans should be the last alternative for Indonesia’s climate change i nancing. Having
relying on and assessing such external funding for the climate change issue, in particular to attract as well
the participation of private sector, another approach shall be dei ned.
In this circumstance, the CO2 emissions can be discouraged by introducing a penalty mechanism, which is by represented by a carbon value incorporated into the capacity expansion planning scenario. In this scheme, the CO2 emissions will be rel ected by introducing a cost penalty for each power generation option that is to proportional to its its rate of CO2 emissions. With this approach, the emitter can predict the carbon value that it would like to reduce in order to reduce or eliminate the cost of the carbon emission penalty. The impacts of carbon values on driving forces in the scenarios are shown in the following Figures 11 and 12 (Hardiv Situmeang (2008)), though there are many other scenarios have been proposed in the literature, for instance, (Sonia Labatt and Rodney White (2007), Joel Makower (2009), Chris Mooney (2009), Auden Schendler (2009), and Richard Asplund (2009)).
In the scenario shown in Figure 11, the investors and i nancial institutions (i.e., the lenders) may provide i nancial aid to develop a non-core CO2 emission project. Without such i nancial aid, the non-core project will not be realized. In the scenario shown in Figure 12, the investors and i nancial institutions may provide i nancial aid to increase the viability of the CO2 reduction-related project.
Figure 12:Scenario for Low or Zero Carbon Value
Without such i nancial support, the carbon price will be too low, and the project may not be viable. The bottom line is that i nancial assistance is needed to create a predictable carbon value such that an
emissions-reducing investment can be realized. On the global level, the scenario for carbon value introduced into a certain project with carbon credit component may be represented as shown in Figure 13 below.
4.5 Needs for Cleaner Fossil Fuel Systems
In order to reduce GHG emissions while maintaining the reliable electricity supply needed to support national economic development, in light of the relationships among Energy Security, Environment
Protection and Economic Growth (3E) , selection of technology- speciic criteria are needed to guide
both supply side and demand side analyses. For this study however, the emphasis is on the electricity supply side technology selection, in particular on power generation, as the main source of CO2 emissions. In the case of electricity supply by PT PLN (Persero), high priority in selection of power generation technology to support the CO2 emissions reduction is given to the followings:
1. Advanced coal technology / clean coal technology;
2. Geothermal technology; and
3. Biomass technology, in particular for direct combustion and co-iring applications.
Those technologies are selected due to their ability to support the current government policy, to enhance the utilization of coal in power generation to replace diesel and marine fuel oils up to 2025, and to increase diversity of primary energy supply by expanding the use of renewable energy resources to generate electric power while enhancing national economic development (GoI (2009) and MEMR (2009)). Nonetheless, burning more coal will create large increases in emissions of CO2 and other air pollutants.
Since 1990, Indonesia has become the world’s second largest coal exporter, with about 80% of produced
coal being shipped for consumption by coal-ired power plants mostly in the Far East region. The
remaining 20% of local production is consumed in the domestic market. Therefore, reducing and/or offsetting emissions from the power sector should become a main consideration in national energy policy. This situation makes more urgent the need for new extraction and consumption technology. If successfully deployed, innovative technologies could enable the expanded use of coal by gasifying it underground and thus reducing coal’s carbon emissions; or they could allow coal to substitute for natural gas or oil-based products (William Halal (2009)). The technological options include Integrated
Gasiication with Combined Cycle (IGCC), Coal-to-Liquid (CTL), Underground Coal Gasiication
(UCG) and Carbon Capture and Sequestration (CCS) (Joel Makower, Ron Pernick and Clint Wilder (2006) and Richard Heinberg (2009)).
As the price of oil climbed during the 2007 and 2008, a hundred or more countries began to suffer, some acutely, from shortages of electricity. In many instances, blackouts occurred. due (Richard Heinberg
(2009)). This phenomenon simply relects the role of oil in world energy supply, which can’t be easily
The only reason the fall in oil prices hasn’t been deeper is that many people expect a continuing economic boom in China, fueled by Beijing’s aggressive economic stimulus plans. These days any hint of good news for China – even a slowdown in the decline of manufacturing – can unleash whoops of joy in the oil trading pits. However, there is good reason to believe that the world has just passed a turning point. The last boom in oil prices collapsed in 1979, when total spending on oil exceeded 7% of the global GDP. Last year in 2008, spending on oil hit a similar share of global GDP; and the price has since fallen by more than two thirds (Ruchir Sharma (2009)).
Most oil industry analysts expect high prices to return soon, along with economic recovery. This is probably a mistaken view. More likely, the price of oil and other commodities will be range-bound again (Edward Morse (2009)). However, a group of oil observers consider this volatility to be part of the “New
Age of Oil.” Volatility also makes it more dificult to plan future energy investments, whether in oil and
natural gas or in renewable and alternative fuels (Daniel Yergin (2009)). Yergin claims that although Cushing. Oklahoma (the gathering point for the light, sweet crude oil known as West Texas Intermediate – or just WTI), looks much the same as it did when his seminal publication The Prize (Daniel Yergin
(1992)) irst came out, the world of oil looks very different. Many talk today about having passed the inlection point of “peak oil,” after which the production of conventional oil resources are bound to
decline Paul Roberts (2005), Kenneth Deffeyes (2005) and Mathew Simmons (2005). If so, others reply, the current period will involve a very long “goodbye.”
Either way, this new oil age has developed a split personality – with oil viewed both as a physical commodity
and also as a inancial asset Jeff Rubin (2009).Some even suggest that oil pricing will be a tactical element
in a new form of global economic warfare (James Norman (2009)). Three deining characteristic of the
new age of oil are:
1. globalization of the demand for oil, a vast shift from even a decade ago;
2. rise of climate change as a political factor shaping decisions in the future on how people use oil, and how much of it,; and
3. a global drive for new technologies that could dramatically affect oil along with the rest of the energy portfolio.
In the case of Indonesia, indeed, the use of oil-based fuels (mainly HSD and MFO) have not deserted the annual budget of PT PLN (Persero) despite its contribution of about 30% to electricity production, as it
absorbs almost 70% of the total annual fuel costs of this power company. Fuel diversiication has become essential and there are two strong candidates for the diversiication of primary energy supply, namely,
utilization, despite their huge potentials and obvious capability to reduce CO2 emission, are the lack of
infrastructure support, regulation, and inancial incentives.
Nonetheless, natural gas offers clear advantages over other fossil fuels. It burns cleaner than coal, and emits only 50 percent as CO2 per unit of heat supplied. Environmentalists have tended to prefer natural gas to other fossil fuels because its combustion produces the fewest pollutants, including CO2 (Julian Darley (2004)).
The arguments in favor of using more natural gas and less coal and petroleum are, at least at irst glance, straightforward. Coal-ired power plants generate, for instance about 50% of the electricity used
in the US, but they produce 82% of the US power industry’s CO2 emissions. Natural gas is increasingly important for electricity generation and for many industrial purposes in the US, including the synthesis of chemical fertilizers. In addition, in contrast to oil, which is largely imported, domestically-supplied natural gas has inherent advantages for the United States from a national energy security perspective. These and other advantages have combined to make natural gas the second most important energy source in the US after oil.
From a technology point of view, natural gas and renewable sources, such as wind and solar, could
complement each other well. Fast-responding natural gas-ired turbines could be used to generate
electricity when the wind stops blowing or clouds block the sun. It’s also easy to substitute natural gas for gasoline or diesel fuel in cars, buses and trucks, again from a technological perspective. But the economic and political relationship between natural gas and renewable energy resources are more complicated. Using natural gas in vehicles would reduce greenhouse gas emissions, but not nearly as much as replacing coal in power generation. A natural gas car emits about 25% less CO2 than a similar gasoline-powered vehicle, but since transportation accounts for only about one-third of US GHG emissions, even switching over all the country’s vehicles to natural gas would reduce overall emissions by just 8% (David Rotman (2009)).
For Indonesia, natural gas is the second largest energy resource, accounting for about 1.7% of the world’s proven reserves. In addition, CBM has the potential to supply around 453 TCF, as shown in Table 2 (Meirios Moechtar (2009a)). The main obstacles to the utilization of natural gas are lack of pipeline infrastructure and limited logistic facilities (in the case of LNG and CNG). Several factors contribute
to the limited utilization of CBM resources including regulatory gaps and lack of detailed and veriied
Table 2:Fossil Energy Reserves and Production in 2008
FOSSIL ENERGY RESOURCES RESERVES PRODUCTION RSV/PROD RATIO (YEARS)*)
Oil 56,6 billion barrels 8,2 billion barrels 357 million barrels 23
Gas 334,5 TSCF 170 TSCF 2,7 TSCF 63
Coal 104,8 billion tons 18,8 billion tons 229,2 million tons 82
Coal Bed Methane (CBM) 453 TSCF - - -
*) Assumes no new exploration activity and no new i eld discoveries
In terms of hydropower potential, Indonesia has the 5th largest freshwater resource in the world (Meirios
Moechtar (2009b), Klaus Brendow (2009) and Tora Lohan (2009)). Recent estimates suggest a total hydropower resource potential of about 76 GWe in Indonesia. To date, however, Indonesia has been able to develop only about 4.2 GW of hydropower, as shown in Table 3 (Meirios Moechtar (2009a)). This can be compared to Brazil, which has the largest freshwater hydropower resource in the world (approximately 104 GWe), and has tapped around 77 GWe to date. The development of large-scale reservoir hydropower in Indonesia has been hindered by several constraints including limits on land clearance for reservoir
development and conl icts with existing human settlements. In the case of mini- and micro-hydropower,
the principal barriers revolve around issues of commercial viability. The complex relationship between water and energy, and to some extent environmental issues are undeniable and some illustration about it can be seen in Michael Webber (2008)and recently discussed on the blog (IEEE (2009)).
Table 3:Non-Fossil Energy Reserves and Installed Capacity in 2008
4.5.1 Clean Coal Technology
In last decade, several clean coal technologies have been proposed and successfully implemented to
supply electricity from a coal-ired power plant. These Clean Coal Technologies (CCT) can involve a coal upgrading technology in which the caloriic value of a low rank coal is increased by removing the moisture content and other impurities, or a subcritical, luidized-bed combustion technology. The most common example of this latter technology incorporates circulating luidized-bed combustion (CFBC).
These two technologies are highly relevant for advancing the current Indonesian policy (GoI (2009)) and electricity sector planning goals (PT PLN (Persero) (2009)).Either or both could help to increase utilization of Indonesia’s low rank coal (LRC) resources, which comprise about 60% total coal resources in Indonesia. Many commercial variations of these clean coal technologies have been introduced; there is even a planner’s guide offered by the World Bank to assist in selecting the right clean coal technology for each application (Karin Oskarsson, et al. (1997)).
Other CCTs, including supercritical, pulverized coal (PC) and ultra-supercritical PC may become important in the future and could further stimulate the utilization of medium-rank coal. Some of these
may be applied as an alternative to the proposed decommissioning of old, ineficient coal-ired power
plant in the Java-Bali System (JBS). Such decommissioning has been proposed in the RUPTL, for up to 1,000 MWe of existing capacity. The development and commercial prospects of these supercritical and ultra-supercritical PC plants have been reported in many publications (for example, Scott Smouse (2009) and Steve Mirsky (2009)). These advanced, clean coal technologies can reduce environmental impact and CO2 emissions compared to the conventional PC technology that has widely operated in Indonesia
during the last one decade. However, even these advanced coal-ired power plant will emit a large quantity
of CO2 emissions, and will contribute signiicantly to the increased level of GHGs in the atmosphere. In the medium-term (10 years), supercritical and ultra-supercritical PC power plant technology should be introduced to Java-Bali System, and may be introduced in the Sumatra system in the foreseeable future.
Figure 14:Schematic Diagram of CCS Technology
There are some potential aquifers, onshore and offshore, available in Sumatra and Kalimantan and north of Jakarta that may be suitable for large-scale carbon sequestration, if coupled with mine-mouth coal power plants or natural gas, combined cycle (NGCC) power plants. As proposed by LEMIGAS (Hardiv Situmeang (2008)), the aquifers in South Sumatra and South Kalimantan are suitable for use
in conjunction with mine mouth coal-i red power plants, while the offshore aquifer in North Jakarta
could be allocated for use with the proposed NGCC power plant, as illustrated in Figure 15. Besides the availability of natural geological structures such as the aquifers, CO2 injection may create an important business opportunity, as it can be utilized with either natural gas, oil or even CBM in conjunction with Enhanced Recovery, through application of advanced techniques for EGR (Enhance Gas Recovery), EOR (Enhance Oil Recovery) or Enhance CBM Recovery (ECBMR). Commercial experience with
Table 4:Costs of Various CCS Components
Figure 15:Areas for CCS Potential in Indonesia
Last but not least, Integrated Gasii cation Combined Cycle (IGCC) technologyremains less competitive
itself. However, the integration of IGCC technology with other energy production facilities, such as an
oil reinery, will improve its economics.
4.5.2 Geothermal and Other New and Renewable Sources
Geothermal is considered a champion technology for renewable energy in Indonesia. It will be selected as a high priority for development due to the abundance of the resource but low utilization level. Increased use of these resources is highly consistent with GOI policy. The GOI is planning to enhance geothermal development by as much as 6,000 – 8,000 MWe over the next 10 years. With the world’s largest geothermal resource, estimated at about 27,000 MWe and current installed capacity of about 1,052 MW, Indonesia will promote the continued development of geothermal technology. (See Table 3 below.)
The GOI launched its blue print for geothermal development in 2006 (DGMCG (2008)). This ambitious plan will require international support in order to overcome the main barrier that deters the geothermal power development, the lack of an adequate policy framework that incorporates the environmental
beneits of this renewable energy utilization, and provides adequate economic incentives to overcome the
perception of technology risk. Despite the Geothermal Law in 2003 (Law no. 27/2003), which mandates that development of the future 22,000 MWe of geothermal power plant, up to this year (2010), no more than 300 MWe of new geothermal power capacity has been put into operation.
Other than geothermal energy, biofuels are the most prominent renewable energy technology that the GOI is likely to develop as a complement to, but not completely substitute for, oil. Biofuels are categorized into two main types: bioethanol, a fermentation product based on the digestion of crops by
bacteria or yeast; and biodiesel, which is produced through a chemical process called trans-esteriication.
The crops used today to make bioethanol are mainly food staples, such as corn, palm oil, and soybean.
There use as “energy crops” has created conlict and controversy over the diversion food as feedstock
for liquid fuels. On the global stage, and especially in the US, corn has been the raw material of choice for manufacturing bioethanol because fermentation is a proven process and because of the availability of US government subsidies to bioethanol producers.
Most scientists today agree that the ethanol experiment hasn’t gone well. It takes about 21 pounds of corn to produce just one gallon of ethanol. And farming that corn requires half a gallon of fossil fuels as inputs to the farming enterprise. As a result, the production of corn-based fuels leads to price rises
and food shortages. In addition, the process used to produce bioethanol is also ineficient and unlikely to
reduce US oil import requirements. (Melinda Werner (2009) and National Geographic Collector’s Edition (2009)).