LAMPIRAN I
Kuisioner Penelitian
A.
KARAKTERISTIK RESPONDEN
Jenis kelamin
: ...
Usia
: ... tahun
Pendidikan terakhir
: ...
Lama bekerja sebagai pegawai
: ... tahun
di Bank BNI Kantor Wilayah
Medan
B.
Preferensi anda tentang Pemanfaatan Sistem Informasi Akuntansi,
Kompetensi, Motivasi Kerja dan Kinerja Pegawai
Petunjuk pengisian : Bacalah dengan teliti setiap pertanyaan dan seluruh
kemungkinan dari jawabannya. Berikan jawaban terhadap pernyataan
berikut sesuai dengan realita yang anda hadapi dengan cara memberi tanda
(
√
) pada kolom yang tersedia.
Keterangan :
SS
: Sangat Setuju
S
: Setuju
TS
: Tidak Setuju
N
: Netral
STS
: Sangat Tidak Setuju
PERSEPSI PEMANFAATAN SISTEM INFORMASI AKUNTANSI
No Item Pernyataan
5
4
3
2
1
SS
S
N
TS
STS
1
Dengan menggunakan Sistem
Informasi Akuntansi saya bisa
menyelesaikan pekerjan saya
dengan lebih cepat
3.
Dengan menggunakan Sistem
Informasi Akuntansi meningkatkan
produktivitas saya.
4.
Dengan menggunakan Sistem
Informasi Akuntansi akan
meningkatkan efektivitas kerja
saya.
5.
Menggunakan Sistem Informasi
akan membuat pekerjaan saya lebih
mudah.
6.
Saya merasa menggunakan Sistem
Informasi Akuntansi berguna dalam
pekerjaan saya.
7.
Mudah bagi saya untuk
mempelajari cara mengoperasikan
Sistem Informasi Akuntansi
8.
Saya merasa mudah untuk
mengoperasikan Sistem Informasi
Akuntansi sesuai dengan keinginan
saya.
9.
Interaksi saya dengan Sistem
Informasi Akuntansi sangat jelas
dan dapat dipahami.
10.
Saya merasa Sistem Inforasi
Akuntansi cukup fleksibel untuk
digunakan
11.
Akan mudah bagi saya untuk
menjadi ahli dalam menggunakan
Sistem Informasi Akuntansi
12.
Saya merasa Sistem Informasi
Akuntansi mudah digunakan.
KOMPETENSI
No
Item Pernyataan
5
4
3
2
1
SS
S
N
TS
STS
1.
Saya menguasai pekerjaan saya
dengan baik
2.
Saya dapat berfikir kreatif dalam
melaksanakan pekerjaan
3.
Saya memahami semua aturan yang
berkaitan terhadap pekerjaan
dengan baik
4.
Saya mampu memecahkan masalah
yang terjadi dalam pekerjaan
5.
Saya mempunyai kemampuan
6.
Saya mampu bekerjasama dengan
baik dengan rekan kerja
7.
Saya selalu melaksanakan
pekerjaan tepat waktu
8.
Saya selalu hadir tepat waktu
9.
Saya dapat mematuhi norma-norma
sosial dalam melaksanakan
pekerjaan
MOTIVASI KERJA
No
Item Pernyataan
5
4
3
2
1
SS
S
N
TS
STS
1.
Saya bersedia bertanggungjawab
terhadap hasil kerja yang dicapai.
2.
Dalam melakukan pekerjaan, saya
selalu berupaya mencari
inovasi-inovasi baru.
3,
Saya menyukai pekerjaan dengan
resiko yang telah diperhitungkan.
4.
Saya menyukai pekerjaan yang
menarik dan menantang
5.
Saya ingin mengetahui hasil
pekerjaan atau umpan balik dengan
segera.
6.
Saya menyukai pekerjaan yang
dapat berinteraksi dengan teman
sekerja.
7.
Saya menyukai dan ikut
berpartisipasi dalam berbagai
perkumpulan pekerja.
8.
Saya merasa senang dapat
beraktivitas dalam pekerjaan.
9.
Saya merasa berbahagia jika dapat
berbuat sesuatu yang
menyenangkan
10.
Saya bersedia menolong meskipun
tidak diminta
11.
Saya mengharapkan orang lain
agar mengikuti pendapat dan
keinginan saya.
12.
Saya merasa menjadi pengendali di
lingkungan kerja.
KINERJA PEGAWAI
No Item Pernyataan
5
4
3
2
1
SS
S
N
TS
STS
1.
Saya dapat menyelesaikan sejumlah
pekerjaan yang ditargetkan
perusahaan.
2.
Saya dapat menyelesaikan
pekerjaan dengan teliti dan tepat
sesuai dengan yang diharapkan.
3.
Saya mempunyai pengetahuan yang
cukup tentang tugas/kewajiban.
4.
Saya mampu bekerja sama dengan
orang lain.
5.
Saya disenangi teman-teman kerja
6.
Saya berusaha mempunyai
perhatian penuh dan konsenstrasi
terhadap pekerjaan.
7.
Kesalahan-kesalahan pekerjaan
saya akan saya tanggung
kerugiannya.
8.
Saya suka mengajukan gagasan dan
inisiatif untuk menyelesaikan
pekerjaan.
9.
Saya suka menyelesaikan pekerjaan
dengan cara yang berbeda agar
mencapai hasil yang terbaik.
10.
Saya mempunyai ketrampilan
menjalankan peralatan elektronik
maupun mesin untuk
menyelesaikan pekerjaan.
11.
Saya mampu mengarahkan dan
membimbing karyawan lain untuk
menyelesaikan pekerjaan mereka
12.
Saya dapat mengambil keputusan
Lampiran III Data Penelitian
PERSEPSI TENTANG SISTEM INFORMASI AKUNTANSI (SIA)
Per1 Per2 Per3 Per4 Per5 Per6 Per7 Per8 Per9 Pe10 Per11 Per12
4 4 4 3 1 4 1 1 3 1 1 3
4 4 4 3 4 4 4 4 2 4 4 3
4 4 4 4 4 4 4 4 4 4 4 4
4 4 4 4 4 5 4 4 4 3 3 1
3 4 2 4 4 3 4 4 4 4 4 4
4 4 4 4 4 4 4 1 4 1 4 3
4 4 4 5 4 5 4 4 4 4 4 4
4 4 4 1 4 4 4 4 3 4 4 1
4 4 3 4 4 4 4 3 4 4 3 2
4 4 5 4 4 4 4 4 4 4 5 4
4 4 5 4 4 4 4 2 4 4 1 4
4 4 4 1 4 1 4 1 1 4 1 1
4 4 4 3 3 4 4 4 4 3 4 3
4 4 5 3 3 4 4 5 4 4 5 3
KOMPETENSI
Kom1 Kom2 Kom3 Kom4 Kom5 Kom6 Kom7 Kom8 Kom9
5 4 4 5 4 4 3 5 5
5 4 4 5 4 4 4 4 4
4 4 5 4 4 5 4 4 5
5 5 4 5 5 4 5 4 4
4 5 5 4 5 5 4 4 4
4 5 4 4 5 4 4 5 4
3 3 1 3 3 1 4 4 3
4 4 5 4 4 5 4 4 4
5 5 4 5 5 4 5 4 3
4 4 4 4 4 4 2 4 4
4 3 4 4 3 4 5 5 4
4 4 4 4 4 4 5 5 4
4 4 4 4 4 4 5 4 4
2 3 1 1 1 1 1 1 1
4 1 4 4 1 4 4 3 4
4 4 4 4 4 4 4 4 1
2 3 1 1 1 1 1 1 1
5 4 4 5 4 4 4 4 4
4 5 4 4 5 4 5 5 4
3 5 5 3 5 5 5 5 4
4 4 4 4 4 4 4 5 4
4 4 5 4 4 5 5 5 4
4 4 4 4 4 4 5 4 4
4 4 4 4 4 4 5 5 5
4 4 4 4 4 4 4 4 4
5 4 4 5 4 4 4 4 4
Kom1 Kom2 Kom3 Kom4 Kom5 Kom6 Kom7 Kom8 Kom9
5 4 5 5 4 5 4 4 4
5 5 4 5 5 4 5 5 5
4 4 5 4 4 5 4 5 4
3 3 4 3 3 4 5 5 4
4 5 4 4 5 4 5 5 4
4 4 4 4 4 4 5 4 4
4 3 1 4 3 1 1 1 3
4 4 4 4 4 4 5 5 5
4 4 5 4 4 5 5 5 4
4 4 4 4 4 4 4 4 4
3 4 4 3 4 4 4 5 5
4 4 3 4 4 3 4 4 4
4 4 4 4 4 4 4 4 5
4 4 4 4 4 4 5 5 5
4 4 4 4 4 4 4 1 2
3 1 4 3 1 4 3 2 3
4 4 5 4 4 5 4 5 5
4 4 4 4 4 4 4 4 5
4 4 4 4 4 4 4 4 4
4 5 4 4 5 4 5 5 5
4 4 4 4 4 4 4 4 4
5 4 5 5 4 5 4 4 4
4 4 4 4 4 4 5 4 3
4 4 5 4 4 5 5 4 4
4 5 5 1 1 1 1 1 1
4 4 4 4 4 4 1 2 3
2 3 1 1 1 1 1 1 1
4 4 4 4 4 4 5 5 5
2 3 1 1 1 1 1 1 1
MOTIVASI KERJA
Mov1 Mov2 Mov3 Mov4 Mov5 Mov6 Mov7 Mov8 Mov9 Mov10 Mov11 Mov12 Mov13
3 4 3 3 2 3 4 3 4 4 3 2 3
4 5 5 4 4 4 4 4 4 4 4 3 3
1 4 4 4 3 4 4 4 4 5 2 2 2
1 5 5 5 5 5 5 5 5 5 5 4 4
3 5 5 5 4 4 4 4 4 3 4 3 2
3 5 5 5 5 5 5 5 5 5 4 1 2
2 3 2 2 3 2 3 2 2 3 2 2 2
4 1 4 4 1 4 1 3 4 1 4 4 4
1 3 1 3 3 1 3 1 3 3 1 1 1
4 1 4 1 3 4 1 4 1 3 4 4 3
1 2 1 2 2 1 2 1 2 2 1 1 1
1 3 4 3 3 1 3 4 3 3 4 4 4
2 1 2 2 3 2 1 2 2 3 2 2 2
1 1 1 1 1 1 1 1 1 1 1 1 1
Mov1 Mov2 Mov3 Mov4 Mov5 Mov6 Mov7 Mov8 Mov9 Mov10 Mov11 Mov12 Mov13
3 3 3 3 3 3 3 3 3 3 3 3 3
2 2 2 2 2 2 2 2 2 2 2 2 2
1 3 1 3 3 1 3 1 3 3 1 1 1
4 4 4 4 4 4 3 4 4 4 4 4 4
4 4 4 4 4 4 4 4 4 4 3 4 4
5 4 4 5 4 1 4 4 4 4 2 4 4
4 4 5 4 4 4 3 5 4 4 4 4 4
5 4 1 4 4 5 4 1 4 4 5 5 4
4 4 3 5 5 4 3 3 1 1 4 4 3
4 4 1 3 1 4 4 1 1 3 4 4 4
4 2 4 4 4 4 2 4 4 4 4 4 4
4 3 4 3 4 4 4 4 3 4 5 5 5
4 4 1 4 4 4 4 1 4 4 4 1 1
4 4 4 4 4 4 4 1 4 4 4 1 1
3 4 4 4 4 4 4 4 4 4 1 3 3
4 4 4 4 4 4 1 4 4 4 1 4 4
4 3 3 4 4 4 4 3 4 4 5 5 4
5 4 4 4 5 4 4 4 4 1 1 4 4
4 3 4 4 1 4 4 1 4 3 1 1 1
4 4 1 1 1 1 1 1 1 1 1 1 1
4 4 2 4 4 4 4 1 4 4 4 1 1
4 4 4 4 5 4 4 4 1 1 4 3 3
4 4 1 3 1 4 4 1 3 1 4 1 1
4 4 3 4 4 4 4 3 4 4 4 3 3
3 4 2 4 3 3 4 2 4 3 3 2 2
4 3 4 4 4 4 1 4 4 4 4 2 2
4 4 4 4 4 4 4 3 4 5 4 1 1
4 4 4 4 4 4 4 4 4 4 4 4 4
4 4 4 2 1 4 4 4 3 4 4 4 4
4 3 4 3 3 4 3 4 3 3 4 4 4
4 4 4 4 4 1 4 4 4 4 2 4 4
4 4 4 1 1 4 4 4 4 4 4 4 4
4 4 4 4 4 4 1 4 4 4 1 1 1
5 4 4 4 4 4 4 4 3 4 4 1 1
4 4 3 3 3 4 4 4 4 3 4 4 4
5 4 4 4 4 4 4 4 4 1 3 4 4
4 3 3 3 4 4 3 3 3 4 4 3 3
4 4 1 4 4 4 4 4 4 4 4 4 4
4 4 4 4 4 1 4 4 4 1 3 4 4
4 4 4 4 1 4 4 4 1 4 4 1 1
4 4 4 3 4 4 4 4 2 4 4 1 1
4 4 4 4 2 2 2 4 4 4 4 4 4
4 2 5 4 4 4 1 4 4 2 4 4 4
KINERJA
Kin1 Kin2 Kin3 Kin4 Kin5 Kin6 Kin7 Kin8 Kin9 Kin10 Kin11 Kin12
4 4 3 4 4 3 4 3 4 3 1 3
1 4 3 1 4 3 4 4 1 3 4 4
4 2 2 5 2 2 2 2 5 3 2 2
4 2 2 4 2 2 2 2 4 3 2 2
4 3 5 4 3 3 3 4 4 3 2 5
4 1 3 4 1 3 1 3 4 2 3 2
2 3 2 2 3 2 3 2 2 4 4 4
4 1 4 4 1 4 1 3 4 2 5 5
4 3 4 4 3 4 3 1 3 3 3 3
2 3 4 4 3 4 3 4 3 3 3 3
2 2 1 2 2 1 2 1 2 4 4 3
3 3 1 3 3 1 3 4 3 1 3 4
2 3 2 2 3 2 1 2 2 3 2 2
1 1 1 1 1 1 1 1 1 1 1 1
4 1 3 4 1 3 1 3 4 1 3 1
3 3 3 3 3 3 3 3 3 3 3 3
2 2 2 2 2 2 2 2 2 2 2 2
3 3 1 3 3 1 3 1 3 3 1 1
3 3 2 3 3 2 3 2 3 3 2 2
4 4 3 4 4 4 4 3 4 4 3 3
4 4 3 4 4 4 4 3 4 3 3 2
4 4 4 4 4 4 4 4 4 4 4 4
4 4 4 4 4 4 3 3 4 4 4 4
4 4 5 4 4 5 4 4 4 2 4 2
4 4 4 4 4 4 4 4 5 5 5 4
5 4 4 5 4 4 4 3 4 2 4 4
4 4 4 4 4 4 4 4 4 4 4 4
1 4 1 1 4 1 1 1 4 1 1 1
1 3 4 1 3 4 3 2 2 1 4 4
4 4 2 4 4 2 4 2 4 4 2 4
3 4 5 3 4 5 4 4 3 4 4 3
4 3 4 4 3 4 4 3 4 4 5 5
4 2 4 4 2 4 4 2 4 4 4 4
4 1 4 4 1 4 3 4 4 4 4 4
4 4 4 4 4 4 4 4 4 3 4 4
4 4 4 4 4 4 3 4 4 4 4 4
4 4 1 4 4 1 4 1 4 3 1 1
4 4 4 4 4 4 4 4 4 4 4 4
4 2 4 4 2 4 4 4 4 2 4 4
4 4 4 4 4 4 2 4 4 4 4 4
3 4 4 3 4 4 4 4 4 4 4 4
4 4 3 4 4 3 4 4 4 4 4 4
4 4 4 4 4 4 4 4 4 1 2 4
4 5 4 4 5 4 5 5 4 4 4 4
Kin1 Kin2 Kin3 Kin4 Kin5 Kin6 Kin7 Kin8 Kin9 Kin10 Kin11 Kin12
3 1 4 3 1 4 1 1 3 4 4 3
3 4 4 3 4 4 4 4 4 4 4 4
4 4 4 4 4 4 4 4 4 4 4 4
4 4 5 4 4 5 4 4 4 4 4 1
4 4 3 4 4 3 4 4 4 4 5 5
4 4 4 4 4 4 4 2 4 4 4 4
5 4 5 5 4 5 4 4 4 3 3 4
2 4 4 2 4 4 4 4 4 4 4 4
4 4 4 4 4 4 4 3 4 3 2 2
4 4 4 4 4 4 4 4 4 4 4 4
4 4 4 4 4 4 4 2 1 3 3 2
2 4 2 2 4 2 4 2 2 4 2 2
4 3 4 4 3 4 4 4 4 4 4 4
Lampiran IV
Statistik Deskriptif
Frequency Table
Kelamin
21 35.6 35.6 35.6
38 64.4 64.4 100.0
59 100.0 100.0
Laki-laki Perempuan Total Valid
Frequency Percent Valid Percent
Cumulative Percent
Um ur
29 49.2 49.2 49.2
18 30.5 30.5 79.7
12 20.3 20.3 100.0
59 100.0 100.0
<30 tahun 30-40 tahun >40 tahun Total Valid
Frequency Percent Valid P erc ent
Cumulative Percent
Pendidikan
24 40.7 40.7 40.7
35 59.3 59.3 100.0
59 100.0 100.0
D3 S1 Total Valid
Frequency Percent Valid Percent
Cumulative Percent
La ma _kerja
36 61.0 61.0 61.0
11 18.6 18.6 79.7
12 20.3 20.3 100.0
59 100.0 100.0
<5 tahun 5-10 tahun >10 tahun Total Valid
Frequency Percent Valid P erc ent
Lampiran V
Tabel Frekuensi
Tabel Persepsi Pemanfaatan SIA (X1)
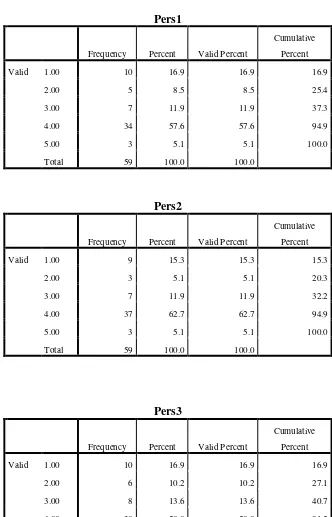
Pers1
Frequency Percent Valid Percent
Cumulative
Percent
Valid 1.00 10 16.9 16.9 16.9
2.00 5 8.5 8.5 25.4
3.00 7 11.9 11.9 37.3
4.00 34 57.6 57.6 94.9
5.00 3 5.1 5.1 100.0
Total 59 100.0 100.0
Pers2
Frequency Percent Valid Percent
Cumulative
Percent
Valid 1.00 9 15.3 15.3 15.3
2.00 3 5.1 5.1 20.3
3.00 7 11.9 11.9 32.2
4.00 37 62.7 62.7 94.9
5.00 3 5.1 5.1 100.0
Total 59 100.0 100.0
Pers3
Frequency Percent Valid Percent
Cumulative
Percent
Valid 1.00 10 16.9 16.9 16.9
2.00 6 10.2 10.2 27.1
3.00 8 13.6 13.6 40.7
4.00 30 50.8 50.8 91.5
5.00 5 8.5 8.5 100.0
Pers4
Frequency Percent Valid Percent
Cumulative Percent
Valid 1.00 8 13.6 13.6 13.6
2.00 3 5.1 5.1 18.6
3.00 14 23.7 23.7 42.4
4.00 30 50.8 50.8 93.2
5.00 4 6.8 6.8 100.0
Total 59 100.0 100.0
Pers5
Frequency Percent Valid Percent
Cumulative Percent
Valid 1.00 11 18.6 18.6 18.6
2.00 4 6.8 6.8 25.4
3.00 9 15.3 15.3 40.7
4.00 28 47.5 47.5 88.1
5.00 7 11.9 11.9 100.0
Total 59 100.0 100.0
Pers6
Frequency Percent Valid Percent
Cumulative Percent
Valid 1.00 12 20.3 20.3 20.3
2.00 5 8.5 8.5 28.8
3.00 7 11.9 11.9 40.7
4.00 33 55.9 55.9 96.6
5.00 2 3.4 3.4 100.0
Pers7
Frequency Percent Valid Percent
Cumulative Percent
Valid 1.00 8 13.6 13.6 13.6
2.00 3 5.1 5.1 18.6
3.00 6 10.2 10.2 28.8
4.00 36 61.0 61.0 89.8
5.00 6 10.2 10.2 100.0
Total 59 100.0 100.0
Pers8
Frequency Percent Valid Percent
Cumulative Percent
Valid 1.00 14 23.7 23.7 23.7
2.00 5 8.5 8.5 32.2
3.00 9 15.3 15.3 47.5
4.00 28 47.5 47.5 94.9
5.00 3 5.1 5.1 100.0
Total 59 100.0 100.0
Pers9
Frequency Percent Valid Percent
Cumulative Percent
Valid 1.00 7 11.9 11.9 11.9
2.00 6 10.2 10.2 22.0
3.00 11 18.6 18.6 40.7
4.00 33 55.9 55.9 96.6
5.00 2 3.4 3.4 100.0
Pers10
Frequency Percent Valid Percent
Cumulative Percent
Valid 1.00 13 22.0 22.0 22.0
2.00 4 6.8 6.8 28.8
3.00 12 20.3 20.3 49.2
4.00 24 40.7 40.7 89.8
5.00 6 10.2 10.2 100.0
Total 59 100.0 100.0
Pers11
Frequency Percent Valid Percent
Cumulative Percent
Valid 1.00 13 22.0 22.0 22.0
2.00 6 10.2 10.2 32.2
3.00 8 13.6 13.6 45.8
4.00 27 45.8 45.8 91.5
5.00 5 8.5 8.5 100.0
Total 59 100.0 100.0
Pers12
Frequency Percent Valid Percent
Cumulative Percent
Valid 1.00 16 27.1 27.1 27.1
2.00 8 13.6 13.6 40.7
3.00 16 27.1 27.1 67.8
4.00 18 30.5 30.5 98.3
5.00 1 1.7 1.7 100.0
Tabel Kompetensi (X2)
Kom1
Frequency Percent Valid Percent
Cumulative Percent
Valid 2.00 4 6.8 6.8 6.8
3.00 5 8.5 8.5 15.3
4.00 39 66.1 66.1 81.4
5.00 11 18.6 18.6 100.0
Total 59 100.0 100.0
Kom2
Frequency Percent Valid Percent
Cumulative Percent
Valid 1.00 2 3.4 3.4 3.4
3.00 8 13.6 13.6 16.9
4.00 38 64.4 64.4 81.4
5.00 11 18.6 18.6 100.0
Total 59 100.0 100.0
Kom3
Frequency Percent Valid Percent
Cumulative Percent
Valid 1.00 7 11.9 11.9 11.9
3.00 1 1.7 1.7 13.6
4.00 38 64.4 64.4 78.0
5.00 13 22.0 22.0 100.0
Kom4
Frequency Percent Valid Percent
Cumulative Percent
Valid 1.00 5 8.5 8.5 8.5
3.00 5 8.5 8.5 16.9
4.00 38 64.4 64.4 81.4
5.00 11 18.6 18.6 100.0
Total 59 100.0 100.0
Kom5
Frequency Percent Valid Percent
Cumulative Percent
Valid 1.00 7 11.9 11.9 11.9
3.00 4 6.8 6.8 18.6
4.00 38 64.4 64.4 83.1
5.00 10 16.9 16.9 100.0
Total 59 100.0 100.0
Kom6
Frequency Percent Valid Percent
Cumulative Percent
Valid 1.00 8 13.6 13.6 13.6
3.00 1 1.7 1.7 15.3
4.00 38 64.4 64.4 79.7
5.00 12 20.3 20.3 100.0
Kom7
Frequency Percent Valid Percent
Cumulative Percent
Valid 1.00 7 11.9 11.9 11.9
2.00 1 1.7 1.7 13.6
3.00 3 5.1 5.1 18.6
4.00 26 44.1 44.1 62.7
5.00 22 37.3 37.3 100.0
Total 59 100.0 100.0
Kom8
Frequency Percent Valid Percent
Cumulative Percent
Valid 1.00 7 11.9 11.9 11.9
2.00 3 5.1 5.1 16.9
3.00 1 1.7 1.7 18.6
4.00 28 47.5 47.5 66.1
5.00 20 33.9 33.9 100.0
Total 59 100.0 100.0
Kom9
Frequency Percent Valid Percent
Cumulative Percent
Valid 1.00 6 10.2 10.2 10.2
2.00 1 1.7 1.7 11.9
3.00 6 10.2 10.2 22.0
4.00 33 55.9 55.9 78.0
5.00 13 22.0 22.0 100.0
Tabel Motivasi Kerja (X3)
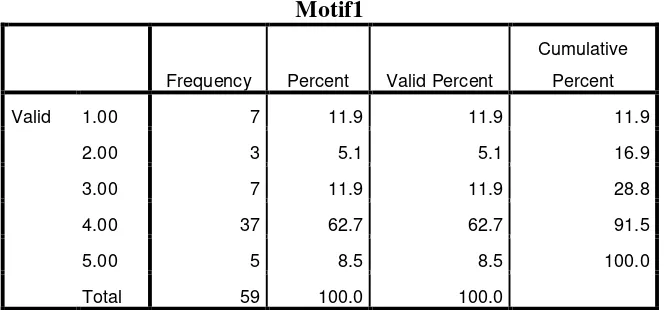
Motif1
Frequency Percent Valid Percent
Cumulative Percent
Valid 1.00 7 11.9 11.9 11.9
2.00 3 5.1 5.1 16.9
3.00 7 11.9 11.9 28.8
4.00 37 62.7 62.7 91.5
5.00 5 8.5 8.5 100.0
Total 59 100.0 100.0
Motif2
Frequency Percent Valid Percent
Cumulative Percent
Valid 1.00 6 10.2 10.2 10.2
2.00 4 6.8 6.8 16.9
3.00 11 18.6 18.6 35.6
4.00 34 57.6 57.6 93.2
5.00 4 6.8 6.8 100.0
Total 59 100.0 100.0
Motif3
Frequency Percent Valid Percent
Cumulative Percent
Valid 1.00 10 16.9 16.9 16.9
2.00 5 8.5 8.5 25.4
3.00 8 13.6 13.6 39.0
4.00 30 50.8 50.8 89.8
5.00 6 10.2 10.2 100.0
Motif4
Frequency Percent Valid Percent
Cumulative Percent
Valid 1.00 4 6.8 6.8 6.8
2.00 5 8.5 8.5 15.3
3.00 13 22.0 22.0 37.3
4.00 32 54.2 54.2 91.5
5.00 5 8.5 8.5 100.0
Total 59 100.0 100.0
Motif5
Frequency Percent Valid Percent
Cumulative Percent
Valid 1.00 10 16.9 16.9 16.9
2.00 4 6.8 6.8 23.7
3.00 11 18.6 18.6 42.4
4.00 29 49.2 49.2 91.5
5.00 5 8.5 8.5 100.0
Total 59 100.0 100.0
Motif6
Frequency Percent Valid Percent
Cumulative Percent
Valid 1.00 9 15.3 15.3 15.3
2.00 4 6.8 6.8 22.0
3.00 4 6.8 6.8 28.8
4.00 39 66.1 66.1 94.9
5.00 3 5.1 5.1 100.0
Motif7
Frequency Percent Valid Percent
Cumulative Percent
Valid 1.00 10 16.9 16.9 16.9
2.00 4 6.8 6.8 23.7
3.00 10 16.9 16.9 40.7
4.00 33 55.9 55.9 96.6
5.00 2 3.4 3.4 100.0
Total 59 100.0 100.0
Motif8
Frequency Percent Valid Percent
Cumulative Percent
Valid 1.00 12 20.3 20.3 20.3
2.00 4 6.8 6.8 27.1
3.00 9 15.3 15.3 42.4
4.00 31 52.5 52.5 94.9
5.00 3 5.1 5.1 100.0
Total 59 100.0 100.0
Motif9
Frequency Percent Valid Percent
Cumulative Percent
Valid 1.00 7 11.9 11.9 11.9
2.00 5 8.5 8.5 20.3
3.00 11 18.6 18.6 39.0
4.00 34 57.6 57.6 96.6
5.00 2 3.4 3.4 100.0
Motif10
Frequency Percent Valid Percent
Cumulative Percent
Valid 1.00 10 16.9 16.9 16.9
2.00 3 5.1 5.1 22.0
3.00 13 22.0 22.0 44.1
4.00 29 49.2 49.2 93.2
5.00 4 6.8 6.8 100.0
Total 59 100.0 100.0
Motif11
Frequency Percent Valid Percent
Cumulative Percent
Valid 1.00 10 16.9 16.9 16.9
2.00 7 11.9 11.9 28.8
3.00 7 11.9 11.9 40.7
4.00 31 52.5 52.5 93.2
5.00 4 6.8 6.8 100.0
Total 59 100.0 100.0
Motif12
Frequency Percent Valid Percent
Cumulative Percent
Valid 1.00 16 27.1 27.1 27.1
2.00 7 11.9 11.9 39.0
3.00 8 13.6 13.6 52.5
4.00 25 42.4 42.4 94.9
5.00 3 5.1 5.1 100.0
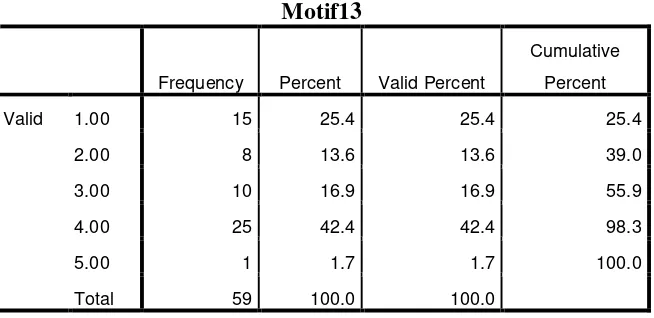
Motif13
Frequency Percent Valid Percent
Cumulative Percent
Valid 1.00 15 25.4 25.4 25.4
2.00 8 13.6 13.6 39.0
3.00 10 16.9 16.9 55.9
4.00 25 42.4 42.4 98.3
5.00 1 1.7 1.7 100.0
Total 59 100.0 100.0
Tabel Motivasi Kerja (X3)
Kin1
Frequency Percent Valid Percent
Cumulative Percent
Valid 1.00 4 6.8 6.8 6.8
2.00 7 11.9 11.9 18.6
3.00 9 15.3 15.3 33.9
4.00 37 62.7 62.7 96.6
5.00 2 3.4 3.4 100.0
Total 59 100.0 100.0
Kin2
Frequency Percent Valid Percent
Cumulative Percent
Valid 1.00 6 10.2 10.2 10.2
2.00 6 10.2 10.2 20.3
3.00 13 22.0 22.0 42.4
4.00 33 55.9 55.9 98.3
5.00 1 1.7 1.7 100.0
Kin3
Frequency Percent Valid Percent
Cumulative Percent
Valid 1.00 6 10.2 10.2 10.2
2.00 8 13.6 13.6 23.7
3.00 9 15.3 15.3 39.0
4.00 31 52.5 52.5 91.5
5.00 5 8.5 8.5 100.0
Total 59 100.0 100.0
Kin4
Frequency Percent Valid Percent
Cumulative Percent
Valid 1.00 4 6.8 6.8 6.8
2.00 6 10.2 10.2 16.9
3.00 9 15.3 15.3 32.2
4.00 37 62.7 62.7 94.9
5.00 3 5.1 5.1 100.0
Total 59 100.0 100.0
Kin5
Frequency Percent Valid Percent
Cumulative Percent
Valid 1.00 6 10.2 10.2 10.2
2.00 6 10.2 10.2 20.3
3.00 13 22.0 22.0 42.4
4.00 33 55.9 55.9 98.3
5.00 1 1.7 1.7 100.0
Kin6
Frequency Percent Valid Percent
Cumulative Percent
Valid 1.00 6 10.2 10.2 10.2
2.00 8 13.6 13.6 23.7
3.00 8 13.6 13.6 37.3
4.00 33 55.9 55.9 93.2
5.00 4 6.8 6.8 100.0
Total 59 100.0 100.0
Kin7
Frequency Percent Valid Percent
Cumulative Percent
Valid 1.00 7 11.9 11.9 11.9
2.00 5 8.5 8.5 20.3
3.00 12 20.3 20.3 40.7
4.00 34 57.6 57.6 98.3
5.00 1 1.7 1.7 100.0
Total 59 100.0 100.0
Kin8
Frequency Percent Valid Percent
Cumulative Percent
Valid 1.00 7 11.9 11.9 11.9
2.00 12 20.3 20.3 32.2
3.00 11 18.6 18.6 50.8
4.00 26 44.1 44.1 94.9
5.00 3 5.1 5.1 100.0
Total 59 100.0 100.0
Kin9
Frequency Percent Valid Percent
Cumulative Percent
Valid 1.00 3 5.1 5.1 5.1
2.00 6 10.2 10.2 15.3
3.00 8 13.6 13.6 28.8
4.00 40 67.8 67.8 96.6
5.00 2 3.4 3.4 100.0
Total 59 100.0 100.0
Kin10
Frequency Percent Valid Percent
Cumulative Percent
Valid 1.00 6 10.2 10.2 10.2
2.00 6 10.2 10.2 20.3
3.00 17 28.8 28.8 49.2
4.00 29 49.2 49.2 98.3
5.00 1 1.7 1.7 100.0
Total 59 100.0 100.0
Kin11
Frequency Percent Valid Percent
Cumulative Percent
Valid 1.00 5 8.5 8.5 8.5
2.00 10 16.9 16.9 25.4
3.00 11 18.6 18.6 44.1
4.00 28 47.5 47.5 91.5
5.00 5 8.5 8.5 100.0
Kin12
Frequency Percent Valid Percent
Cumulative Percent
Valid 1.00 7 11.9 11.9 11.9
2.00 11 18.6 18.6 30.5
3.00 9 15.3 15.3 45.8
4.00 28 47.5 47.5 93.2
5.00 4 6.8 6.8 100.0
Lampiran VI
Uji Validitas Dan Reliabilitas
Persepsi Pemanfaatan Sistem Informasi Akutansi
Scale: ALL VARIABLES
Case Processing Summary
N %
Cases Valid 59 100.0
Excludeda 0 .0
Total 59 100.0
a. Listwise deletion based on all variables in the procedure.
Reliability Statistics
Cronbach's
Alpha N of Items
.901 12
Item Statistics
Mean Std. Deviation N
Pers1 3.2542 1.22606 59
Pers2 3.3729 1.17295 59
Pers3 3.2373 1.26408 59
Pers4 3.3220 1.13625 59
Pers5 3.2712 1.31084 59
Pers6 3.1356 1.26570 59
Pers7 3.4915 1.17990 59
Pers8 3.0169 1.31950 59
Pers9 3.2881 1.09939 59
Pers10 3.1017 1.33513 59
Pers11 3.0847 1.34277 59
Item-Total Statistics
Scale Mean if Item Deleted
Scale Variance if Item Deleted
Corrected Item-Total Correlation
Cronbach's Alpha if Item
Deleted
Pers1 34.9831 93.431 .491 .900
Pers2 34.8644 90.464 .660 .892
Pers3 35.0000 91.483 .558 .897
Pers4 34.9153 91.355 .641 .893
Pers5 34.9661 89.378 .624 .893
Pers6 35.1017 88.127 .708 .889
Pers7 34.7458 90.055 .675 .891
Pers8 35.2203 88.244 .669 .891
Pers9 34.9492 90.290 .721 .889
Pers10 35.1356 89.774 .593 .895
Pers11 35.1525 88.063 .663 .891
Pers12 35.5763 93.490 .488 .900
Scale Statistics
Mean Variance Std. Deviation N of Items
38.2373 106.563 10.32296 12
Kompetensi
Scale: ALL VARIABLES
Case Processing Summary
N %
Cases Valid 59 100.0
Excludeda 0 .0
Total 59 100.0
a. Listwise deletion based on all variables in the procedure.
Reliability Statistics
Cronbach's
Alpha N of Items
Item Statistics
Mean Std. Deviation N
Kom1 3.9661 .74199 59
Kom2 3.9492 .79706 59
Kom3 3.8475 1.14189 59
Kom4 3.8475 1.01393 59
Kom5 3.7458 1.12331 59
Kom6 3.7797 1.19001 59
Kom7 3.9322 1.25759 59
Kom8 3.8644 1.27925 59
Kom9 3.7797 1.13058 59
Item-Total Statistics
Scale Mean if Item Deleted
Scale Variance if Item Deleted
Corrected Item-Total Correlation
Cronbach's Alpha if Item
Deleted
Kom1 30.7458 53.365 .695 .926
Kom2 30.7627 55.046 .488 .934
Kom3 30.8644 48.602 .725 .922
Kom4 30.8644 49.188 .790 .918
Kom5 30.9661 47.378 .828 .915
Kom6 30.9322 46.685 .821 .916
Kom7 30.7797 46.554 .776 .919
Kom8 30.8475 45.683 .817 .916
Kom9 30.9322 48.340 .753 .920
Scale Statistics
Mean Variance Std. Deviation N of Items
Motivasi Kerja (X3)
Scale: ALL VARIABLES
Case Processing Summary
N %
Cases Valid 59 100.0
Excludeda 0 .0
Total 59 100.0
a. Listwise deletion based on all variables in the procedure.
Reliability Statistics
Cronbach's
Alpha N of Items
.857 13
Item Statistics
Mean Std. Deviation N
Motif1 3.5085 1.11993 59
Motif2 3.4407 1.07111 59
Motif3 3.2881 1.27375 59
Motif4 3.4915 1.00641 59
Motif5 3.2542 1.24004 59
Motif6 3.3898 1.18928 59
Motif7 3.2203 1.19001 59
Motif8 3.1525 1.27054 59
Motif9 3.3220 1.08978 59
Motif10 3.2373 1.20829 59
Motif11 3.2034 1.25643 59
Motif12 2.8644 1.35771 59
Item-Total Statistics
Scale Mean if Item Deleted
Scale Variance if Item Deleted
Corrected Item-Total Correlation
Cronbach's Alpha if Item
Deleted
Motif1 38.6780 79.636 .438 .852
Motif2 38.7458 79.745 .457 .850
Motif3 38.8983 74.541 .613 .841
Motif4 38.6949 78.043 .595 .843
Motif5 38.9322 76.616 .529 .846
Motif6 38.7966 76.268 .575 .843
Motif7 38.9661 78.964 .438 .852
Motif8 39.0339 73.688 .657 .838
Motif9 38.8644 78.223 .531 .846
Motif10 38.9492 79.359 .410 .854
Motif11 38.9831 76.810 .511 .847
Motif12 39.3220 76.360 .482 .850
Motif13 39.3729 76.479 .515 .847
Scale Statistics
Mean Variance Std. Deviation N of Items
42.1864 89.637 9.46768 13
Reliability KINERJA PEGAWAI (Y)
Scale: ALL VARIABLES
Case Processing Summary
N %
Cases Valid 59 100.0
Excludeda 0 .0
Total 59 100.0
a. Listwise deletion based on all variables in the procedure.
Reliability Statistics
Cronbach's
Item Statistics
Mean Std. Deviation N
Kin1 3.4407 .98735 59
Kin2 3.2881 1.03476 59
Kin3 3.3559 1.14112 59
Kin4 3.4915 .98913 59
Kin5 3.2881 1.03476 59
Kin6 3.3559 1.12591 59
Kin7 3.2881 1.06756 59
Kin8 3.1017 1.15512 59
Kin9 3.5424 .91580 59
Kin10 3.2203 1.01824 59
Kin11 3.3051 1.11810 59
Kin12 3.1864 1.18139 59
Item-Total Statistics
Scale Mean if Item Deleted
Scale Variance if Item Deleted
Corrected Item-Total Correlation
Cronbach's Alpha if Item
Deleted
Kin1 36.4237 63.110 .582 .879
Kin2 36.5763 63.697 .512 .883
Kin3 36.5085 59.082 .732 .870
Kin4 36.3729 63.410 .561 .880
Kin5 36.5763 63.697 .512 .883
Kin6 36.5085 59.047 .746 .869
Kin7 36.5763 60.731 .682 .873
Kin8 36.7627 59.598 .689 .873
Kin9 36.3220 64.636 .526 .882
Kin10 36.6441 64.233 .487 .884
Kin11 36.5593 62.216 .553 .881
Kin12 36.6780 62.429 .503 .884
Scale Statistics
Mean Variance Std. Deviation N of Items
LAMPIRAN VII
Uji Normalitas
One-Sample Kolmogorov-Smirnov Test
Unstandardized Residual
N 59
Normal Parametersa,b Mean .0000000
Std. Deviation 5.12381612
Most Extreme Differences Absolute .075
Positive .075
Negative -.054
Test Statistic .075
Asymp. Sig. (2-tailed) .200c,d
a. Test distribution is Normal. b. Calculated from data.
PPlot
LAMPIRAN VIII Uji Multikolinearitas
Coefficientsa
Model
Collinearity Statistics
Tolerance VIF
1 Persepsi .954 1.048
Kompetensi .950 1.052
Motivasi Kerja .953 1.049
a. Dependent Variable: Kinerja
Collinearity Diagnosticsa
Model Dimension
Eigenvalu e
Condition Index
Variance Proportions
(Constant) Persepsi Kompetensi
Motivasi Kerja
1 1 3.885 1.000 .00 .00 .00 .00
2 .053 8.549 .00 .80 .04 .29
3 .043 9.487 .01 .07 .57 .50
4 .019 14.315 .99 .12 .39 .21
LAMPIRAN IX UJI HETEROKEDASTISITAS
Coefficientsa
Model
Unstandardized Coefficients
Standardiz ed Coefficient
s
t Sig.
Collinearity Statistics
B Std. Error Beta
Toleran
ce VIF
1 (Constant) 2.017 1.752 1.151 .255
Persepsi -.036 .028 -.175 -1.292 .202 .954 1.048
Kompeten
si .032 .037 .116 .852 .398 .950 1.052
Motivasi
Kerja .004 .029 .020 .151 .881 .953 1.049
LAMPIRAN X
Model Regresi
Variables Entered/Removeda
Model
Variables Entered
Variables
Removed Method
1 Motivasi Kerja,
Persepsi, Kompetensi
. Enter
a. Dependent Variable: Kinerja b. All requested variables entered.
Model Summaryb
Model R R Square
Adjusted R Square
Std. Error of the Estimate
1 .801a .641 .622 5.26170
a. Predictors: (Constant), Motivasi Kerja, Persepsi, Kompetensi b. Dependent Variable: Kinerja
ANOVAa
Model Sum of Squares df Mean Square F Sig.
1 Regression 2724.213 3 908.071 32.800 .000b
Residual 1522.703 55 27.686
Total 4246.915 58
a. Dependent Variable: Kinerja
Coefficientsa
Model
Unstandardized Coefficients
Standardize d Coefficients
t Sig.
Collinearity Statistics
B Std. Error Beta
Motivasi
Kerja .403 .071 .472 5.711 .000 .953 1.049
a. Dependent Variable: Kinerja
Coefficient Correlationsa
Model Motivasi Kerja Persepsi Kompetensi
1 Correlations Motivasi Kerja 1.000 -.134 -.149
Persepsi -.134 1.000 -.144
Kompetensi -.149 -.144 1.000
Covariances Motivasi Kerja .005 -.001 -.001
Persepsi -.001 .005 -.001
Kompetensi -.001 -.001 .008
a. Dependent Variable: Kinerja
Collinearity Diagnosticsa
Mode
Condition Index
Variance Proportions (Constant
Motivasi Kerja
1 1 3.885 1.000 .00 .00 .00 .00
2 .053 8.549 .00 .80 .04 .29
3 .043 9.487 .01 .07 .57 .50
4 .019 14.315 .99 .12 .39 .21
Residuals Statisticsa
Minimum Maximum Mean Std. Deviation N
Predicted Value 13.0172 50.8849 39.8644 6.85341 59
Std. Predicted Value -3.917 1.608 .000 1.000 59
Standard Error of Predicted
Value .715 2.910 1.271 .515 59
Adjusted Predicted Value 13.4655 51.0752 39.8139 6.85978 59
Residual -10.65302 14.62330 .00000 5.12382 59
Std. Residual -2.025 2.779 .000 .974 59
Stud. Residual -2.048 2.917 .005 1.020 59
Deleted Residual -11.29681 16.10491 .05053 5.63134 59
Stud. Deleted Residual -2.111 3.143 .012 1.050 59
Mahal. Distance .087 16.760 2.949 3.451 59
Cook's Distance .000 .401 .026 .066 59
Centered Leverage Value .001 .289 .051 .059 59