THE ARCHAEOLOGICAL APPLICATION OF MULTI-SENSOR REMOTE SENSING
DATA IN QIN YONGCHENG SITE
Mengmeng Wang a, *, Yuqing Wan a, Zheng zhao b a
Meihang Remote Sensing Information CO., LTD, Xi’an 710199, P. R. China - [email protected] b Chinese Academy of surveying and mapping, Beijing 100830, P. R. China
KEY WORDS: remote sensing,archaeology,LST,Kautlr-Thomas Transformation,Principal Component Analysis
ABSTRACT:
Remote sensing archaeology bases on the use of remote sensing images and interpretation of the principles. The historic relics and sites are resulted from human activities and have constantly caused influences on the soil component, moisture content, temperature, vegetation growth and so on. Based on this thought, this paper proposed a new remote sensing model and approach that integrates optical and thermal infrared remote sensing data for archaeology. Taking the Qin Yongcheng site as the example, this method conducts a comprehensive analysis of key factors affecting archaeological application, that is, LST estimated with Landsat TM data, soil brightness, humidity and greenness obtained from GF-1 data, and then interprets the potential site targets. By conducting the field verification, it is shown that the interpreted potential sites are well consisted with the field investigations and have a high interpretation precision. It can provide a guide for further archaeological research.
Foundation support: Airborne Interferometric SAR High Precision Surveying and Mapping Innovative Cross Team Project-Large Scale Mapping Data Processing Method Research under Grants Q1634
* Corresponding author
1. INTRODUCTION
China is a vast country with a long history of ancient civilization and has rich cultural heritages. So it is significant to recognize the various information of the heritage for discovering the development of China and human history. With the rapid development of remote sensing technology, it has brought vitality to the archaeology because of its quick, dynamic and large-area monitoring. At present, how to extract information and ascertain analysis from remote sensing data and find out the historical monuments and relics is the key problem for archaeologists. This work aims to define and propose a methodology based on the integration of information extracted from GF-1 and Landsat7 satellite data and provide new ideas for the further study on archaeology.
Early in the beginning of the 20th century, archaeologists have used aerial photos to discover sites. Capper J. (1907) got images taken from a war balloon and represented Stonehenge from a point of view from which that famous monument has probably never before been photographed. Custer (1986) developed archaeological predictive models between site locations and environmental variables by applying Landsat remote sensing data, and the results show that the spectral reflectance from object around site locations is different from normal ones, which means that the environmental variables can be a measure for discovering site potential. Sever (1991) discovered and analysesed the surface and subsurface features of prehistoric roadways in Chaco Canyon by using TIMS (Thermal Infrared Multispectral Scanner) data. Since then, more and more remote sensing data, e.g., SAR data (Lu, 1997), hyperspectral data (Emmolo, 2004), are used for the study of ancient relics, and
offer the possibility of the archaeological application with multi-sensor data.
2. METHODOLOGY
2.1 Land surface temperature
Retrieving LST (land surface temperature) is a very important application field of thermal infrared remote sensing. Now there are three common methods: radiation transfer equation, single-window algorithm and single channel algorithm. This work chooses the radiation transfer equation to do research which refers to subtract radiation influenced by atmosphere from total thermal radiation. The simplified equation is given below:
The International Archives of the Photogrammetry, Remote Sensing and Spatial Information Sciences, Volume XLII-2/W7, 2017 ISPRS Geospatial Week 2017, 18–22 September 2017, Wuhan, China
This contribution has been peer-reviewed.
Vegetation and soil are important interpretation signs in remote sensing archaeology (Zhu, 1988). It is well known that the historic relics and sites are resulted from human activities. Because of the soil structure changes caused by building sites, the site soil is different from natural one in soil component and colour, as shown in Figure 1. Besides, the different soil further leads to the difference of moisture content, temperature, vegetation growth and so on. So we choose brightness, moisture content, LST and greenness as interpretation signs to find potential sites.
Figure 1. Difference of soil component and colour
2.3 Methodology
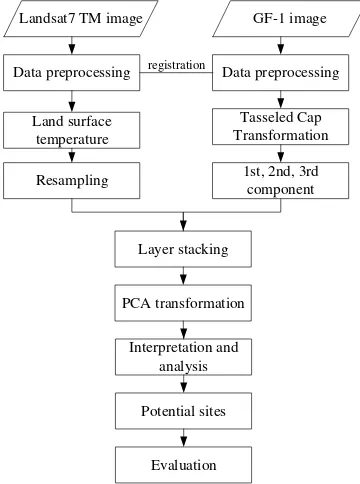
The main goal of this paper is to define and propose a methodology based on the integration of information extracted from Landsat7 TM image and GF-1 image. The flow chart of this method is shown as Figure 2.
Landsat7 TM image
Figure 2. Flow chart of experiment
Step 1: Data preprocessing is needed for all images, such as radiometric correction, data fusion, ortho-rectification and so on. And it should be stressed that registration must be done between multi-sensor images.
Step 2: LST is estimated with radiation transfer equation by using Landsta7 TM thermal infrared band data.
Step 3: The brightness, humidity and greenness component information are obtained with the Tasseled Cap Transformation by using the multi-spectral fusion data of GF-1 satellite. Step 4: The LST, brightness, humidity and greenness components, key factors affecting the archaeological application, are stacked to a new image, which then is transformed by using PCA (Principal Component Analysis) algorithm to interpret, analyze and identify potential older remains.
Step 5: The potential sites are evaluated.
3. EXPERIMENTAL RESULTS AND ANALYSIS
3.1 Study area and data
The study area is the Qin Yongcheng site located in the southern suburb of Fengxiang country, which is a protected national heritage site and consisted of three parts: city site, Qingong cemeteries and ordinary people burial area. This paper is mainly concerned with the Qingong cemeteries, until now there are fourteen cemeteries have been found.
The dataset used in this experiment are Landsat7 TM data and GF-1 data, the former is rich in spectral information with multispectral resolution 15m and thermal infrared resolution 30m, the latter is high in resolution with multispectral resolution 8m and panchromatic resolution 2m. And the combination of these two types of complementary images can make the best use of their advantages. Different from conventional time-effectiveness remote sensing interpretation, sites interpretation has low demand on time. In fact, if sites already were here, without any major incidents, the effect of sites on soil component, LST, soil moisture and vegetation would be permanent. Thus, this paper chose Landsat7 TM data on 23 August 2000 with less human’s influence. And GF-1 image was acquired on 4 January 2014. The Figure 3 shows GF-1 true-colour fusion image (2m) using Gram-Schmidt spectral sharpening method.
Figure 3. GF-1 true-colour fusion image
3.2 Results
In the paper, radiation transfer equation, Tasseled Cap Transformation and PCA algorithm are used to calculate relevant components to the interpretation signs of older remains. Because LST is kind of regional phenomenon, we choose the linear resampling method to interpolate to 2m resolution. The Figure 4 shows the initial LST and resampled LST data.
The International Archives of the Photogrammetry, Remote Sensing and Spatial Information Sciences, Volume XLII-2/W7, 2017 ISPRS Geospatial Week 2017, 18–22 September 2017, Wuhan, China
This contribution has been peer-reviewed.
Initial LST Resampled LST Figure 4. Landsat7 initial and resampled LST inversion data The Tasseled Cap transformation projects image to the three-dimensional space refers to the comprehensive transformation matrix determined from experience. It is an image processing method of linear feature transformation, which can fully reflect the land change information, vegetation growth, atmospheric scattering effects and other changes. The Figure 5 shows the first three components, that is, soil brightness, greenness, humidity.
Soil brightness Greeness
Humidity
Figure 5. The first three components inversed from GF-1 Tasseled Cap transformation
The PCA transform is created based on the statistical characteristics Dimensional linear transformation, and the mathematical transformation is called K-L. It converts intercorrelated multispectral bands into a new set of uncorrelated components. Generally sites represent as weak information on images, so the forth component was chosen to interpret, analyze and identify older remains. The Figure 6 shows the forth component inversed from the stacking data.
Figure 6. The forth component inversed from stacking data
3.3 Analysis and evaluation
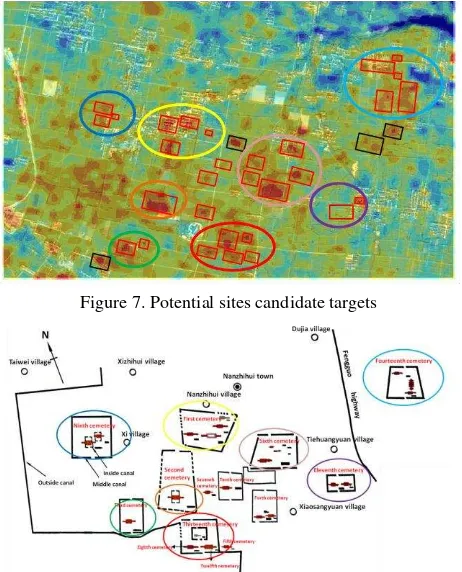
Based on differences caused by sites and spatial distributive characteristics of sites, we identified some potential candidate targets shown in Figure 7, which is based on the GF-1 true-colour image and set the transparency of fourth component data to 50%. In order to verify the effectiveness of the proposed method, we conduct an outdoor experiment and found that the results are well correspondence to the existed location data of sites. To better show the correspondence, the same-colour area is labelled the same sites location in Figure 7 and Figure 8, where the red-colour rectangular boxes in Figure 7 corresponds to the existed sites in Figure 8, and the black-colour ones are likely candidate targets required further verification by archaeologists.
Figure 7. Potential sites candidate targets
Figure 8. The existed sites location distribution
4. CONCLUSION
In this paper, we proposed a methodology based on the integration of information extracted from Landsat7 TM image and GF-1 image. This method combines the key factors affecting the archaeological application, LST, soil brightness, humidity and greenness, to interpret, analyze and identify sites. And the results show that the potential sites targets interpreted by this method are consisted well with the field investigations and have a high interpretation precision. It can provide a guide for next archaeological research and need for further study.
REFERENCES
Capper, J., 1907. Photographs of Stonehenge as seen from a war balloon. Archaeologia, 60, pp. 69-70.
The International Archives of the Photogrammetry, Remote Sensing and Spatial Information Sciences, Volume XLII-2/W7, 2017 ISPRS Geospatial Week 2017, 18–22 September 2017, Wuhan, China
This contribution has been peer-reviewed.
Custer, J. F., Eveleigh, T. and Klemas V., 1986. Application of Landsat data and synoptic remote sensing to predictive models for prehistoric archaeological sites: an example from the Delaware coastal plain. American Antiquity, 51, pp. 572-588. Deng, B., Guo, H. D., Wang, C. L. and Nie, Y. P., 2010. Applications of remote sensing technique in archaeology: a review. Journal of Remote Sensing, 14(1), pp. 197-206. Deng, B. and Guo, H. D., 2010. A review of remote sensing applications in archaeological. Remote Sensing Information, 1, pp. 110-116.
Emmolo, D., Franco, V., Brutto, M. L. and Villa, B., 2004. Hyperspectral techniques and gis for archaeological investigation. ISPRS(C).
Lu, X. Q., Guo, H. D., Yun. S.,1997. Detection of the Great Wall using SIR-C data in North-Western China. Geoscience and Remote Sensing, 1997. IGARSS '97. Remote Sensing - A Scientific Vision for Sustainable Development. 1997 IEEE International. IEEE, 1, pp. 50-52.
Sever, T. L. and Wagner, D. W., 1991. Analysis of prehistoric roadways in Chaco Canyon using remotely sensed digital data. Trombold C. Ancient Road Networks and Settlement Hierarchies in the NewWorld. Cambridge: Cambridge University Press.
Zhu, D. L., 1988. Methods and examples of remote sensing archaeology in abroad. Remote Sensing Information, 3, pp. 36+43.
The International Archives of the Photogrammetry, Remote Sensing and Spatial Information Sciences, Volume XLII-2/W7, 2017 ISPRS Geospatial Week 2017, 18–22 September 2017, Wuhan, China
This contribution has been peer-reviewed.