A PAN-SHARPENING METHOD BASED ON GUIDED IMAGE FILTERING: A CASE
STUDY OVER GF-2 IMAGERY
Yalan Zheng a, Mengxiao Guo a, Qinling Dai b, c, Leiguang Wang a,
a School of Forestry, Southwest Forestry University, Kunming, China, 650224
b School of Printing and Packaging, Wuhan University, Wuhan, China, 430079 c School of Material Engineering, Southwest Forestry University, Kunming, China, 650224
KEY WORDS: Remote Sensing, Image Fusion, Pan-sharpening, Guided Filter, GF-2 Imagery.
ABSTRACT:
The GaoFen-2 satellite (GF-2) is a self-developed civil optical remote sensing satellite of China, which is also the first satellite with the resolution of being superior to 1 meter in China. In this paper, we propose a pan-sharpening method based on guided image filtering, apply it to the GF-2 images and compare the performance to state-of-the-art methods. Firstly, a simulated low-resolution panchromatic band is yielded; thereafter, the resampled multispectral image is taken as the guidance image to filter the simulated low resolution panchromatic Pan image, and extracting the spatial information from the original Pan image; finally, the pan-sharpened result is synthesized by injecting the spatial details into each band of the resampled MS image according to proper weights. Three groups of GF-2 images acquired from water body, urban and cropland areas have been selected for assessments. Four evaluation metrics are employed for quantitative assessment. The experimental results show that, for GF-2 imagery acquired over different scenes, the proposed method can not only achieve high spectral fidelity, but also enhance the spatial details.
1. INTRODUCTION
With the rapid development of remote sensors, a great deal of optical earth observation satellites and digital aerial cameras can simultaneously obtain high spectral resolution multispectral (MS) and high spatial resolution panchromatic (Pan) images (Yun, 2012). However, due to the physical constraints, the spectral information is only rich in MS images, and it is difficult to acquire the images with both high spatial and spectral resolution. The images obtained from a single sensor often cannot meet applications, such as visual interpretation, change detection and detailed land cover classification, etc. Therefore, it is increasingly important to combine the strengths of the MS and Pan images (Dong, 2009) and (Ehlers, 2010).
To date, a large number of pan-sharpening methods have been
Corresponding author: Leiguang Wang; Email:[email protected]
proposed. Among them, component substitution (CS) (Qizhi, 2014) methods are more practical and widely used because of its fast speed in calculation and convenient implementation. The representative CS methods include principal component analysis (PCA), Gram-Schmidt transformation (GS), Intensity-Hue-Saturation (IHS) and University of New Brunswick (UNB) method (Zhang, 2004), etc. However, with more and more sensors with different spectral and spatial properties were launched, these existing methods show various limitations, and have not fully assessed on data sets captured by the new sensors (Zhang, 2004).
0.8 meter with a swath of 48 kilometers in panchromatic mode, in contrast, 3.2 meter and 4 spectral bands in multispectral mode.
In this context, a pan-sharpening method based on guided image filtering is proposed and applies to GF-2 images. Experimental results show that the proposed method can achieve a better effectiveness on spectral information preservation and spatial detail enhancement.
2. PROPOSED PAN-SHARPENING METHOD
2.1 Guided Image Filtering
The guided image filtering is firstly proposed by He et al. (He, 2013) in 2010. It is quite popular due to its edge-preserving property and is widely used for combining features from two different source images, such as image matting/feathering (Levin, 2006), flash/no-flash de-noising (Petschnigg, 2004), HDR compression (Durand, 2002) and haze removal (He, 2011), etc. By using the guidance image to affect the process of filtering, the original image can be smoothed, meanwhile, the gradient information of the guidance image can also be retained.
The guided image filter (He, 2013) assumes that the filtering output is a local linear model between the filter output Q and
the guidance image
I
in a local window
k centered at pixelb are computed by minimizing the following cost function:
( , ) [( )2 2]
k
k k i k i k i k
E a b
a I b p
a (2)where
is a regularization parameter that set up by users and preventsakfrom being too large. The linear coefficients aredirectly resolved by the linear ridge regression (Draper, 1981) as follows:
. However, all windows that contains i will involve the pixeli, so different windows will have different values of Qi. Then
one effective method to resolve this problem is to average all the possible values of Qito obtain the filtering output image Q.
Therefore, after calculating
,
k k
a b for all windows
k in theimage, the filter result is computed by:
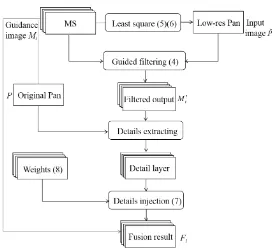
As shown in Figure 1, this proposed pan-sharpening method consists of the following four procedures:
(1) The original multispectral image is registered and resampled as the same size as the Pan imageP.
(2) By minimizing the residual sum of squares (5), the weights
i
resolution panchromatic image
P
can be obtained.4
which is constant for the given band. (3) Take each
i
M (with
i
1, 2,3, 4
) as the guidanceimage to guide the filtering process of low resolution Pan
image
P
, and then obtain the filter output Mi (with1, 2,3, 4
i
) respectively.(4) The pan-sharpening result Fiis obtained by extracting the
spatial information of the Pan image, and injecting into the resampled MS image Miaccording to weight i(x, y), its
is obvious that the greater the distance, the smaller the weight; otherwise, the weight should be large.
3. EXPERIMENTAL RESULTS AND COMPARISONS
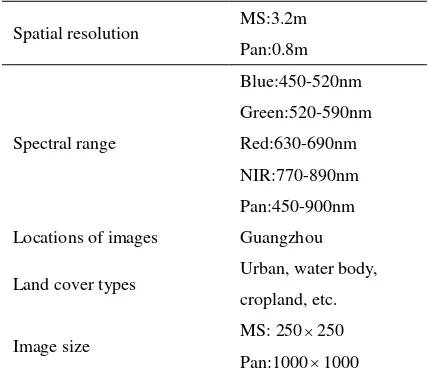
3.1 Experimental Setting
For analysis and comparison of the proposed and other pan-sharpening methods, three pairs of Gaofen-2 imagery were selected for test in this paper. Table 1 shows the characteristics of this dataset. The test images were acquired over Guangzhou, China, three scenes including urban, water body and the cropland areas. The MS image consists of four bands and the spectral range of the MS bands is exactly covered by the range of the Pan band. The size of each image is 10001000. Locations of images Guangzhou
Land cover types Urban, water body, cropland, etc.
Image size MS: 250250
Pan:10001000
Table 1. Characteristics of the employed GF-2 datasets
In order to verify the effectiveness of the proposed approach, three state-of-the-art fusion methods, including the GS transformation (Laben, 2000) and NND method (Sun, 2014) in ENVI software, and UNB method (Zhang, 2004) in PCI Geomatica software, were employed in the experiments for comparison.
3.2 Assessment Metrics
Four widely used metrics are selected for quantitative assessment, they are the entropy, the correlation coefficient (CC) (Klonus, 2007), the universal image quality index (UIQI) (Wang, 2002) and the relative dimensionless global error in synthesis (ERGAS) (Ranchin, 2000). The resampled MS image is taken as the reference image.
1) The entropy can be used to measure how many spatial information that the fused image contains. The higher the entropy is, the better the quality of the fused image will be. Its
definition is as follows:
probability of pixel value i in the image.
2) CC (Klonus, 2007) measures the correlation between the MS image and the fused image. The higher correlation value indicates a better correspondence between the MS image and the fused image. It is expressed as:
1 1
fused image, and CC is calculated globally for the entire image.
3) UIQI (Wang, 2002) models any distortion as a combination of three different factors: loss of correlation, luminance distortion and contrast distortion. Its definition is given by:
2 2 2 2the fused and original images respectively.
4) ERGAS (Ranchin, 2000) evaluates the overall spectral distortion of the pan-sharpened image. It is defined as:
3.3. Results and Performance Comparison
As shown in Fig. 2 to Fig. 4, local patches with size of 400×600 pixels over different land cover types are clipped from the fused results and displayed in true color with the same stretching mode. Table 2 to Table 4 correspond to these quantitative evaluation results. The best performance of each metric is in bold.
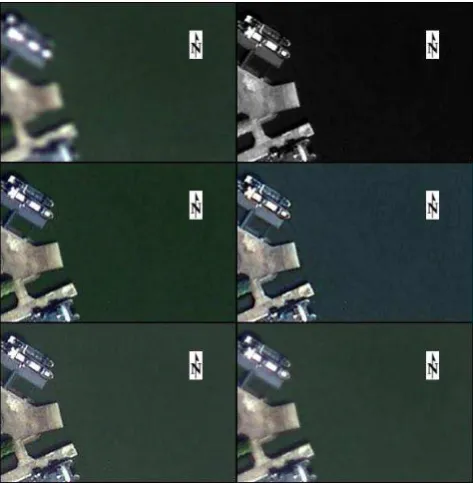
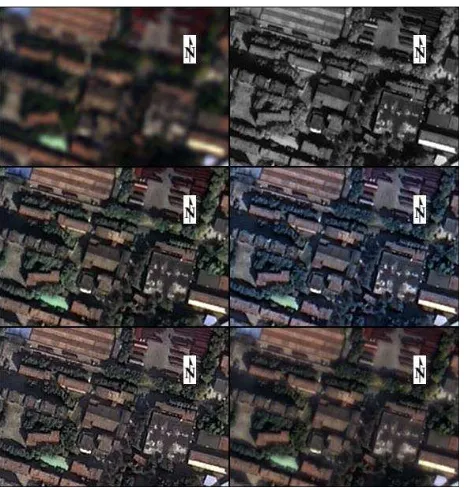
After the visual comparison, the fused images yielded by the NND method have obvious spectral distortion on the green vegetation regions, especially the Figure 3 and Figure 4, not match the original deep green color. This may be due to the NND method is more suitable for fusing low resolution images, like Landsat 7 data, etc. While UNB and GS methods achieve excellent performance on spatial quality. Moreover, as it can be seen from all these figures, the proposed method has better effectiveness especially on spectralfidelity.
Figure 2. The fused images with different methods of GF-2
image over the water body. From left to right, up and down:
MS; PAN; GS; NND; UNB and the proposed method.
Table 2. Quality evaluation of fused images: Water body
(corresponding to Figure 2). The best performance of each
metric is in bold.
For quantitative assessments, all of the metric scores of the proposed method are the best in Table 2 and Table 4. In Table 3,
the ERGAS value of the proposed method is the second best, but other metrics are all the best. This demonstrates that the proposed method achieves better performance on spectral preserving and spatial enhancement than other methods. It can attribute to the edge-preserving feature of the guided filtering, on the other hand, it is also because the proposed method takes advantage of the proper weights to inject the spatial details into each band of the resampled MS image. Furthermore, the results of quality assessment also agree with the visual comparison.
Figure 3. The fused images with different methods of GF-2
image over the urban. From left to right, up and down: MS;
PAN; GS; NND; UNB and the proposed method.
Table 3. Quality evaluation of fused images: Urban
(corresponding to Figure 3). The best performance of each
metric is in bold.
Figure 4. The fused images with different methods of GF-2
image over the cropland. From left to right, up and down: MS;
PAN; GS; NND; UNB and the proposed method.
Table 4. Quality evaluation of fused images: Cropland
(corresponding to Figure 4). The best performance of each
metric is in bold.
4. CONCLUSION
In this research, a pan-sharpening method based on guided image filtering is proposed, and applying it to GF-2 images. A great number of experimental results and quality assessments have demonstrated that, for GF-2 imagery acquired over different scenes, the proposed method can consistently achieve high spectral fidelity and enhance the spatial details independent of the content of the images. Furthermore, how to adaptively select the window size of weight calculation and estimate the parameters of guided filtering will be future researches.
Method Entropy UIQI CC ERGAS
MS 6.395
GS 6.187 0.843 0.874 20.542
NND 6.060 0.689 0.861 42.647 UNB 5.816 0.785 0.866 25.974 Proposed 6.315 0.936 0.954 21.262
Method Entropy UIQI CC ERGAS
MS 6.865
ACKNOWLEDGEMENT
This project is supported by national Natural Science Foundation of China under grants of 41571372 and 41301470.
REFERENCES
Dong J, Zhuang D, Huang Y, Fu J. Advances in Multi-Sensor Data Fusion: Algorithms and Applications[J]. Sensors. 2009,9(10):7771-84.
Draper, N., Smith, H. Applied Regression Analysis. 2 edn. John Wiley (1981)
Durand, F., Dorsey, J. Fast bilateral filtering for the display of high-dynamic-range images. SIGGRAPH (2002)
Ehlers M, Klonus S, Johan Åstrand P, Rosso P. Multi-sensor image fusion for pansharpening in remote sensing[J]. International Journal of Image and Data Fusion. 2010,1(1):25-45.
He K, Sun J, Tang X. Guided Image Filtering [J]. IEEE Transactions on Pattern Analysis and Machine Intelligence. 2013,35 (6):1397-409.
He K, Sun J, Tang X. Single Image Haze Removal Using Dark Channel Prior[J]. IEEE Transactions on Pattern Analysis and Machine Intelligence. 2011,33(12):2341-53.
Klonus, S. and Ehlers, M. Image fusion using the Ehlers spectral characteristics preserving algorithm. GIScience and Remote Sensing, 2007, 44 (2): 93–116.
Laben CA, Brower BV. Process for enhancing the spatial
resolution of multispectral imagery using pan-sharpening. Google Patents; 2000.
Levin, A., Lischinski, D., Weiss, Y. A closed form solution to natural image matting. CVPR (2006)
Petschnigg, G., Agrawala, M., Hoppe, H., Szeliski, R., Cohen, M., Toyama, K. Digital photography with flash and no-flash image pairs. SIGGRAPH (2004)
Qizhi X, Bo L, Yun Z, Lin D. High-Fidelity Component Substitution Pansharpening by the Fitting of Substitution Data[J]. Geoscience and Remote Sensing, IEEE Transactions on. 2014,52(11):7380-92.
Ranchin T, Wald L. Fusion of high spatial and spectral resolution images_The ARSIS concept and its implementation[J]. Photogrammetric Engineering & Remote Sensing. 2000,66(1):49-61.
Sun W, Chen B, Messinger DW. Nearest-neighbor diffusion-based pan-sharpening algorithm for spectral images [J]. Optical Engineering. 2014, 53(1):013107.
Wang Z, Bovik AC. A universal image quality index[J]. IEEE Signal Processing Letters. 2002,9(3):81-4.
Yun Z, Mishra RK, editors. A review and comparison of commercially available pan-sharpening techniques for high resolution satellite image fusion. Geoscience and Remote Sensing Symposium (IGARSS), 2012 IEEE International; 2012 22-27 July 2012.