TOPOLOGICAL RELATIONS-BASED DETECTION OF SPATIAL INCONSISTENCY IN
GLOBELAND30
Shun Kang a,b*, Jun Chen b, Shu Peng b
a College of Geoscience and Surveying Engineering, China University of Mining and Technology (Beijing), Beijing 100083,
China, [email protected]
b National Geomatics Center of China, Beijing 100830, China, (chenjun, pengshu)@nsdi.gov.cn
ISPRS ICWG III/IVb
KEY WORDS: Data Quality, Topological Relations, Spatial Inconsistency, Detection, Globeland30, Raster Format
ABSTRACT:
Land cover is one of the fundamental data sets on environment assessment, land management and biodiversity protection, etc. Hence, data quality control of land cover is extremely critical for geospatial analysis and decision making. Due to the similar remote-sensing reflectance for some land cover types, omission and commission errors occurred in preliminary classification could result to spatial inconsistency between land cover types. In the progress of post-classification, this error checking mainly depends on manual labour to assure data quality, by which it is time-consuming and labour intensive. So a method required for automatic detection in post-classification is still an open issue. From logical inconsistency point of view, an inconsistency detection method is designed. This method consist of a grids extended 4-intersection model (GE4IM) for topological representation in single-valued space, by which three different kinds of topological relations including disjoint, touch, contain or contained-by are described, and an algorithm of region overlay for the computation of spatial inconsistency. The rules are derived from universal law in nature between water body and wetland, cultivated land and artificial surface. Through experiment conducted in Shandong Linqu County, data inconsistency can be pointed out within 6 minutes through calculation of topological inconsistency between cultivated land and artificial surface, water body and wetland. The efficiency evaluation of the presented algorithm is demonstrated by Google Earth images. Through comparative analysis, the algorithm is proved to be promising for inconsistency detection in land cover data.
* Corresponding author
1. INTRODUCTION
Land cover products play a key role in environment assessment, land management, and biodiversity protection (Godinho, 2016; Eitelberg, 2016; Salvati, 2013), etc. With the availability of remote sensing image at little to no cost for users, land cover mapping and updating have become more feasible (Mack, 2017; Chen, 2017; Gómez, 2016). Although land cover data has been widely produced, its data quality is still beyond satisfaction (Grekousis, 2015; Bai, 2014). Data quality control is the set of operational techniques and activities that are used to attain the quality required for a data product (Wang, 1995). Inconsistency, as one of the crucial factors associated with data quality, refers to some clear often specific contradictions, being explicit incoherent with others or does not follow a particular pattern (Zhang, 2011), and can be classified into reality inconsistency and logical inconsistency (Heipke, 2008; Chen, 2014). In logical, consistency is typically identified as database norm, data dependencies or integrity constraints in relational database. In geospatial database, consistency constraints are extended to topological, semantic, and user rules (Fan, 2015; Cockcroft, 1997), and any violates database norms or spatial rules can be regarded as data inconsistency. For topological relations, it mainly refers to the shape of spatial object, but semantic scene must be taken into account to decide whether a topological relation is right or not (Ubeda, 1997). So taking semantics of objects or their meaning into account, consistent or inconsistent topological relations detection is a practical guide to find data inconsistency and achieve data quality control.
In academic community, for inconsistency detection in topological relations, some representative researches have been done, such as the contextual correction method (Groom, 1996), a topology-based spatial representation defined by Gadish to discover rules and detect inconsistencies (Gadish, 2001), and a topological chain model for detecting conflicts between rivers and contours (Chen, 2007), as well as in the context of offshore area, spatial adjacency-assisted classification for separation of building class and beach class was proposed (Qiao, 2011), and adjacency relationship for water and wetland was utilized to verify the misclassification, such as wetlands that are far from water according to customer defined distance (Cai, 2006), as well as the unique spatial relationship between water body and emerged plant, building and its shadow in high resolution remote sensing image (Qiao, 2015). Additionally, for land use data updating, in order to assure data quality, spatial and temporal constraint rules have been established and performed to detect inconsistency (Xiao, 2013).
consists of a grids extended 4-intersection model (GE4IM), and based on nature rules constructed between raster layers in GlobeLand30 that govern topological relations between pairs of objects, and an algorithm of region overlay for the computation of spatial inconsistency. Taking GlobeLand30 wetland and water body, artificial surface and cultivated land for example, spatial objects that violate universal nature rules can be detected.
The organization of this paper is as follows: in section 2, problem statement for topological inconsistency between land cover types is provided by involved instances. In section 3, an inconsistency detection method is proposed, including a grids extended 4-intersection model (GE4IM) and an algorithm of region overlay. In section 4, through experiment and analysis, objects violating nature rules can be detected, and taking available Google Earth images as ground truth, the validity of the proposed algorithm is confirmed. In Section 5, the conclusion is drawn, and the future work is expected.
2. TOPOLOGICAL INCONSISTENCY BETWEEN LAND COVER TYPES
The trend of mapping high resolution land cover product is becoming available with the increasing development of earth observation technology. In 2010, a Globe Land Cover (GLC) mapping project was launched by China and the 30m GLC product GlobeLand30 was produced with 10 classes for year 2000 and 2010 (Chen 2014, 2015). Through overall data quality assessment, GlobeLand30 is proved to be a fine-scale and useful product for land cover characterization and validation (Arsanjani, 2016). Under the background of GlobeLand30, in the stage of post-classification processing, misclassifications produced because of spectral similar need to be found and verified for data quality control.
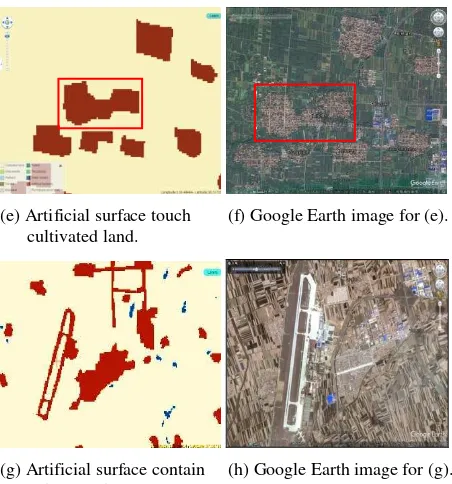
In spatial relations respect, the topological relations between misclassification objects performed to be illogical. Taking GlobeLand30 for year 2010 water body and wetland for examples, as wetland is the transition zone for land and water body, usually it has a touch relationship with water body, for example the truth relationship between water body and reservoir wetland shown in figure 1(a). Referencing by Google Earth image we can see that this classification is indeed consistent with reference. While in figure 1(c), this wetland object is suspected to be incorrect because the neighbour of which doesn't include water body in the upstream of the reservoir dam, or an omission error for water body nearby is committed. For cultivated land and artificial surface, if artificial surface for residents touch cultivated land, as shown in figure 1(e), it is reasonable in nature law, such as Google Earth image 1(f) shown. If land use for transportation contains cultivated land, then the cultivated land classification is a commission error, as figure 1(g) and 1(h) shows that cultivated land is contained by airport pavement; if the cultivated land is classified into grass land, it becomes legal as figure 1(i) and reference figure 1(j) shown. according to classification schema in land cover data, as artificial surface in GlobeLand30 includes transportation land use, residential land use, and industrial land use, for contain relation between cultivated land and artificial surface, it seemingly certain but at the same time uncertain, for example in figure (k) and figure (m), through Google Earth image (l) and (n), we can see that the relationship that artificial surface contains cultivated land in GlobeLand30 is uncertain due to spatial complexity. So taking one type as reference type, if the topological relation between target type and reference type contradicts the real relation in ground truth, then the target type
is misclassified or omission error exists. In GlobeLand30, numerical value 80 stands for artificial surface, 10 cultivated land, 50 wetland, and 60 water body. From above, these universal topological relations can be summarized as below. Type 1: If 80 touch 10, then this spatial relation is consistency. Type 2: If 80 contain 10, then inconsistency is detected. Type 3: If 50 touch 60, then this spatial relation is consistency. Type 4: If 50 disjoint 60, then inconsistency is detected. In land cover data, based on land cover classification schema, the higher thematic resolution the more topological relations have in semantic scene.
(a) Wetland touch water body. (b) Google Earth image for (a).
(c) Wetland disjoin water body. (d) Google Earth image for (c).
(e) Artificial surface touch (f) Google Earth image for (e). cultivated land.
(i) Artificial surface touch (j) Google Earth image for (j). grass land.
(k) Illogical contain relation (l) Google Earth image for (k)
(m) Logical contain relation (n) Google Earth image for (m)
Figure 1. Topological relationships between land cover types.
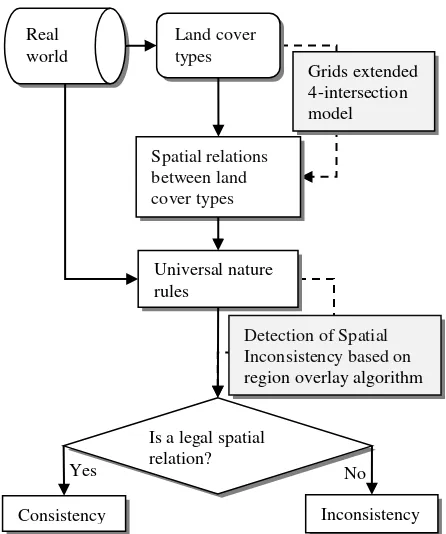
For these commission or omission errors, their findings mainly depend on manual checking based on geospatial knowledge in post-classification (Zhang, 2016), by which it is time-consuming and human labouring intensive. So automatic methods of costing less time and reducing manual intervention to check data inconsistency in land cover mapping has become an open issue. From view of topological relations for land cover types, through topological relation constraint construction and calculation, the framework for data inconsistency detection is proposed in this paper, as shown in figure 2.
Figure 2. A framework for detection of spatial inconsistency.
3. DETECTION METHOD FOR SPATIAL INCONSISTENCY BETWEEN LAND COVER TYPES 3.1 Representation for Topological Relations in Raster From a discrete point of view, the surface can be modelled as a lattice in Z2. Usually, the lattice is defined in a specialized Euclidean space where there is only one value assigned to a position appointed, i.e. the single-valued space (Liu, 2008). An important typical concept is tessellation or grids, such as land cover, habit map and DEM, etc. In order to model the relationships between target class and reference class in land cover data, according to its characteristics that it cannot have two different type values in the same spatial location, a grids extended 4-intersection model (GE4IM) is defined. This GE4IM model can be illustrated as below matrix (3.1), and three meaningful spatial relations can be formulated. Topological relations between type A and type B can be defined as figure 4 shown including disjoint, touch, contain or contained-by relation.
(3.1)
where = intersection operator
EO = extending outward operator for edge pixels
Figure 3. Illustration for EO operator.
Land cover types
Spatial relations between land cover types
Universal nature rules
Detection of Spatial Inconsistency based on
region overlay algorithm Grids extended 4-intersection model
Is a legal spatial relation?
Consistency Inconsistency
Yes No
(a) Disjoint (b) Contain (c) Contained-by (d) Touch Figure 4. Three different topological relations.
3.2 Algorithm Design for Detection of Spatial Inconsistency Every adjacent spatial entity in geo-location has specific semantic or meaning. Topological rules specify relations between entity classes (Mäs, 2007). For land cover data, except for geometry attribute, there is sematic association for each other, such as co-location pattern. In order to control detection robustness,all of the suspect inconsistency should be detected in spatial relationships. Data inconsistency can be detected automatically using the algorithm of region overlay.
Algorithm: Region overlap
Input: a data tile of land cover LCU, null point shapefile markinc, parameters of land cover type plc1, plc2
Output: inconsistent point shapefile markinc.
Step 1. Assembling the same pixel value to object O = {O1,O2,…,On} using 8-neighborhood region group operation 8(pixels), O 8(pixels). Step 2. Searching and extracting checking object Oco by plc1
input, Oco Seo(co), (co = 1,2,…,n).
Step 3. Extending checking object Oco to Oeco using extending operator ₪(∙), Oeco₪(Oco).
Step 4. Set TĐ through local plus operator Ů(∙), setting TĐ Ů(Oeco,LCU).
Step 5. According to reference object Oro, by plc2 input if (Oco + Oro) TĐ, then touch relationship was established; else if (Oco + Oro) TĐ, then contain/contained-by relation was established; else (Oco + Oro) TĐ, then disjoin relation was established.
Step 6. According to the topological rules constructed, if the relation calculated subject to a specified rule, then Oco is judged to be consistency or inconsistency, its representative point was recorded in markinc. Step 7. Goto Step 5 until co == n.
Step 8. Stop.
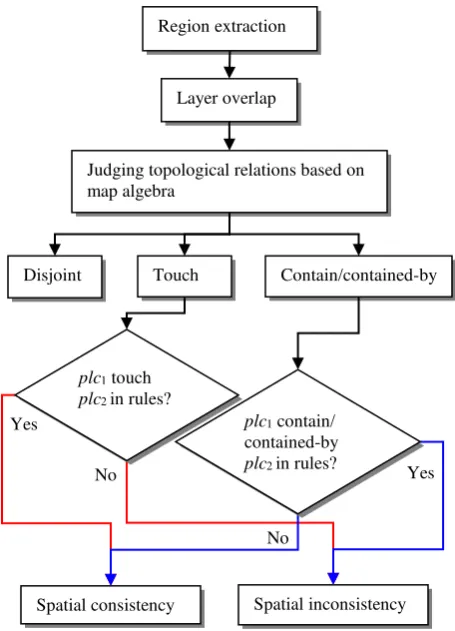
Figure 5. The underpinning for algorithm of region overlap
4. EXPERIMENT AND ANALYSIS
According to principles and underpinnings represented above, data inconsistency detection for land cover GlobeLand30 has been realized with Microsoft Visual Studio 2008 + ArcEngine 9.3 using the programming language C# in dotNET platform.
4.1 Study Area
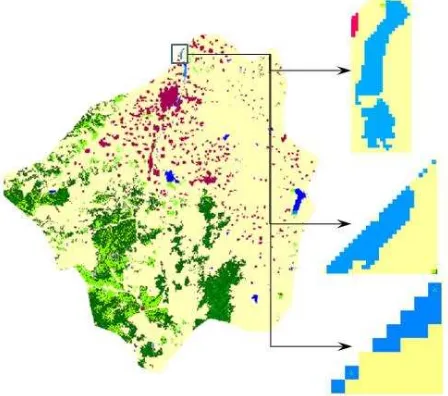
In order to evaluate the feasibility of the inconsistency detection methods, the area of interest was chosen to be inland Shandong Linqu County (Lng 118.53°E, Lat 36.51°N) located in the middle of Shandong peninsula, as figure 6 shown. The land cover data GlobeLand30 can be freely downloaded from http://www.globallandcover.com/GLC30Download/index.aspxa s, as figure 7 shown.
(a) (b)
Figure 6. Land cover data for Shandong Linqu County, China. (a) Land cover for year 2010. (b) Land cover for year 2000.
Region extraction
Layer overlap
Judging topological relations based on map algebra
Disjoint Touch Contain/contained-by
Spatial consistency Spatial inconsistency plc1 touch
plc2 in rules?
plc1 contain/ contained-by plc2 in rules? Yes
No Yes
Figure 7. GlobeLand30 website.
4.2 Detection of Artificial Surface Contain Cultivated Land For contain or contained-by topological relation inconsistency detection between artificial surface and cultivated land, according to topological rules, the illegal topological relationship for cultivated land contained-by artificial surface for year 2010 was pointed out by the single point shapefile. The time consuming for this inconsistency detection was performed within 6 minutes, and the results of inconsistency detection can be seen in figure 8. In this area, there are three objects were point out.
Figure 8. Inconsistency detection for artificial surface contain cultivated land in study area for year 2010.
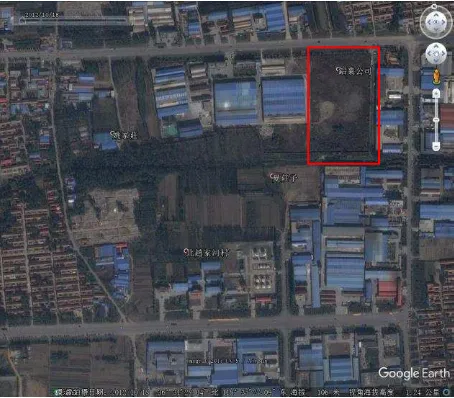
In order to validate the effectiveness of inconsistency detected, available Google Earth images are chosen to be regarded as ground truth, referencing by which we found that some of the objected detected are reasonable while some are not. For example the cultivated land S1 in figure 8, it is MMU (Minimum Mapping Unit) classification, referencing by corresponding Google Earth image, it is proved to be a false classification in deed, as closed rectangle in figure 9 shown, and it does not represent the contained-by relationship between cultivated land and artificial surface. For S2 and S3 detected, through Google Earth image validation as shown in figure 10 and figure 11, referencing by closed rectangle, we can see that the classification in land cover data are true partially, not consistent with ground truth completely. In figure 10, the land cover type in yellow rectangle is consistent with S2 in figure 8, but the red rectangle is also a part of it, should be classified cultivated land too, but in land cover data it is classified to be artificial surface. In figure 11, the cultivated land is contained-by residential land, industrial land and transportation land. From the Google Earth image we can see that the cultivated
land in reality is much larger than that S3 in figure 8, so the red rectangle in figure 11 should be cultivated land too.
Figure 9. Available Google Earth image 2012 for S1.
Figure 10. Available Google Earth images 2012 for S2.
Figure 11. Available Google Earth images 2012 for S3. S1
S2
4.3 Detection of Water Body Touch Wetland
For topological relation between wetland and water for year 2000, through topological relationship calculation, wetland without neighbourhood of water body can be detected, as shown in figure 12. Referencing by Google Earth image as figure 13 shown, we can see that the yellow rectangle part is water storage reservoir, and the detected wetland parts are in the upstream of the water storage reservoir; there should not be wetland only, so the water body is omission classified.
From experiment we can see that inconsistency detection based on topological relationships between spatial objects not only depends on the land cover classification schema but also topological rules. Through spatial inconsistency detection, besides the topological inconsistency between spatial objects can be found, the omission error can be pointed out, as well as the commission error in object shape. As rules are optional, subjective, and regional dependent, so sometime the inconsistency detected need to be further checked by human labour.
Figure 12. Inconsistency detection for wetland without neighbour of water in study area for year 2000.
Figure 13. Available Google Earth image 2009 for inconsistency detected in figure 10.
5. CONCLUSIONS
As the land cover data quality is immensely important for spatial modelling, spatial query, spatial analysis and spatial decision, etc., so how to find the data inconsistency occurred in land cover mapping is a critical task. In this paper, according to the data structure of GlobeLand30, an inconsistency detection method is designed including a grids extended 4-intersection model (GE4IM) for topological representation. Topological relations, such as disjoint, touch, contain or contained-by are represented, and an algorithm of region overlay to detect data inconsistency in GlobeLand30 by region extraction and overlay operator. Through experiment and efficiency evaluation, taking topological rules between artificial surface and cultivated, water body and wetland for instance, the algorithm is demonstrated to be promising. Based on topological inconsistency and universal nature rules, data inconsistency can be found out. In post-classification, data inconsistency labelled by point can be provided to operators to modify and assure data quality in land cover mapping. This algorithm is suitable for other spatial inconsistency detection between rules derived from nature law only by changing the parameters according to land cover types. Due to spatial uncertainty, the result could appear over-detection, thus taking into account of the remote sensing image to filter spurious logical inconsistency, and to find reality inconsistency as the closed circle shown in figure 1(m) and 1(n) is the future work.
REFERENCES
Arsanjani, J., Tayyebi, A., Vaz, E., 2016. GlobeLand30 as an alternative fine-scale global land cover map: challenges, possibilities, and implications for developing countries. Habitat International, 55, pp. 25-31.
Bai, Y., Feng, M., Jiang, H., et al., 2014. Assessing consistency of five global land cover data sets in China. Remote sensing, 6(9), pp. 8739-8759.
Cai, X., Chen, X., Wang, T., et al., 2006. Remote sensing expert classification method based on patch spatial relationship. Geomatics and Information Science of Wuhan University, 31(1), pp. 321-324.
Chen B, Huang B, Xu B., 2017. Multi-source remotely sensed data fusion for improving land cover classification. ISPRS Journal of Photogrammetry and Remote Sensing, 124: 27-39.
Chen, J., Liu, W., Li, Z., et al., 2007. Detection of spatial conflicts between rivers and contours in digital map updating. International Journal of Geographical Information Science, 21(10), pp. 1093-1114.
Chen, J., Ban, Y., Li, S., 2014. China: open access to earth land-cover map. Nature, 514(7523), pp. 434.
Chen, J., Chen, J., Liao, A., et al., 2015. Global land cover mapping at 30m resolution: a POK-based operational approach. ISPRS Journal of Photogrammetry and Remote Sensing, 103, pp. 7-27.
China's methodology and experience. ISPRS - International Archives of the Photogrammetry, Remote Sensing and Spatial Information Sciences, XL-4(4), pp. 41-50.
Cockcroft, S., 1997. A taxonomy of spatial data integrity constraints. GeoInformatica, 1(4), pp. 327-343.
Eitelberg D A, van Vliet J, Doelman J C, et al., 2016. Demand for biodiversity protection and carbon storage as drivers of global land change scenarios. Global Environmental Change, 40: 101-111.
Fan, W., 2015. Data quality: From theory to practice. Sigmod Record, 44(3), pp. 7-18.
Gadish, D., 2001. Inconsistency detection and adjustment of spatial data using rule discovery. Guelph: University of Guelph, pp. 42-59.
Godinho S, Guiomar N, Machado R, et al., 2016. Assessment of environment, land management, and spatial variables on recent changes in montado land cover in southern Portugal. Agroforestry Systems, 90(1): 177-192.
Gómez C, White J C, Wulder M A., 2016. Optical remotely sensed time series data for land cover classification: A review. ISPRS Journal of Photogrammetry and Remote Sensing, 116: 55-72.
Grekousis, G., Mountrakis, G., Kavouras, M., 2015. An overview of 21 global and 43 regional land-cover mapping products. International Journal of Remote Sensing, 36(21), pp. 5309-5335.
Groom, G., Fuller, R., Jones, A., 1996. Contextual correction: techniques for improving land cover mapping from remotely sensed images. International Journal of Remote Sensing, 17(1), pp. 69-89.
Heipke, C., Woodsford, P., Gerke, M., 2008. Updating geospatial databases from images. Advances in Photogrammetry, Remote Sensing and Spatial Information Sciences, Taylor & Francis, London, pp. 355-362.
Liu, Y., Guo, Q., Kelly, M., 2008. A framework of region-based spatial relations for non-overlapping features and its application in object based image analysis. ISPRS Journal of Photogrammetry and Remote Sensing, 63(4): 461-475.
Mack B, Leinenkugel P, Kuenzer C, et al., 2017. A semi-automated approach for the generation of a new land use and land cover product for Germany based on Landsat time-series and Lucas in-situ data. Remote Sensing Letters, 8(3): 244-253.
Mäs S., 2007. Reasoning on spatial semantic integrity constraints. Spatial Information Theory, pp. 285-302.
Qiao, C., Shen, Z., Wu, N., et al., 2011. Remote sensing image classification method supported by spatial adjacency. Yaogan Xuebao- Journal of Remote Sensing, 15(1), pp. 88-99.
Qiao, C., Wang, J., Shang, J., et al., 2015. Spatial relationship-assisted classification from high-resolution remote sensing imagery. International Journal of Digital Earth, 8(9), pp. 710-726.
Salvati L, Sateriano A, Bajocco S., 2013. To grow or to sprawl? Land cover relationships in a Mediterranean city region and implications for land use management. Cities, 30(3):113-121.
Ubeda T, Egenhofer M. Topological error correcting in GIS. Advances in Spatial Databases. Springer Berlin/Heidelberg, 1997: 281-297.
Wang R Y, Storey V C, Firth C P., 1995. A framework for analysis of data quality research. IEEE transactions on knowledge and data engineering, 7(4): 623-640.
Xiao, S., 2013. Detection of spatial inconsistencies in land use data updating. The Hong Kong Polytechnic University, pp.30-47.
Zhang, D., Grégoire, É., 2011. The landscape of inconsistency: A perspective. International Journal of Semantic Computing, 5(03), pp. 235-256.